HAL Id: hal-02566719
https://hal.umontpellier.fr/hal-02566719
Submitted on 7 May 2020HAL is a multi-disciplinary open access archive for the deposit and dissemination of sci-entific research documents, whether they are pub-lished or not. The documents may come from teaching and research institutions in France or abroad, or from public or private research centers.
L’archive ouverte pluridisciplinaire HAL, est destinée au dépôt et à la diffusion de documents scientifiques de niveau recherche, publiés ou non, émanant des établissements d’enseignement et de recherche français ou étrangers, des laboratoires publics ou privés.
Impact of liquid sodium corrosion on microstructure and
electrical properties of yttrium-doped thoria prepared
by co-precipitation
Y. Cherkaski, Nicolas Clavier, L. Brissonneau, N. Dacheux
To cite this version:
Y. Cherkaski, Nicolas Clavier, L. Brissonneau, N. Dacheux. Impact of liquid sodium corrosion on mi-crostructure and electrical properties of yttrium-doped thoria prepared by co-precipitation. Corrosion Science, Elsevier, 2020, pp.108721. �10.1016/j.corsci.2020.108721�. �hal-02566719�
1
Impact of liquid sodium corrosion on microstructure
and electrical properties of yttrium-doped thoria
prepared by co-precipitation
Y. Cherkaski
1,2, N. Clavier
2,*, L. Brissonneau
1, N. Dacheux
21
CEA-DES-IRESNE-DTN Cadarache F-13108 Saint-Paul-Lez-Durance, France
2
ICSM, Univ Montpellier, CEA, CNRS, ENSCM, Bagnols sur Cèze, France
* Corresponding author:
Dr. Nicolas CLAVIER
ICSM, Univ Montpellier, CEA, CNRS, ENSCM, Site de Marcoule
BP 17171
30207 Bagnols sur Cèze France
Phone : + 33 4 66 33 92 08 Fax : + 33 4 66 79 76 11
2
Abstract :
Within the development of SFR nuclear reactors, yttrium-doped thoria has been suggested by previous researchers as an electrolyte in sensors monitoring oxygen in liquid sodium. In this paper, Th1-xYxO2-x/2 electrical properties were assessed by impedance
spectroscopy before their chemical durability was evaluated in liquid sodium. Pellets always kept their mechanical integrity although sodium penetration was evidenced through the modification of the cleavage surfaces. Post-immersion impedance spectroscopy showed a decrease of grain boundaries contribution, even if the global conductivity was not significantly affected. These good performances could be strongly affected by the presence of impurities since silicon-doping increased the sodium penetration.
Keywords : yttrium-doped thoria, sodium corrosion, electrical properties, impedance
3
1. Introduction
Among the concepts designed in the frame of the fourth generation of nuclear reactors [1], which all aim to provide safer and resource-saving energy, France has opted for the development of a Sodium-cooled Fast Reactor (SFR), owing to its historical experience in this field through the operation of the Phenix and Super-Phenix units [2]. In such reactors, the chemistry of liquid sodium acting as a coolant in the primary vessels must be carefully monitored. Particularly, the oxygen content, which controls the corrosion rate of the stainless steel claddings, must be kept under few ppm [3]. With this aim, the use of potentiometric sensors is envisaged. They are usually composed of an internal metal/oxide reference, separated from the liquid sodium media by a ceramic electrolyte ensuring the conduction of O2- anions. As a key component of the device, the electrolyte material should respect several requirements in order to guarantee good performances over a time period compatible with the reactor operation (i.e. at least 18 months). The ceramic must be purely ionic conductor, thermo-mechanically resistant and compatible with sodium at high temperature (about 400°C).
In this context, the use of fluorite-type yttria-thoria solid solutions (i.e. Th1-xYxO2-x/2,
space group Fm-3m) was suggested very early on [4, 5] since the Y3+-doping produces oxygen vacancies and turns the ceramic into an ionic conductor [6]. For low values of the x doping rate (typically from 0.01 to 0.1 depending on the study reported), the conductivity was found to increase proportionally with the yttrium content [7, 8]. For larger doping rates, a maximum in the conductivity was generally observed around x = 0.15 [9, 10], with a decrease at higher values due to elastic interactions between oxygen vacancies and dopants, as observed for all similar fluorite-type oxides [11]. The effect of temperature on the conductivity of Th1-xYxO2-x/2 ceramics was also investigated on a wide range of temperature,
typically going from 300 to 1100°C. Depending on the authors and the temperature domain studied, the activation energy related to ionic conduction was found to vary between 1.25 and 1.46 eV for x ≤ 0.01 and dropped down to 1 - 1.15 eV when yttrium loading reached 0.08 ≤ x ≤ 0.15 [9, 12-14]. Also, these values can be lowered when working at high temperature (i.e. above 1100°C) [13], as the defects association (YM- pairs) decreases [8, 15].
Even if yttrium-doped thoria is generally considered to be much less sensitive to sodium corrosion compared to zirconia [16], also frequently used in oxygen sensors [17], only very few studies are reported in the literature regarding its chemical durability. Indeed, different potential failures were evidenced, but appear to be mainly linked with mechanical effects [16, 18-21]. Fractures often occurred very rapidly after contact with liquid sodium
4 between 360 and 400°C, but more likely due to thermal shock rather than to sodium corrosion [16, 22]. Several authors also reported on the embrittlement of the electrolyte ceramic through the formation of cracks during Na-testing at 400°C. In this case, they correlated the phenomena to the localized corrosion of grain boundaries due to the presence of silicon as an impurity [23, 24]. Jakes et al. confirmed the crucial role of the electrolyte ceramic purity, and were able to identify Na2ThO3, Na2ThSiO5 and Na2SiO5 in the corrosion layer formed after
1400 to 3300 hours of contact with liquid sodium in the 320-450°C range [25]. Nevertheless, only few authors directly evidenced the effect of sodium corrosion on the ceramic microstructure [24, 26]. Among them, Wheatley et al. observed the bulk material after immersion in liquid sodium at 400°C and pointed out both trans- and intergranular fractures, this latter being a clear sign of grain boundaries weakening. They also showed that the sodium penetration rate increased with the concentration of dissolved oxygen in the 100-500 ppm range [27].
Moreover, only very few studies, if any, addressed the electrical properties of Th1-xYxO2--x/2 ceramic electrolytes after their corrosion. As it constitutes a key-point to be
assessed in order to guarantee the efficient operation of electrochemical oxygen sensors in aggressive liquid sodium media, this paper is then dedicated to the impact of sodium corrosion on the microstructure and the conductivity of yttrium-doped thoria ceramics. In a previous study [28], the preparation of the samples through oxalic co-precipitation and further sintering at high temperature was reported, leading to dense and homogeneous pellets with controlled microstructures. As a continuation of this work, this paper first investigated their initial electrical properties. Corrosion tests in liquid sodium bearing a high concentration in oxygen were then undertaken at 500°C for several hours. The impact of these tests on the microstructure of the pellets and their electrical properties was further investigated by the means of SEM observations and impedance spectroscopy measurements. Finally, samples voluntarily incorporating low amounts of silicon were also studied to estimate the influence of impurities. Based on these results, the effect of the synthesis method initially employed for the preparation of the Th1-xYxO2-x/2 ceramics as well as that of the yttrium incorporation, on
their electrical properties will be discussed. Advanced insights on the Na-corrosion mechanisms of the samples, including the potential formation of secondary phases, will also be deduced from impedance spectroscopy measurements and thermodynamic calculations.
5
2. Experimental
2.1 PREPARATION AND CHARACTERIZATION OF (TH1-XYX)O2-X/2 OXIDE SAMPLES
All the chemicals used during the preparation of the samples, including thorium nitrate Th(NO3)4.5H2O, were supplied by Sigma-Aldrich and were analytical grade (purity ≥ 99%).
As already reported in our previous works [12, 28], thorium-yttrium mixed oxides, Th1-xYxO 2-x/2 (0.01 ≤ x ≤ 0.22), were prepared through the protocol described by Horlait et al. [29] and
based on the precipitation of oxalate precursors. In this purpose, acidic solutions containing Th4+ and Y3+ cations in nitric media were mixed in the desired ratio with a large excess of oxalic acid. In order to study the potential effects of impurities, 0.2 to 1 wt.% of Si was also added in some cases. The precipitate rapidly formed was separated by centrifugation at 13000 rpm, washed several times with water then ethanol, and finally dried overnight in an oven at 90°C. Thorium-yttrium oxalates were further converted into final oxide powders by heating for 4 hours at 600°C under air. Such operating conditions ensured both the complete decomposition of the organic moieties (leading to a low amount of residual carbon in the samples), as well as the preservation of a high specific surface area [30] aiming to optimize the sintering capability of the powders.
The oxide samples were then shaped by uniaxial pressing at 200 MPa. A typical powder mass of about 200 mg was used, and resulted in pellets of 8 mm in diameter and about 1.3 mm in height (green density ≈ 45%). Following the results reported in [28], the green pellets were densified at two different temperatures (1600 and 1700°C) for three heating times (2, 4 and 8 hours). In these conditions, dense pellets (approximately 6 mm in diameter and 1.1 mm in height) were systematically obtained for doping rates in the range 0.08 ≤ x ≤ 0.22 (typically above 96% of the theoretical density) while lower densities were observed at 1600°C for x = 0.01 (Table 1). A low doping rate in yttrium was also found to be more favorable in terms of grain growth, with average grain sizes 2 to 4 times higher than for the other compositions sintered at 1700°C. This set of samples then allows to study in parallel the effects linked to the chemical composition and to the microstructure of the electrolyte materials regarding liquid sodium corrosion.
2.2 SODIUM CORROSION TESTS
Static corrosion tests in liquid sodium were undertaken in dedicated 316L steel containers filled with 6-7 g of high purity grade sodium supplied by MSSA (Métaux Spéciaux). Prior to experiments, the oxygen concentration, which is a crucial point to consider
6 when assessing corrosion kinetics, was estimated to about 80 ppm by MSSA through sodium distillation under vacuum at 300°C and chemical analysis of the Na2O residue. This value,
which is higher than that usually accepted for continuously purified sodium in reactor (typically below 5 ppm) [31], was chosen on purpose to run our tests. It is expected to increase significantly the corrosion kinetics and then represents penalizing conditions for the performance of the electrolyte ceramic. Indeed, previous studies undertaken at high oxygen concentration (typically around 140 ppm) systematically led to the failure of the ceramics and concluded to the important effect of oxygen on long-time performance [24, 26]. Nevertheless, due to the difficulties linked with controlled sodium purification, corrosion experiments at very low oxygen contents were out of the scope of this paper.
Sintered pellets of Th1-xYxO2-x/2 were then inserted in a homemade sample holder
aiming at a total immersion of the ceramics in a few grams of liquid sodium. The two parts of the steel vessel containing sodium and the samples were further sealed by Cryotherm RV connectors, which insured tightness to air up to 600°C. They were finally moved into an oven for corrosion tests at 500°C during 100 to 820 hours.
At the end of the test, the steel container was moved out of the oven, put upside down in order to allow the sodium to flow out of the pellets and cooled down at room temperature. Residual sodium was kept for further chemical analyses. The sample holder was carefully extracted then soaked into ultra-pure ethanol in order to remove residual traces of sodium. This process, based on the solubilisation of sodium ethoxide [32], was generally reported to be harmless for the materials studied [33].
Table 1. Characteristics of Th1-xYxO2-x/2 sintered pellets used in this study [28].
x 0.01 0.08 0.15 0.22
Calculated density (g.cm-3) 9.95 9.58 9.24 8.88
Sintering conditions Average grain size (µm) / density (%TD)
1600°C - 4h 1.16 / 92 0.41 / 96 0.39 / 98 0.36 / 98
1600°C - 8h 1.26 / 93 0.45 / 98 0.40 / 99 0.41 / 98
1700°C - 2h 2.13 / 95 0.60 / 98 0.45 / 99 0.51 / 99
1700°C - 8h 4.01 / 98 0.87 / 98 0.71 / 99 0.83 / 99
Uncertainty attached to grain size : ± 10 % Uncertainty attached to density values : ± 1 %
7
2.3 CHARACTERIZATION BY SEM AND SI
Scanning Electron Microscopy (SEM). Prior to corrosion tests in liquid sodium, pristine
Th1-xYxO2-x/2 pellets were observed by the means of a FEI Quanta 200 ESEM FEG
microscope equipped with a Large Field Detector (LFD) and a Back-Scattered Electron Detector (BSED). A low acceleration voltage of 2 – 3.1 kV coupled with high vacuum conditions was chosen to observe the samples without any additional preparation step such as metallization. After the corrosion tests, the post-immersion observation of the pellets was conducted with a LaB6 gun EVOHD15MA from Zeiss using a BSED detector.
Complementary X-EDS analyses were also performed by the means of a SDD Xmax50 from Oxford Instruments. It is important to note that the use of different microscopes and detectors could generate slight variations in contrast of the micrographs that should not be interpreted as microstructural evolutions.
Electrical characterizations. The electrical properties of the samples were investigated
before and after sodium corrosion tests by means of impedance spectroscopy, using a Solartron 1260 impedancemeter between 0.1Hz and 10MHz. As electron hole conduction dominates for yttrium-doped thoria at elevated oxygen partial pressures (typically above 10-6 atm.) [7-9, 34], the experiments were undertaken between 350°C and 700°C under Ar/H2 3%
atmosphere. In such conditions, which correspond to an equivalent pO2 of about 10-30 atm. in
our system, the material is expected to be a pure ionic conductor [8].
Prior to analyses, both sides of the pellets were coated with platinum Metalor 6082 paint. Three samples were then simultaneously analyzed in order to compare their properties in the exact same conditions of temperature and oxygen partial pressure. The oxygen partial pressure was monitored thanks to a zirconia oxygen pump-sensor device (GEN'AIR, Setnag) while temperature was controlled with a ± 1°C accuracy in the 350-700°C range. The impedance diagrams collected (Nyquist representation) were fitted with the ZView software (Scribner Associates Incorporated). The numbers in the diagrams indicate the logarithm of the measuring frequency.
It is important to note that for each chemical composition and sintering conditions considered, several pellets coming from the same batch of powder were analyzed. Such double or triple checking led to estimate the uncertainty attached to the conductivity value to about 20 to 30%
8 for most of the samples studied. This important bias was mainly linked with the difficulties encountered during the fitting procedure.
Finally, activation energy related to the ionic conduction of the samples was determined from experiments performed at different temperatures using an Arrhenius law such as [35, 36] :
(1.)
3. Results
3.1 ELECTRIC CHARACTERIZATION OF PRISTINE OXIDES SAMPLES
As a matter of example, the Nyquist diagrams collected for the samples sintered during 8 hours at 1600°C are gathered in Figure 1. For the lowest yttrium incorporation rate considered (x = 0.01), the first arc located at high frequency corresponds to a capacitance ranging from 10-12 to 10-11 F and was assigned to the bulk contribution. The second one, which was found in a medium range of capacitance (i.e. around 10-9 F) corresponds to the blocking phenomena. In this study, they were mainly assigned to the grain boundaries, as the very high density of the samples precludes the presence of numerous pores within the pellets [28]. Also, the good separation between the first two arcs argues in favor of a very small pore size [37]. Finally, the last semi-circle observed at low frequency (10-6 F) represents the electrode contribution. It is important to note that for the highest yttrium contents studied (i.e. x ≥ 0.08), only two arcs were observed on the Nyquist diagrams, and assigned to the bulk (high frequencies range: 10-12 - 10-11 F) and electrode (low frequencies domain around 10-6 F) contributions.
9
Figure 1. Nyquist diagrams collected at 500°C on sintered Th1-xYxO2-x/2 samples (T =
1600°C, t = 8h). Full range of frequencies investigated and focus on the high frequencies domain for 0.08 ≤ x ≤ 0.22 : x = 0.01 (); 0.08 (); 0.15 (); 0.22 ().
The bulk conductivity of the samples was then determined through the fitting of the Nyquist diagrams (Table 2) and revealed an increase by about one order of magnitude with the yttrium content between x = 0.01 et x = 0.08 (e.g. from 2.4×10⁻⁴ S.m-1 to 1.7×10⁻³ S.m-1 at 500°C). This difference directly arises from the formation of oxygen vacancies concomitantly to the Y3+ incorporation in the fluorite-type structure of ThO2. However, the conductivity did
not follow a linear variation versus the yttrium substitution rate x, as close values were generally obtained in the 0.08 ≤ x ≤ 0.22 range (typically from around 5×10⁻³ S.m-1 at 500°C to 3×10⁻¹ S.m-1 at 700°C). Thus, it was impossible to establish a direct connection between the conductivity and the yttrium content in the solid (i.e. with the amount of oxygen vacancies).
10 However, this trend remains in excellent agreement with the results reported in the literature, which generally state a maximum conductivity between x = 0.08 and x = 0.15 [9, 14], although few authors investigated Y3+ incorporation rate as high as x = 0.22.
Table 2. Comparison of the Th1-xYxO2-x/2 electrolyte ceramics bulk conductivities determined
in this work (expressed in S.m-1) with selected values reported in the literature [9, 14, 38].
Doping rate (x)
500°C 600°C 700°C 800°C
This study Gabard [38]
This study Schouler [14]
This study Schouler [14] Gabard [38] Lasker [9] 0.01 2.410-4 6.010-4 2.410-3 1.610-3 1.010-2 1.010-2 7.510-2 7.110-2 0.08 1.710-3 5.310-3 1.410-2 - 2.010-1 - 2.810-1 - 0.15 4.210-3 6.510-3 2.510-2 2.510-2 3.010-1 2.610-1 3.910-1 1.610-1 0.22 6.110-3 - 1.410-2 - - - - -
The variation of the conductivity was then examined as a function of the temperature to assess the activation energies (Table 3). Whatever the yttrium incorporation rate, a linear trend was observed in the variation of ln (T) versus the reciprocal temperature, meaning that no modification occurred in the conduction mechanism in the whole temperature range studied (i.e. 350°C-700°C). Owing to the atmosphere used during the measurements (Ar/H2
3%) and as it was stated before, one can then assume that the conduction is purely ionic in our experimental conditions [8].
Table 3. Activation energies (expressed in eV) related to the bulk conductivity of
Th1-xYxO2-x/2 ceramics prepared in various sintering conditions.
x
EA (eV) 1600°C – 8h 1700°C – 2h 1700°C – 8h 0.01 1.27 1.27 1.30 0.08 1.14 1.15 1.15 0.15 1.15 1.21 1.20 0.22 1.23 1.33 1.28Uncertainly attached to EA value : ± 0.1 eV
11 Finally, as the Th0.99Y0.01O1.995 samples presented an additional ark on the Nyquist
diagrams, the conductivity assigned to grain boundaries was evaluated for this sample. It was found to be about one order of magnitude lower than that obtained for the bulk. However, this difference tended to decrease when increasing the temperature of the measurement (typically
from 1.0210-4
S.m-1 and 1.3010-5 S.m-1 at 450°C for bulk and grain boundaries conductivities, respectively, to 7.2010-3 S.m-1 and 3.2710-3 S.m-1 at 650°C for samples obtained after sintering at 1600°C for 8 hours). Moreover, the conductivity values remained mostly unchanged for the four sintering conditions investigated. Also, as for the bulk
conductivity, the variation of ln (T) was found to be linear versus the reciprocal temperature, which led to the determination of activation energies (Table 4). This latter were found to be 0.3 to 0.4 eV higher than those determined for the bulk, which appears in good agreement with the literature. Indeed, Guo et al. also depicted variations of the activation energy when going from grain to grain boundaries conductivity of Y-doped fluorite-type oxides. This increase was found to vary from 0.2 eV for yttrium doped zirconia to 0.6 eV for yttrium doped ceria. It was interpreted in the frame of the space charge model [39].
Table 4. Activation energies associated to grain boundaries conductivity in Th0.99Y0.01O1.995
samples sintered for various conditions.
Sintering
conditions 1600°C – 4h 1600°C – 8h 1700°C – 2h 1700°C – 8h
EA (eV) 1.63 ± 0.10 1.64 ± 0.10 1.68 ± 0.10 1.70 ± 0.10
3.2 BEHAVIOR IN LIQUID SODIUM
The Th1-xYxO2-x/2 electrolyte ceramics were further tested in liquid sodium for several
hundredths of hours at 500°C (Table 5). Beyond exploring various yttrium incorporation rates, different sintering conditions were also considered. Particularly, increasing the sintering temperature from 1600 to 1700°C led to the variation of the average grain size by a factor of 2 to 3 [28], which allowed us to assess the effect of the microstructure on the resistance of the ceramics to liquid sodium corrosion. For all the samples, the mass loss was estimated while surface and fractographic SEM observations were conducted on the pellets.
12
Table 5. Summary of the corrosion tests performed in liquid sodium at T = 500°C on the
Th1-xYxO2-x/2 ceramics.
x Sintering conditions Test duration (h) Analyzed zones
0.01 1600°C – 8h 100 Surface + Bulk 820 Surface 1700°C – 8h 100 Surface 200 Surface + Bulk 500 Bulk 1700°C – 2h 100 Surface 500 Surface 0.08 1600°C – 8h 100 Surface + Bulk 820 Surface 1700°C – 8h 100 Surface + Bulk 200 Bulk 1700°C – 2h 500 Surface + Bulk 0.15 1600°C – 8h 100 Surface + Bulk 820 Surface 200 Bulk 300 Bulk 1700°C – 8h 100 Bulk 200 Bulk 300 Bulk 500 Bulk 1700°C – 2h 500 Surface + Bulk 0.22 1600°C – 8h 100 Surface 820 Surface 1700°C – 8h 100 Surface 200 Bulk 1700°C – 2h 500 Surface + Bulk
Whatever the duration of the corrosion test, the chemical composition of the sample and the sintering conditions, the visual aspect of the pellets did not appear to be significantly modified, as no embrittlement or cracks formation was observed. Moreover, the mass variation of the pellets was systematically found to be negligible. The very high chemical durability of the samples at the macroscopic scale was also enlightened through ICP-AES measurements conducted on soda coming from the hydrolysis of sodium contacted with Th0.85Y0.15O1.925 for 500 hours. In this case, the analyses always remained under the detection
limit (i.e. 0.1 ppm) and did not evidence any thorium nor yttrium in the leachate.
In order to evidence the impact of the yttrium content on the chemical durability at the microscopic scale, 820 hours long sodium corrosion tests were further undertaken on samples sintered at 1600°C for 8 hours. The samples were first marked using a diamond indentor to monitor the same location of the samples through SEM. Different zones were then selected
13 and observed before and after the corrosion tests (Figure 2). For all the locations investigated, no significant evolution of the surface topology was noted (the difference of contrast observed between the two SEM micrographs was due to the use of different detectors). Indeed, no additional micro-cracks nor pores were detected after the corrosion tests. Furthermore, it is important to note that no significant digging or grooving of grain boundaries was observed while it is commonly described during hydrometallurgical reprocessing of ceramics (i.e. aqueous dissolution) [40] and was already reported for corrosion processes in liquid metal media [41]. Based on these observations, and even if EDS experiments were not performed at the surface of corroded samples, it could be assumed that the chemical composition of the samples remained unchanged all during the corrosion tests.
Similarly to the surface, several fracture observations were undertaken before and after the sodium corrosion (t = 100-820 hours) for samples sintered during 8 hours at 1600°C and 1700°C (Table 5). From a general point of view, micrographs of pristine sintered samples mostly exhibited transgranular fractures. SEM observations (see figure S2 supplied as supplementary data) revealed the presence of numerous cleavage planes, which attested from the very high cohesion between the grains constituting the ceramic material. Also, one can note that the samples prepared with x = 0.01 presented significant amounts of both intra and inter-granular porosity, in good agreement with the results of our previous works dedicated to Th1-xYxO2-x/2 sintering [28].
14
x Pristine pellet After Na corrosion
0.01
0.15
Figure 2. SEM micrographs of Th1-xYxO2-x/2 samples before and after Na corrosion test
(T = 500°C, t = 820 h).
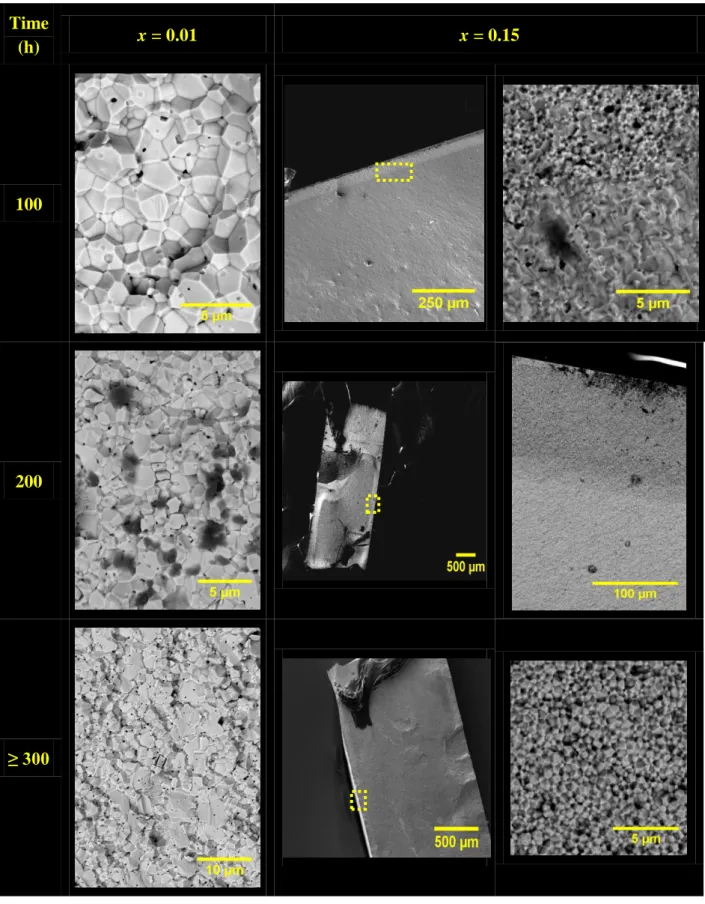
After sodium corrosion, the samples with x = 0.01 clearly exhibit intergranular fractures on the outer layer of the pellet. Simultaneously, both intergranular and intragranular fractures were detected in the bulk (Figure 3), while complementary SEM-EDS analyses revealed the presence of sodium in the region close to the surface (exhibiting intergranular fracture) and none in the bulk. Nevertheless, no clear demarcation was observed, which hampered the possibility to accurately correlate the duration of the sodium corrosion tests with the progression of a roll-front. Also, as the results obtained were similar for the two sintering conditions examined, neither the porosity nor the grain size variation (from 1 to 4 µm) seemed to play a significant role on the Na penetration in the prepared Th1-xYxO2-x/2
15 Time (h) x = 0.01 x = 0.15 100 200 ≥ 300
Figure 3. SEM observations of Th0.99Y0.01O1.995 (1700°C - 8h) and Th0.85Y0.15O1.925 (1600°C -
8 h) pellets obtained after corrosion in liquid sodium at 500°C for various durations.
In contrast to what was observed for the samples presenting the lowest yttrium rate, two distinct zones were clearly evidenced after the Na-corrosion of Th0.85Y0.15O1.925 ceramics.
16
types of cleavage surfaces. From the surface to 50 µm below, the fractures appeared to be mainly intergranular. This observation, which was made on both sides of the pellet, appeared to be characteristic of the sodium corrosion of oxides [42, 43]. Nevertheless, the authors systematically assigned such an effect to the presence of SiO2 as an impurity in the grain
boundaries, which is not the case in this study. Beyond this depth, the bulk material was characterized by the transgranular fractures already evidenced in the pristine samples. The corroded depth was also found to increase with the immersion time, and reached about 110 µm for a 200 hours corrosion test. In this case, a complementary EDS scanning allowed us to confirm the presence of sodium overall the intergranular fracture region while it remained under the limit of detection in the transgranular one (Figure 4). Such sodium penetration in the material could be explained by the existence of cracks preexisting in the material that further opened during the corrosion process. However, it would account for the existence of two distinct habit planes in the fractured samples. It is then more likely that liquid sodium penetrated the samples through the grain boundaries and/or triple junctions, even if no digging or grooving was observed in the surface micrographs.
Figure 4. Quantitative variation of the Na concentration on a 165 µm line crossing the
boundary between different cleavage surfaces observed for Th0.85Y0.15O1.925 pellet submitted
17 Based on the observations made on Th0.85Y0.15O1.925, the sodium penetration rate in the
solid then averaged around 0.5 µm.hour-1 during the first 200 hours of the corrosion test. Nevertheless, for longer corrosion tests in liquid sodium, the determination of the penetration rate became difficult as the limit between inter- and intragranular fractures zones was found to blur. Experiments were also undertaken for samples with x = 0.08 and x = 0.22, although it was not possible to investigate numerous reaction times. Nevertheless, the general trend appeared to be similar to that observed for x = 0.15. As a matter of example, the sodium penetration rate was estimated to 0.45 µm.hour-1 for x = 0.22, which acts in favor to a low impact of the yttrium incorporation on the corrosion rate. The peculiar phenomena observed for x = 0.01 could then be linked to the microstructure of the ceramics, which presented a more important porosity associated to a larger average grain size.
3.3 ELECTRIC CHARACTERIZATION AFTER CORROSION TESTS BY LIQUID SODIUM
Even if the failure of oxygen electrochemical probes operating in liquid sodium was generally correlated to the corrosion of the electrolyte ceramics [16], only few studies were dedicated to the evolution of the electrical properties for yttrium-doped thoria consequently to the immersion of the materials in liquid sodium. Impedance spectroscopy measurements were then conducted on corroded samples in order to point out if the blocking contributions, usually assigned to the presence of grain boundaries in the ceramics, could be affected by the intergranular attack of the pellets. With this aim, Th1-xYxO2-x/2 samples (0.01 ≤ x ≤ 0.22) were
immersed in liquid sodium at 500 °C for 100 to 200 hours. The SI measurements were undertaken following the methodology already described. Nevertheless, as the pellets were difficult to handle and to prepare after the corrosion tests, the electrical characterizations were limited to a few samples only.
As a matter of example, the Nyquist diagrams recorded for samples with x = 0.01 and
x = 0.22, both before and after the immersion in liquid sodium, are presented in Figure 5.
Similarly to the data treatment detailed in the first section of the paper, the Nyquist diagrams were deconvoluted in two or three contributions. For all the yttrium incorporation rates, the bulk conductivities (Table 6) did not vary from original values throughout the corrosion test, and whatever its duration. Owing to the uncertainties attached to the measurement (up to ± 20%), the bulk conductivity could be considered as dimly affected by the sodium corrosion.
18
Figure 5. Nyquist diagrams collected from pristine (blue) and Na-corroded pellets (t = 100
hours, red) for Th0.99Y0.01O1.995 and T = 550°C (a) and for Th0.78Y0.22O1.89 and T = 500°C (b).
Also, when addressing the samples containing the higher amounts of yttrium (i.e. x > 0.01), the corrosion test did not modify the general aspect of the Nyquist diagram. As a result, no contribution assigned to blocking phenomena was observed, as it was the case for the pristine pellets. On the contrary, the immersion of Th0.99Y0.01O1.995 samples in liquid sodium
led to a strong modification of their electrical properties. Indeed, the amplitude of the contribution assigned to the blocking processes was found to be significantly decreased, which resulted in the increase of the total conductivity by a factor of 4 (Table 6), then slightly approaching the bulk conductivity. As the blocking phenomena were mainly assigned to grain boundaries in the pristine samples, this result then confirmed that the interaction with sodium mainly occurred at the grain boundaries level during the corrosion process. Moreover, the activation energy attached to the blocking contribution was lowered by about 0.2 eV after immersion in liquid sodium. Nevertheless, the values determined from samples recovered after 100 and 200 h corrosion tests remained very close, which precludes any conclusion on the impact of corrosion time.
0 100000 200000 300000 400000 -400000 -300000 -200000 -100000 0
Z'
Z
''
y1#27-550-arh2-10-26-6ma-500µa.z y1#27-550.z Avant Na7
6
6
5
5 4 3 2 1
4
3
2
1
7
Après NaNa-corroded PristineZ
’’
(
)
Z’ (
)
0 25000 50000 75000 -75000 -50000 -25000 0Z'
Z
''
y22#26-500°c-10-25-500mv-6ma.z y22#26-500 - ap YC.z Pristine7
6
5
4 3 2
1
6
5
4
3 2 1
7
Na-corrodedZ
’’
(
)
Z’ (
)
a)
b)
19
Table 6. Conductivity values (expressed in S.m-1) attached to bulk and blocking contributions of pristine and Na-corroded samples, measured at 500°C under Ar/4%H2 atmosphere.
Bulk (S.m-1) Block (S.m-1)
Pristine Na-corroded Pristine Na-corroded x = 0.01 (100h Na) 3.110-4 3.710-4 4.610-5 1.810-4 x = 0.01 (200h Na) 3.210-4 2.910-4 5.310-5 2.310-4 x = 0.08 1.410-3 9.910-4 x = 0.15 3.710-3 3.810-3 x = 0.22 2.310-3 1.510-3 3.4 EFFECT OF IMPURITIES
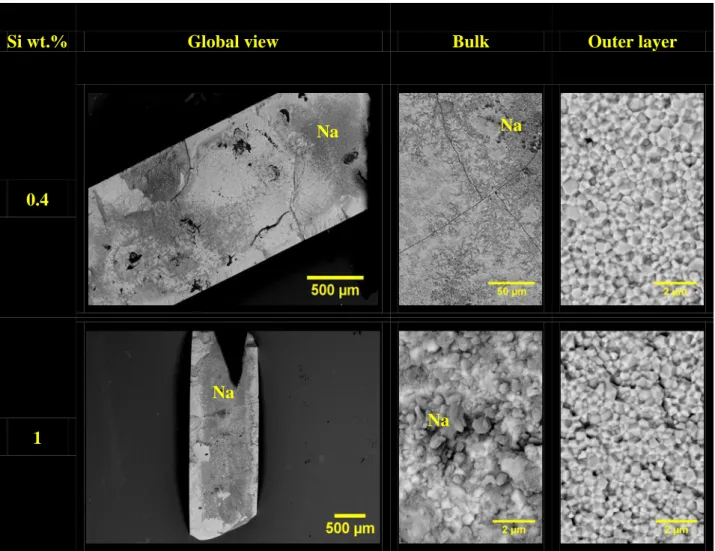
Finally, and even if the different characterizations of the material all concluded to the preparation of highly pure ceramics, the presence of extremely small amounts of impurities within the grain boundaries can not be fully excluded. In parallel, several authors already evidenced a drastic decrease of the chemical durability of Th1-xYxO2-x/2 ceramics when
impurities were detected, especially in the case of silicon [23-25, 27]. Na-corrosion tests were then performed on Th0.85Y0.15O1.925 samples incorporating 0.2 to 1 wt.% in silicon (i.e. 1.5 and
7.3 % in mole of cations, respectively) to evaluate the impact of the Si-incorporation on the ceramics behavior.
The deleterious character of silicon was first evidenced during the fabrication of the samples. Indeed, for the highest amount tested (i.e. 1 wt.%), the pellets obtained after sintering at 1700°C for 8 hours, were not found to be mechanically resistant. In these conditions, only fragments were contacted with liquid sodium. After 500 hours of corrosion test at 500°C, only the sample incorporating 0.2 wt.% of silicium was found to keep its mechanical integrity. Indeed, and even if residual sodium was detected at the surface of the pellet, only some microcracks were observed. Conversely, increasing the amount of silicon in the pellet led to an important embrittlement of the samples through the formation of an important number of cracks (Figure 6). Moreover, all the micrographs recorded after fracturing of the corroded samples revealed a sodium penetration in the whole pellets thickness whatever the silicon amount considered. In parallel, the fracture appeared to be
20 mainly intergranular, which evidenced once again the penetration of sodium through the grain boundaries. For the highest Si-doping studied, the bulk of the pellet appeared to be completely covered by sodium. In these conditions, the dark spots observed were associated to the presence of residual metallic sodium which further reacted with air to yield sodium carbonates and soda. Nevertheless, although these results clearly back up the harmful character of silicon pollution on the chemical durability of Th1-xYxO2-x/2 ceramics in liquid sodium, no sign of
secondary phase, such as Na2ThO3 or Na2SiO3 was evidenced.
Si wt.% Global view Bulk Outer layer
0.4
1
Figure 6. SEM micrographs of Th0.85Y0.15O1.925 pellets fractured after corrosion tests in liquid
sodium at 500°C for 500 hours. Na
Na Na
21
4. Discussion
4.1 IMPACT OF PREPARATION METHOD AND CERAMICS MICROSTRUCTURE ON BLOCKING PHENOMENA
During the study of yttrium-doped ceria and zirconia, which can be seen as fluorite-type analogues to Th1-xYxO2-x/2 solid solutions [39, 44-47], different hypothesis were formulated to
explain the contribution of grain boundaries to the resistivity of the samples. Particularly, the observation of high blocking contributions for the lowest yttrium contents [14, 38, 39] questioned the links existing between the yttrium concentration, grain size and presence of impurities, on the one hand, and grain boundaries resistivity and bulk conductivity, on the other hand. Several authors working on the yttria-zirconia system pointed out the crucial role played by the impurities. Particularly, they underlined that their concentration was usually higher within the grain boundaries than in the bulk, and could enhance significantly the resistivity [45, 48, 49]. In contrast, Guo et al. assigned such an increase in the resistivity to the formation of a space-charge layer induced by yttrium-enrichment at the grain boundaries [44].
In this sense, our observations evidencing the absence of blocking phenomena for x 0.08 contrasts with previous results reporting grain boundaries contribution for such samples [38, 48, 50]. This difference probably illustrates the very high homogeneity of the cationic distribution within our samples prepared by wet chemistry methods (herein oxalic co-precipitation). Also, in this study, a prevailing role of impurities or dopant segregation appears to be very improbable. Indeed, TEM-EDS analyses undertaken on Th0.99Y0.01O1.995
samples sintered at 1600°C or 1700°C during 8 hours did not reveal any significant segregation of Y3+ towards grain boundaries or triple junctions and did not evidence the presence of unforeseen impurities (see Figure S1 supplied as supplementary material).
The model developed by Kleitz et al. [46] and further used by Gabard was then retained to explain the highest blocking contribution observed for x = 0.01 [38]. These authors assumed that the current lines going through the grain boundaries were deviated by "blockers", thereby creating a zone electrically isolated on either side of such entities, which generated a strong decrease of the ionic mobility in these regions. The increase of field lines with the conductivity then lead the blockers to be short-circuited, which can explain the absence of the grain boundaries contribution for high yttrium doping rates. As Gabard et al. also clearly observed a blocking contribution assigned to grain boundaries when working with x = 0.005 [12], one can suggest that a minimal doping rate exists, beyond which the number of charge carriers minimize the role of blockers. Based on our results, this threshold value
22 should be typically in the 0.01 ≤ x ≤ 0.08 range. It is still important to note that this phenomenon was observed in a medium range of capacitance (i.e. around 10-9 F), for which charges went through important distances, i.e. larger than the grain size and then sufficient for them to be disturbed by the blockers. Such process then cannot occur in the high frequency range.
4.2 IMPACT OF YTTRIUM CONTENT AND MICROSTRUCTURE ON CONDUCTIVITY
For the lowest yttrium incorporation rate considered in our study (x = 0.01), the activation energies related to the bulk conductivity (Table 3) were generally found to be close to 1.30 eV. They decreased when increasing yttrium content up to x = 0.08 then increased again up to x = 0.22, typically around 1.28 eV (Figure 7). These values were close to that already reported in the literature for similar materials (although prepared in different conditions) [8, 12, 14, 51, 52]. Indeed, Schouler et al. reported EA values around 1.25 eV for
yttrium doping in the 0.1-1 mol.% range which further reached 1.15 eV for higher yttrium contents up to 15%. A similar trend was also observed by Hammou when working in a higher temperature range (1000-1400°C) [13]. Additionally, he also showed an increase of the activation energy beyond x = 0.15 which was further confirmed by Hartmanova (EA = 1.32 eV
for x = 0.20) [8, 52]. The activation energy then clearly reached a minimum value between 8 and 15 mol.% in yttrium, which was correlated to the conductivity maximum. Although this behavior was already reported for numerous fluorite-type materials such as REE- or Ca-doped ceria [8, 36, 53], its origin still remained unclear. Nevertheless, it is likely to arise from the formation of YM-VÖ pairs with yttrium incorporation. Such defects tended to decrease the
energy associated to the anionic site and to lower the barrier to oxygen migration as the sites get connected with increasing yttrium content. However, complex effects can appear for high doping rates (e.g. defects clusters), leading the activation energy to rise and to a partial blocking of the conductivity [36].
23
Figure 7. Variation of the activation energy related to bulk conductivity versus the Y
incorporation rate (x) in Th1-xYxO2-x/2 solid solutions prepared in various sintering conditions :
1600°C - 8h () ; 1700°C – 2h () ; 1700°C – 8h (
●
).Additionally, it is important to note that the activation energy values remained mostly identical when varying the sintering conditions. For instance, Figure 8 gathers all the bulk conductivity data collected for x = 0.15, which present limited variations, typically in the 1.15-1.20 eV range. The microstructure of the electrolyte ceramic can be considered as a second order parameter as it did not affect significantly the electrical properties. This conclusion could appear in contradiction with the results reported by Schouler and Muccillo, who observed higher blocking contributions for large-grain microstructures [48, 54]. Nevertheless, such an effect was mostly indirect as it resulted from the increase of impurities concentration (including silicon) at the grain boundaries when increasing the grain size. Aoki
et al. also stated that the grain growth generated an important segregation of impurities
towards the grain boundaries then increased blocking phenomena [45]. For high sintering temperatures, Badwall et al. also reported similar observation in the triple junctions [55].
24
Figure 8. Variation of ln(T) versus the reciprocal temperature for Th0.85Y0.15O1.925
ceramics sintered in various conditions : 1600°C - 4h (♦), 1600°C - 8h (■), 1700°C - 2h (▲) and 1700°C - 8h (●).
As it was stated previously, the purity of the samples prepared in this study probably precludes any prevailing role of the microstructure over electrical properties. Indeed, the contribution of the grain boundaries was observed for each sample prepared with x = 0.01 and never for the other compositions. The grain size for the samples with x = 0.01 and sintered at 1600°C for 4 hours was only 50% larger than for that prepared at 1700°C for 8 hours with the higher doping rates. As the impurity concentration in the grain boundary should vary linearly with the grain size, the difference in the grain size can not account for the observation of a blocking contribution due to the highest concentration of segregated impurities. Also, if a significant amount of impurities was present in our samples, one should have expected the compound sintered during 8 hours at 1700°C for x = 0.01 to present the highest blocking contribution, which is not the case here.
4.3 STUDY OF CORROSION MECHANISMS BY IMPEDANCE SPECTROSCOPY
Following the model developed by Kleitz et al. [46], already used to discuss the results
obtained on pristine samples, a blocking coefficient noted R was calculated from the
25 the resistivity assigned to blockers (Rblock, mostly due to the contribution of grain boundaries
in this work) with the global resistivity as follows [37, 56]:
=
(2.)
In this model, the blocking area (i.e. the grain boundary) is modeled by a capacity put in parallel with a resistance, representing the blocked ions and their difficulty to diffuse across the grain boundary, respectively.
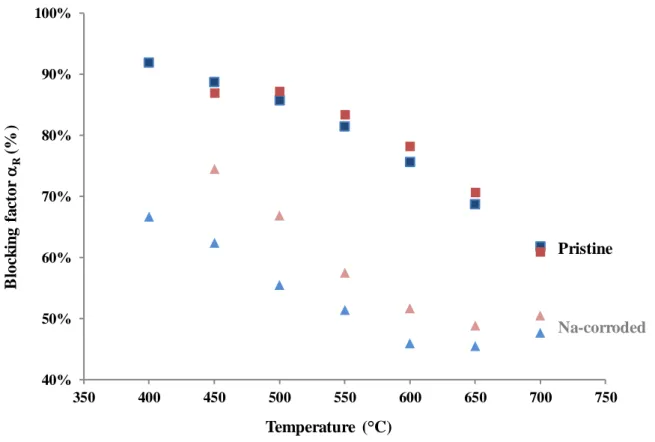
After the Na-corrosion tests performed on Th0.99Y0.01O1.995 ceramic, the blocking
factor was found to decrease by 15 to 40% between 400 and 650°C (Figure 9). This reduction was even more pronounced for the sample contacted with liquid sodium during 200 hours. Based on the SEM observations performed post-immersion, the variation of the blocking factor can not be correlated to macroscopic defects, such as the formation of cracks within the pellets. Moreover, such a phenomenon would have led R to increase. The variations stated
are then likely due to physico-chemical processes operating at the grain boundary. Several hypotheses can be formulated:
i) the first could be linked to the penetration of sodium within the grain boundaries themselves. As sodium is strongly conducting, it could locally enhance the electronic conduction, thereby decreasing the blocking contribution. Nevertheless, if SEM-EDS analyses pointed out the presence of sodium in the first tenths of microns of corroded Th0.99Y0.01O1.995
ceramic, they did not account for Na penetration on the whole thickness of the pellet.
ii) the second could be based on the formation of electronic defects in the material, which would decrease the blocking contribution. Indeed, Gabard already showed that when yttrium-doped ceria or yttrium-yttrium-doped thoria became electronic conductors (through electron formation at low pO2, or hole formation at high pO2, respectively), the blocking contribution could be
strongly decreased [38]. Guo et al. [39] also observed that the grain boundary arc disappeared after a reductive annealing under Ar/H2. Here, the electronic conductivity could be induced by
the reaction of the oxide with Na as following :
2x Na + ThO2 → x Na2ThO3 + (1-x) ThO2 + x VO.. + 2x e- (3.)
A similar reaction was observed when thoria was in contact with Zr [57] :
26 In this case, thoria was found to turn black on a large distance, which is an evidence of the formation of F-centers. Such a color modification was also noticed for alumina in contact with sodium at high temperatures (500°C) [42, 43]. In our conditions, the reaction is obviously kinetically limited and restrained to the grain boundaries. However, the global increase of the conductivity would lead to the decrease of the blocking contributions.
Figure 9. Blocking factors R calculated from the impedance spectroscopy data collected
between 400 and 700°C for x = 0.01. Pristine samples are indicated by squares while leached pellets are marked by triangles. Na-corrosion tests were performed during 100h (red) and
200h (blue).
4.4 FORMATION OF SECONDARY PHASES
To complement the corrosion tests performed on both pure and Si-doped samples and the subsequent SEM observations, theoretical calculations were made to study the potential formation of ternary oxides as secondary phases in the back-end of the corrosion reaction as follows : 40% 50% 60% 70% 80% 90% 100% 350 400 450 500 550 600 650 700 750 B loc k in g fa ctor R (% ) Temperature ( C) Pristine Na-corroded
27
(M = Th, Si) (5.)
For the two oxides considered, the values (expressed in J.mol-1) were calculated at 500°C using the HSC Chemistry 5.1 software. These conditions then correspond to the temperature used during the corrosion tests (Table 7). Although Na2ThO3 data were missing
from the database, they were estimated from the Gibbs free energy of formation reported by Dash et al. [58]. In both cases, the value appeared to be negative, meaning that the formation of the ternary oxide is thermodynamically favored. Also, in case of Si contamination in the samples, Na2SiO3 was expected to form preferentially.
Table 7. Calculated Gibbs free energies assigned to the formation of Na2SiO3 and Na2ThO3 at
500°C and associated dissolved oxygen contents required for the formation of the ternary oxides.
Equation (kJ.mol-1) (µg.g-1) SiO2 + Na2O → Na2SiO3 - 230 3.6 10-13
ThO2 + Na2O → Na2ThO3 - 79 6.1 10-3
The oxygen content dissolved in the liquid sodium that is required for the formation of the ternary oxides was also determined. With this aim, the oxygen activity present when the formation equilibrium of Na2MO3 was reached (see equation 5.) was calculated based on the
expression of Gibbs free energy. As MO2 and Na2MO3 are solid phases, only the activity of
dissolved Na2O differed from 1, leading to :
= 0 (6.)
Using the Henry’s law, and assuming that the activity of Na2O in liquid sodium remains
constant, one can then write :
(7.)
where is the oxygen content in liquid sodium (expressed in µg per g of sodium) and
is the solubility of oxygen in the liquid sodium (µg.g-1). Although several empiric relations were reported in the literature to describe the variation of the oxygen solubility in
28 liquid sodium, that established by Noden between 130 to 550°C appeared to be the most commonly used and was therefore applied in this work [59] :
(8.)
Considering equations (6.), (7.) and (8.), it was then possible to determine the threshold value beyond which Na2MO3 oxides are expected to form :
(9.)
Based on the results reported in Table 7, the formation of both Na2SiO3 and Na2ThO3 should
be observed even for very low amounts of dissolved oxygen (i.e. typically below 1 ppm), which corresponds to highly-purified and nuclear-grade sodium. This result then differed significantly from the value reported by Jayaraman, who argued for a threshold concentration of 1250 ppm at 500°C [16]. Nevertheless, this value corresponded to the oxygen saturation at 500°C and was thus highly doubtful. As the oxygen content is our experiments is close to 80 ppm, the formation of ternary oxides of sodium with Th or Si is then thermodynamically expected.
Also, it is important to note that neither Na2ThO3 nor Na2SiO3 were evidenced from the
SEM observations of our corroded samples. There was then probably a kinetic limitation to their formation, especially in the case of Na2SiO3 which is the most stable in our operating
conditions. Another possibility is that this phase was formed in very limited amounts and only at preferential locations such as grain boundaries and triple junctions. Indeed, these latter are generally considered to enhance nucleation kinetics of secondary phases and are also expected to contain more silicon.
Nevertheless, the amount of ternary oxide must be large enough to lead to a sufficient increase of the conductivity, according to equation (3). The formation of this ternary oxide must generate a kind of porosity at the grain boundary after its dissolution in the sodium, which allows the sodium to penetrate more deeply. The quantity of sodium at the grain boundary must be large, as it is easily detected (but not accurately located) by EDS in SEM observations. This mechanism of formation and dissolution of this ternary phase on preferential sites would explain that no grooving of the grain boundaries is observed at the surface. This mechanism would explain why large amount of Si in the ceramic or oxygen in the sodium would accelerate the grain boundary corrosion, by favoring the ternary phase formation.
29
5. Conclusion
The evolution of the microstructure and of electrical properties of Th1-xYxO2-x/2
electrolyte ceramics prepared through wet chemistry method was assessed throughout corrosion tests in liquid sodium. The characterization of pristine samples by the means of impedance spectroscopy first showed a maximum of conductivity between x = 0.08 and x = 0.15, in very good agreement with the data reported in the literature. If these results appeared to be independent on the sintering conditions chosen, thus on the microstructure of the ceramics, the synthesis method chosen still appeared to impact the samples resistivity. Indeed, only samples with low yttrium contents (i.e. x = 0.01 herein) exhibited blocking phenomena, which were interpreted thanks to the blocking model rather than through impurities within the grain boundaries or the space charge model. This observation then backed up the use of wet chemistry methods, including oxalate precipitation, for the elaboration of highly pure Th 1-xYxO2-x/2 electrolyte ceramics.
The chemical durability of the ceramics was then studied in static liquid sodium at 500°C for several hundreds of hours, with an oxygen content of about 70-80 ppm. Such operating conditions are far more severe than that expected in SFR-type reactors, but were chosen on purpose to exacerbate the corrosion phenomena and make them compatible with the laboratory time-scale. In spite of these penalizing conditions, all the results showed that the pellets kept their mechanical integrity, while the penetration of sodium was evidenced in the bulk through the observation of inter-granular cleavage surfaces. This feature suggested direct interaction of grain boundaries with sodium, even if the mechanism involved remained difficult to describe accurately. The preferential corrosion of grain boundaries was also evidenced through impedance spectroscopy measurements performed post-immersion, which systematically revealed a drastic decrease of the blocking phenomena contribution. The preferred mechanism would rely on the formation and the dissolution of a ternary oxide phase at the grain boundaries, allowing the penetration of sodium and the increase of the overall conductivity of the sample. Moreover, this process would be fastened in presence of impurities, such as silicon, which favor the formation of ternary oxides. This underlines the need for ultra-pure material, which are more likely obtained through wet-chemistry methods rather than powder metallurgy, were the existence of grinding steps could generate the incorporation of impurities.
Taking advantage of the method developed in this work, complementary tests have to be conducted. Particularly, the influence of the oxygen content has to be investigated to conclude on the kinetics of penetration of sodium through grain boundaries. A better
30 understanding of the corrosion mechanisms could help in finding countermeasures to limit the penetration depth. Finally, advanced tests in dynamic systems (loop or oxygen control device) will allow to evaluate the long-term behavior of such ceramics in the presence of liquid sodium.
Acknowledgments. The authors would like to thank Vincent Beau, Gautier Verduyn and
Smaïl El Hannaoui for their help during corrosion experiments and SI measurements. They are also grateful to CEA for its continuous financial support.
Data availability. The raw data required to reproduce these findings will be made available on request. The processed data required to reproduce these findings will be made available on request.
References
[1] J.E. Kelly, Generation IV International Forum: A decade of progress through international cooperation, Prog Nucl Energ, 77 (2014) 240-246.
[2] D. Dall'Ava, L. Martin, B. Vray, 35 Years of Operating Experience of PHENIX NPP Sodium Cooled Fast Reactor, Icone 17: Proceedings of the 17th International Conference on Nuclear Engineering, Vol 1, (2009) 243-254.
[3] L. Brissonneau, New considerations on the kinetics of mass transfer in sodium fast reactors: An attempt to consider irradiation effects and low temperature corrosion, J Nucl Mater, 423 (2012) 67-78.
[4] D.J. Hayes, Instrumentation for Liquid-Sodium in Nuclear-Reactors, Journal of Physics E-Scientific Instruments, 7 (1974) 69-75.
[5] H. Steinmetz, Development of a continuous meter for oxygen in sodium, in: Quarterly Progress Report, United Nuclear Corp., United States, 1961.
[6] I.C. Cosentino, R. Muccillo, Lattice parameters of thoria-yttria solid solutions, Mater Lett, 48 (2001) 253-257.
[7] J.E. Bauerle, Electrical Conduction in Thoria and Thoria-Yttria as a Function of Oxygen Pressure, J Chem Phys, 45 (1966) 4162-4166.
[8] E.C. Subbarao, H.S. Maiti, Solid Electrolytes with Oxygen Ion Conduction, Solid State Ionics, 11 (1984) 317-338.
[9] M.F. Lasker, R.A. Rapp, Mixed Conduction in ThO2 and ThO2-Y2O3 Solutions, Z
Phys Chem Neue Fol, 49 (1966) 198-&.
[10] B.C.H. Steele, C.B. Alcock, Factors Influencing Performance of Solid Oxide Electrolytes in High-Temperature Thermodynamic Measurements, T Metall Soc Aime, 233 (1965) 1359-&.
31 [11] S.J. Skinner, J.A. Kilner, Oxygen ion conductors, Mater. Today, 6 (2003) 30-37. [12] M. Gabard, Y. Cherkaski, N. Clavier, L. Brissonneau, M.C. Steil, J. Fouletier, A.
Mesbah, N. Dacheux, Preparation, characterization and sintering of yttrium-doped ThO2 for oxygen sensors applications, J Alloy Compd, 689 (2016) 374-382.
[13] A. Hammou, Electrical-Conductivity in ThO2-YO1.5 System .1. Experimental Study
and Electronic Conductivity, J Chim Phys Pcb, 72 (1975) 431-438.
[14] E. Schouler, A. Hammou, M. Kleitz, Complex Impedance of Electrochemical Cells Based on Yttria Doped Thoria, Mater Res Bull, 11 (1976) 1137-1146.
[15] I. Bransky, N.M. Tallan, Electrical Properties and Defect Structure of ThO2, J Am
Ceram Soc, 53 (1970) 625-629.
[16] V. Jayaraman, T. Gnanasekaran, Evolution of the Development of In-Sodium Oxygen Sensor and Its Present Status, J Electrochem Soc, 163 (2016) B395-B402.
[17] B.K. Nollet, M.G. Hvasta, M.H. Anderson, D. Morgan, J.A. Schneider, Development of an Electrochemical Oxygen Sensor for Liquid Sodium Using a Yttria Stabilized Zirconia Electrolyte, J Electrochem Soc, 164 (2017) B10-B22.
[18] R. Ganesan, V. Jayaraman, S.R. Babu, R. Sridharan, T. Gnanasekaran, Development of Sensors for On-Line Monitoring of Nonmetallic Impurities in Liquid Sodium, J Nucl Sci Technol, 48 (2011) 483-489.
[19] H. Nafe, Ionic-Conductivity of Th0.85Y0.15O1.925 below 500°C, Z Phys Chem, 172
(1991) 69-79.
[20] F.J. Salzano, H.S. Isaacs, Minushki.B, Potential Measurements on a Si,SiO2 Electrode
Using a ThO2-Y2O3 Electrolyte, J Electrochem Soc, 118 (1971) 412-416.
[21] W.A. Ross, E.T. Weber, Fabrication and Characterization of ThO2-Y2O3 Solid
Electrolyte Tubes, Am Ceram Soc Bull, 50 (1971) 787-&.
[22] H.U. Borgstedt, Influence of Liquid Sodium on Mechanical Properties of Steels, Refractory Alloys and Ceramics, in: V. Ghetta, D. Gorse, D. Mazière, V. Pontikis (Eds.) Materials issues for Generation IV systems : status, open questions and challenges, Springer, 2008, pp. 461-480.
[23] M.R. Hobdell, C.A. Smith, Electrochemical Techniques for Monitoring Dissolved Carbon, Hydrogen and Oxygen in Liquid-Sodium, J Nucl Mater, 110 (1982) 125-139. [24] R.G. Taylor, R. Thompson, Testing and Performance of Electrolytic Oxygen Meters
for Use in Liquid-Sodium, J Nucl Mater, 115 (1983) 25-38.
[25] D. Jakes, J. Kral, J. Burda, M. Fresl, Development of Electrochemical Oxygen Meter for Liquid-Sodium, Solid State Ionics, 13 (1984) 165-173.
[26] E. Berkey, J.G. Cleary, Developments Pertaining to Electrochemical Oxygen Meters, Trans Am Nucl Soc, 12 (1969) 125-&.
[27] C.C.H. Wheatley, F. Leach, B. Hudson, R. Thompson, Claxton, K.J., Asher, R.C., The manufacture and properties of ceramic probes to measure oxygen content in liquid sodium, Inst. Phys. Conf. Ser., 30 (1977) 556-560.
[28] Y. Cherkaski, N. Clavier, L. Brissonneau, R. Podor, N. Dacheux, Densification behavior and microstructure evolution of yttrium-doped ThO2 ceramics, J Eur Ceram
Soc, 37 (2017) 3381-3391.
[29] D. Horlait, N. Clavier, N. Dacheux, R. Cavalier, R. Podor, Synthesis and characterization of Th1-xLnxO2-x/2 mixed-oxides, Mater Res Bull, 47 (2012) 4017-4025.
[30] L. Claparede, N. Clavier, N. Dacheux, A. Mesbah, J. Martinez, S. Szenknect, P. Moisy, Multiparametric Dissolution of Thorium-Cerium Dioxide Solid Solutions, Inorg Chem, 50 (2011) 11702-11714.
32 [31] C. Latgé, J. Guidez, Sodium chemistry, in: L. moniteur (Ed.) Sodium-cooled nuclear
reactors, 2016, pp. 111-117.
[32] K. Chandran, R. Nithya, K. Sankaran, A. Gopalan, V. Ganesan, Synthesis and characterization of sodium alkoxides, B Mater Sci, 29 (2006) 173-179.
[33] R. Caponetti, Sodium Cleaning Procedures for Pec Prototype Mechanisms, Nucl Technol, 70 (1985) 408-423.
[34] K. Kiukkola, C. Wagner, Galvanic Cells for the Determination of the Standard Molar Free Energy of Formation of Metal Halides, Oxides, and Sulfides at Elevated Temperatures, J Electrochem Soc, 104 (1957) 308-316.
[35] C.M. Choudhary, H.S. Maiti, E.C. Subbarao, Defect structure and transport properties, in: E.C. Subbarao (Ed.) Solid electrolytes and their application, Springer US, 1980, pp. 1-80.
[36] J.A. Kilner, Fast oxygen transport in acceptor doped oxides, Solid State Ionics, 129 (2000) 13-23.
[37] M.C. Steil, F. Thevenot, M. Kleitz, Densification of yttria-stabilized zirconia - Impedance spectroscopy analysis, J Electrochem Soc, 144 (1997) 390-398.
[38] M. Gabard, Elaboration et caractérisation d'électrolytes solides pour sondes électrochimiques à oxygène dans le sodium liquide, in, Université de Grenoble, 2013. [39] X. Guo, W. Sigle, J. Maier, Blocking grain boundaries in yttria-doped and undoped
ceria ceramics of high purity, J Am Ceram Soc, 86 (2003) 77-87.
[40] R. Podor, X. Le Goff, T. Cordara, M. Odorico, J. Favrichon, L. Claparede, S. Szenknect, N. Dacheux, 3D-SEM height maps series to monitor materials corrosion and dissolution, Mater Charact, 150 (2019) 220-228.
[41] B. Joseph, Fragilisation du cuivre par le bismuth liquide : étude cinétique et mécanisme, in, Université Paris-Sud-11, 1998.
[42] S. Kano, E. Yoshida, Y. Hirakawa, Y. Tachi, H. Haneda, T. Mitsuhashi, Sodium Compatibility of Ceramics, Liquid Metal Systems, (1995) 85-94.
[43] J. Jung, A. Reck, R. Ziegler, The Compatibility of Alumina Ceramics with Liquid-Sodium, J Nucl Mater, 119 (1983) 339-350.
[44] X. Guo, R. Waser, Electrical properties of the grain boundaries of oxygen ion conductors: Acceptor-doped zirconia and ceria, Prog Mater Sci, 51 (2006) 151-210. [45] M. Aoki, Y.M. Chiang, I. Kosacki, I.J.R. Lee, H. Tuller, Y.P. Liu, Solute segregation
and grain-boundary impedance in high-purity stabilized zirconia, J Am Ceram Soc, 79 (1996) 1169-1180.
[46] M. Kleitz, L. Dessemond, M.C. Steil, Model for Ion-Blocking at Internal Interfaces in Zirconias, Solid State Ionics, 75 (1995) 107-115.
[47] C.Y. Tian, S.W. Chan, Ionic conductivities, sintering temperatures and microstructures of bulk ceramic CeO2 doped with Y2O3, Solid State Ionics, 134 (2000) 89-102.
[48] E.J.L. Schouler, N. Mesbahi, G. Vitter, Insitu Study of the Sintering Process of Yttria Stabilized Zirconia by Impedance Spectroscopy, Solid State Ionics, 9-10 (1983) 989-996.
[49] M.J. Verkerk, A.J.A. Winnubst, A.J. Burggraaf, Effect of Impurities on Sintering and Conductivity of Yttria-Stabilized Zirconia, J Mater Sci, 17 (1982) 3113-3122.
[50] I.C. Cosentino, R. Muccillo, Properties of thoria-yttria solid electrolytes prepared by the citrate technique, Mater Lett, 32 (1997) 295-300.
[51] M. Hartmanova, V. Saly, F. Hanic, M. Pisarcik, H. Ullmann, Microstructure and Physical-Properties of Transparent Thoria Yttria Ceramics, J Mater Sci, 26 (1991) 4313-4317.
33 [52] M. Hartmanova, F. Hanic, A. Koller, J. Janci, Some Physical-Properties of Calcia and
Yttria Stabilized ThO2 Ceramics, Czech J Phys, 28 (1978) 414-433.
[53] H. Inaba, H. Tagawa, Ceria-based solid electrolytes - Review, Solid State Ionics, 83 (1996) 1-16.
[54] E.N.S. Muccillo, M. Kleitz, Ionic-Conductivity of Fully Stabilized ZrO2-MgO and
Blocking Effects, J Eur Ceram Soc, 15 (1995) 51-55.
[55] S.P.S. Badwal, J. Drennan, Yttria Zirconia - Effect of Microstructure on Conductivity, J Mater Sci, 22 (1987) 3231-3239.
[56] L. Dessemond, R. Muccillo, M. Henault, M. Kleitz, Electric Conduction-Blocking Effects of Voids and 2nd Phases in Stabilized Zirconia, Appl Phys a-Mater, 57 (1993) 57-60.
[57] L. Brissonneau, P. Trabuc, C. Chabert, T. Matonne, H. Sassoulas, F. Bianchi, Joining steel to yttria-doped hafnia with a reactive brazing for a potentiometric oxygen sensor in sodium, in: ECerS 2017, Budapest, 2017.
[58] S. Dash, Z. Singh, S.C. Parida, V. Venugopal, Thermodynamic studies on Rb2ThO3(s),
J Alloy Compd, 398 (2005) 219-227.
[59] D. Noden, A general equation for the solubility of oxygen in liquid sodium, J Brit Nucl Ener Soc, 12 (1973) 57-62.
![Table 1. Characteristics of Th 1-x Y x O 2-x/2 sintered pellets used in this study [28]](https://thumb-eu.123doks.com/thumbv2/123doknet/13596253.423446/7.892.128.815.796.1072/table-characteristics-th-y-sintered-pellets-used-study.webp)
![Table 2. Comparison of the Th 1-x Y x O 2-x/2 electrolyte ceramics bulk conductivities determined in this work (expressed in S.m -1 ) with selected values reported in the literature [9, 14, 38]](https://thumb-eu.123doks.com/thumbv2/123doknet/13596253.423446/11.892.99.837.252.508/comparison-electrolyte-ceramics-conductivities-determined-expressed-selected-literature.webp)