HAL Id: hal-01277940
https://hal.archives-ouvertes.fr/hal-01277940
Submitted on 23 Feb 2016
HAL is a multi-disciplinary open access
archive for the deposit and dissemination of
sci-entific research documents, whether they are
pub-lished or not. The documents may come from
teaching and research institutions in France or
abroad, or from public or private research centers.
L’archive ouverte pluridisciplinaire HAL, est
destinée au dépôt et à la diffusion de documents
scientifiques de niveau recherche, publiés ou non,
émanant des établissements d’enseignement et de
recherche français ou étrangers, des laboratoires
publics ou privés.
Performance comparison between Java and JNI for
optimal implementation of computational micro-kernels
Nassim Halli, Henri-Pierre Charles, Jean-François Méhaut
To cite this version:
Nassim Halli, Henri-Pierre Charles, Jean-François Méhaut. Performance comparison between Java and
JNI for optimal implementation of computational micro-kernels. ADAPT 2015 : The 5th International
Workshop on Adaptive Self-tuning Computing Systems, Jan 2015, Amsterdam, Netherlands.
�hal-01277940�
Performance comparison between Java and JNI for optimal
implementation of computational micro-kernels
Nassim Halli
Univ. Grenoble, France Aselta Nanographics, France[email protected]
Henri-Pierre Charles
CEA-LIST, FranceJean-François Mehaut
Univ. GrenobleABSTRACT
General purpose CPUs used in high performance computing (HPC) support a vector instruction set and an out-of-order engine dedicated to increase the instruction level parallelism. Hence, related optimizations are currently critical to im-prove the performance of applications requiring numerical computation. Moreover, the use of a Java run-time environ-ment such as the HotSpot Java Virtual Machine (JVM) in high performance computing is a promising alternative. It benefits from its programming flexibility, productivity and the performance is ensured by the Just-In-Time (JIT) com-piler. Though, the JIT compiler suffers from two main draw-backs. First, the JIT is a black box for developers. We have no control over the generated code nor any feedback from its optimization phases like vectorization. Secondly, the time constraint narrows down the degree of optimiza-tion compared to static compilers like GCC or LLVM. So, it is compelling to use statically compiled code since it bene-fits from additional optimization reducing performance bot-tlenecks. Java enables to call native code from dynamic libraries through the Java Native Interface (JNI). Neverthe-less, JNI methods are not inlined and require an additional cost to be invoked compared to Java ones. Therefore, to benefit from better static optimization, this call overhead must be leveraged by the amount of computation performed at each JNI invocation. In this paper we tackle this problem and we propose to do this analysis for a set of micro-kernels. Our goal is to select the most efficient implementation con-sidering the amount of computation defined by the calling context. We also investigate the impact on performance of several different optimization schemes which are vector-ization, out-of-order optimvector-ization, data alignment, method inlining and the use of native memory for JNI methods.
Categories and Subject Descriptors
D.3.4 [Programming Languages]: Processors—Optimiza-tion, Run-time environments; D.2.8 [Software Engineer-ing]: Metrics—Complexity measures, Performance measures
Keywords
Java, JNI, HPC, Performance, Vectorization
1.
INTRODUCTION AND MOTIVATION
The initial motivation for this study is to improve the perfor-mance of a Java application which intensively uses a small set of computational micro-kernels. Java has become an important general-purpose programming language and in-dustry expresses great interest in using it for scientific and engineering computation [6, 11]. High performance scientific Java, however, suffers from the lack of optimized libraries and low-level control [6]. This is in part due to the machine-independent bytecode representation of Java which prevents from target specific optimization at the source code level. In a dynamically compiled environment, the optimizations are delegated to the JIT compiler which is in charge of translat-ing bytecode into machine code at run-time, ustranslat-ing dynamic information. JIT optimization like vectorization are essen-tials for performance and still remain a major concern [2, 3, 8]. They enable programmers to maintain a machine-independent code and save them from writing several ver-sions for different target architectures. That is why in Java applications pure Java methods are often preferred to native ones.
Though, the JIT compiler suffers from two main drawbacks. First, the JIT is a black box for developers. We have no control over the generated code nor any feedback from its optimization phases like vectorization. Secondly, the time constraint narrows down the degree of optimization [7, 2] compared to static compiler like GCC or LLVM. As a re-sult, it can be interesting to use statically compiled code to benefit from a deeper optimization for performance bottle-necks that usually represent a small part of the application. Java applications enable to call native code from dynamic libraries through the Java Native Interface (JNI). Neverthe-less, JNI methods are not inlined and require an additional cost to be invoked compared to Java ones. Thus, to benefit from better static optimization, this call overhead must be leveraged by the amount of computation performed at each JNI invocation. This is what we call the flop-per-invocation Considering these aspects (summarized in Table 1) select-ing the most efficient implementation between JNI and Java requires an advanced analysis that takes into account the flop-per-invocation. In this paper we tackle this problem and we propose to do this analysis for a set of micro-kernels in order to select the most efficient implementation for a given range of flop-per-invocation. We also investigate how the flop-per-invocation impacts the performance of several
different optimization schemes which are vectorization, out-of-order optimization, data alignment, method inlining and the use of native memory for JNI methods.
The study is performed using the Java HotSpot Virtual Ma-chine over a Sandy Bridge x86-64 architecture which sup-ports the AVX (Advanced Vector Extensions) instruction set for vectorization. Furthermore, we use GCC for static compilation of the micro-kernels. Section 2 provides a back-ground about performance analysis and Section 3 provides a background about the optimization considered for this study. Section 4 presents our benchmark methodology and experimental conditions. In Section 5 we expose and discuss the obtained results.
Table 1: Performance drawbacks and benefits
overview
Drawbacks Benefits
JIT Lower level of
optimization No call overhead JNI Higher call
over-head
Higher level of optimization
2.
PERFORMANCE METRICS
2.1
Arithmetic intensity
We call flper-invocation the number of floating point op-erations (flop) performed by the kernel at each invocation. The performance of a kernel implementation is measured in flop/s (i.e. the number of floating point operations per-formed per second). We have the following equation:
F = AI × M (1)
Where F is the flop-per-invocation, M is the memory-per-invocation in byte corresponding to the amount of input and output memory processed by the kernel. AI is the arith-metic intensity in flop/byte which is the ratio of the flop-per-invocation by the memory-flop-per-invocation.
The arithmetic intensity allows to locate micro-kernel bot-tlenecks [12]. If the bottleneck is the memory bandwidth then the kernel is called memory-bound. Otherwise the bot-tleneck is the CPU throughput and the kernel is called CPU-bound. Indeed, we can write the following inequality:
Π > AI × β (2)
Where Π is the CPU peak performance in flop/s and β is the peak memory bandwidth in byte/s. If Equation 2 is satisfied then the kernel is memory-bound (otherwise CPU-bound). Since modern architectures use a multi-level cache hierarchy, the memory bandwidth depends on the data lo-cation over this hierarchy. This means that the memory bandwidth depends on the memory-per-invocation which impacts cache efficiency therefore increasing the memory-per-invocation leads to reducing the memory bandwidth.
2.2
Performance profile
We define the performance profile of a kernel implemen-tation as the performance function of either the flop-per-invocation, or the memory-per-invocation (since there are linearly related). By plotting the performance profile of a kernel implementation for a wide range of memory-per-invocation, we can observe, for example, the memory band-width bottleneck.
2.3
Theorical impact of the invocation cost
A simple model to describe the invocation cost impact on performance when the flop-per-invocation decreases is given by the following equation:
P = PmaxF
I + F (3)
Where P is the performance, F is the flop-per-invocation, Pmax is the peak performance reached by the kernel and I
is a parameter which describes the invocation cost in flop. We define the decrease-factor DF as followed:
DF = P
Pmax
= F
I + F (4)
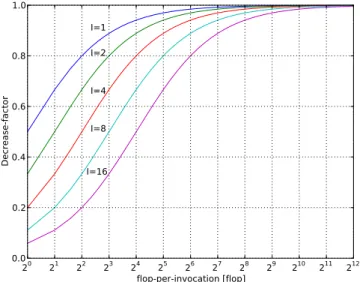
Figure 1 shows the decrease-factor as a function of the flop-per-invocation for different values of I. We can see that for relatively small flop-per-invocation, the invocation cost has a large impact on performance. Accordingly, we must consider both the flop-at-invocation and the JNI invocation cost to select the most efficient implementation.
20 21 22 23 24 25 26 27 28 29 210 211 212 flop-per-invocation [flop] 0.0 0.2 0.4 0.6 0.8 1.0 Decrease-factor I=1 I=2 I=4 I=8 I=16
Figure 1: Theoretic performance profile : decrease-factor function of the flop-per-invocation for differ-ent value of the invocation cost I
3.
CODE OPTIMIZATION
We consider two kinds of optimization, The first ones are asymptotic optimizations that are significant when the flop-per-invocation grows. In the second kind we have the opti-mizations that reduce the invocation cost of a method and which are significant for lower flop-per-invocation. They are described respectively in Section 3.1 and 3.2.
3.1
Asymptotic optimization
3.1.1
Vectorization and out-of-order optimization
Since microprocessor performance is limited by a maximum clock frequency the trend goes towards increasing processor throughput by handling multiple data in parallel. The prin-ciple of vectorization is to pack data into a vector register then perform one operation over all the data. In this study we consider the AVX instruction set available in the 64-bit Intel Sandy Bridge architecture. AVX enables to use 256
bits registers called YMM. It allows to perform four dou-ble precision operations at one time. Additionally to vector units, the out-of-order (o-o-o) execution can increase the level of parallelism by dispatching independent instructions over parallel execution units available in different ports. For example the Sandy Bridge has six execution ports. Ports 0, 1 and 5 are for arithmetic and logic operations and support 256 bit vector operation. Ports 2 and 3 are two identical memory-load ports while port 4 is for memory-store. In-creasing the level of parallelism with o-o-o is done by break-ing long dependency chains. Hence, the o-o-o engine can evenly distribute independent operations between the dif-ferent execution ports. Mixing o-o-o and vectorization leads to an optimal instruction level parallelism. Table 3 shows an example of source code optimization using vectorization and o-o-o for a horizontal sum kernel.
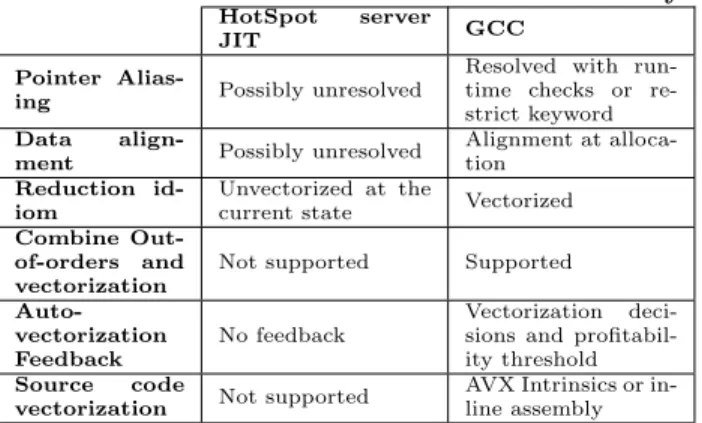
The HotSpot Virtual Machine run-time uses two compil-ers, the client compiler and the server compiler. The server version [8], which is the focus in this study, is a highly optimizing bytecode compiler which targets long running applications and aims to improve asymptotic performance. The server compiler supports auto-vectorization, it inter-nally uses Super-word Level Parallelism (SLP) [5]. SLP de-tects groups of isomorphic instructions in basic blocks. This results in a lightweight vectorization approach suitable for Just-In-Time compilation. However, this approach cannot optimize across loop iterations and cannot vectorize loop-carried idioms like reduction. As a result, the JIT can not mix o-o-o and vectorization. Additionally the JIT compiler can be seen as a black box. Due to its portability specifi-cation Java does not provide machine-specific intrinsics like AVX intrinsics and of course, we can not inline assembly code directly in the Java source code. Additional meta-information, for example to ensure the compiler that pointer won’t alias, cannot be passed to the JIT compiler. Finally, the JIT does not provide any feedback about its vectoriza-tion decisions which are invisible to programmers. Thus, to ensure that the code has been properly vectorized the gener-ated code must be examined. Table 2 summarizes the Java vectorization drawbacks.
Table 2: Java vectorization drawbacks summary
HotSpot server
JIT GCC
Pointer
Alias-ing Possibly unresolved
Resolved with run-time checks or re-strict keyword Data
align-ment Possibly unresolved
Alignment at alloca-tion
Reduction id-iom
Unvectorized at the
current state Vectorized Combine
Out-of-orders and vectorization
Not supported Supported
Auto-vectorization Feedback
No feedback
Vectorization deci-sions and profitabil-ity threshold Source code
vectorization Not supported
AVX Intrinsics or in-line assembly
3.1.2
Data alignment
The proper alignment of packed data is required to observe vectorization benefit. In the considered case of a Sandy Bridge architecture, packets are 32-byte wide (which cor-responds to 4 packed double). To ensure a benefit, packets
Table 3: Core vectorization and out-of-order opti-mizations for a horizontal sum reduction kernel in double precision
No vectorization Vectorization (AVX intrinsics)
N o o-o-o f o r ( i =0; i <n;++ i ) { sum+=a [ i ] ; } f o r ( i =0; i <n ; i +=4){ p=m m 2 5 6 l o a d u p d (&( a [ i ] ) ) ; sum=mm256 add pd ( sum , p ) ; } o-o-o f o r ( i =0; i <n ; i +=4){ sum0+=a [ i ] ; sum1+=a [ i + 1 ] ; sum2+=a [ i + 2 ] ; sum3+=a [ i + 3 ] ; } f o r ( i =0; i <n ; i +=16){ p0=m m 2 5 6 l o a d u p d (&( a [ i ] ) ) ; p1=m m 2 5 6 l o a d u p d (&( a [ i + 4 ] ) ) ; p2=m m 2 5 6 l o a d u p d (&( a [ i + 8 ] ) ) ; p3=m m 2 5 6 l o a d u p d (&( a [ i + 1 2 ] ) ) ; sum0=mm256 add pd ( sum0 , p0 ) ; sum1=mm256 add pd ( sum1 , p1 ) ; sum2=mm256 add pd ( sum2 , p2 ) ; sum3=mm256 add pd ( sum3 , p3 ) ; }
must be aligned on 16 bytes which is the higher granular-ity for load and store instructions. With GCC we can use aligned AVX instructions if data packets are 32-byte aligned and pointers can be properly aligned using the posix memalign system call. In Java we cannot explicitly align primitive ar-rays and the JIT is in charge of aligning memory access. To do so, compilers perform loop peeling i.e. they begin to load or store packed data at the first aligned offset. However in some cases when one loop iterates over several arrays which are offset relative to each other, peeling cannot resolve align-ment for all the arrays. This causes a serious performance penalty which remains unpredictable. As we want to con-trol the alignment of a Java object and its memory layout, we can set statically a base offset to ensure aligned memory access. Figure 2 shows an example of a Java double array explicitly aligned on 32-byte by setting a base offset at 2 instead of 0.
Object header Padding 0 1 2
32 bytes aligned object First 32 bytes aligned double-word
12 bytes 4 bytes 8 bytes
4-double packet are 32 bytes aligned
2 3 4 5
Packet 0 Packet 1 0 1
Figure 2: Java double array 32-byte aligned. The first 32-byte aligned packet begins at the offset 2
3.2
Optimizations that reduce the invocation
cost
3.2.1
Java method inlining
Inlining is a core optimization especially in dynamically com-piled environment. It allows to achieve significant optimiza-tion by specializing a method considering its calling context. Inlining also eliminates the invocation cost. In this study, we only consider inlining as an optimization that eliminates the invocation cost. To do so we consider kernels which show a constant complexity through inlining. Thereby the com-parison between JNI and Java is also consistent because the experiment is independent of the calling context.
3.2.2
JNI and native memory
JNI is a specification which allows applications to call stat-ically compiled methods from dynamic libraries and to ma-nipulate Java objects from there. JNI suffers from an ad-ditional invocation cost [1, 4, 10]. Invoking a native target function requires two calls. The first is from the Java appli-cation to the JNI wrapper which sets up the native function parameters. The second is from the JNI wrapper to the native target function. But the most significant source of overhead occurs during the invocation of JNI callbacks. An example is to get an array pointer from the Java heap. A callback pays a performance penalty because two levels of indirection are used: one to obtain the appropriate function pointer inside a function table and one to invoke the func-tion. Yet, these callbacks remains necessary to work with Java objects while avoiding memory copies that are even more expensive. In addition to the Java heap, where objects are allocated and automatically removed by the garbage col-lector, Java allows programmers to allocate chunks of mem-ory out of the Java heap. This kind of memmem-ory is called native memory. We explore the use of native memory as an optimization technique in order to avoid JNI callbacks and so reduce its invocation cost.
4.
BENCHMARK METHODOLOGY
For each kernel we provide several implementations that use the optimization techniques detailed in Section 3. For each implementation, we measure and plot its performance profile (defined in Section 2.2). We aim to select the best imple-mentation for a given range of flop-per-invocation and also to analyze the impact of a given optimization.
4.1
Experimental Conditions
Performance results are measured on an Intel(R) Sandy Bridge Core(TM) i5-2500 3.30GHz CPU. The Linux system version is 2.6.3 and we use the OpenJDK Runtime Environment 1.8.0, 64-Bit Server VM (build 25.0-b70, mixed mode). For JNI implementation we use GCC 4.4.7. The CPU has three levels of cache, for each we give its size and approximate latency:
• The L1 data cache is 32kB, its approximate latency is around 4 cycles.
• The L2 cache is 256kB, its approximate latency is around 12 cycles
• The L3 cache is 6MB, its approximate latency is around 30 cycles
The theoretical performance peak is 41.6 Gflop/s and we measure the approximate memory bandwidth peak around 40 GB/s. According to Equation 2 in Section 2 a kernel is memory-bound (resp. CPU-bound) if its arithmetic inten-sity is lower (resp. greater) than 1 flop/byte.
4.2
Kernels sample and notations
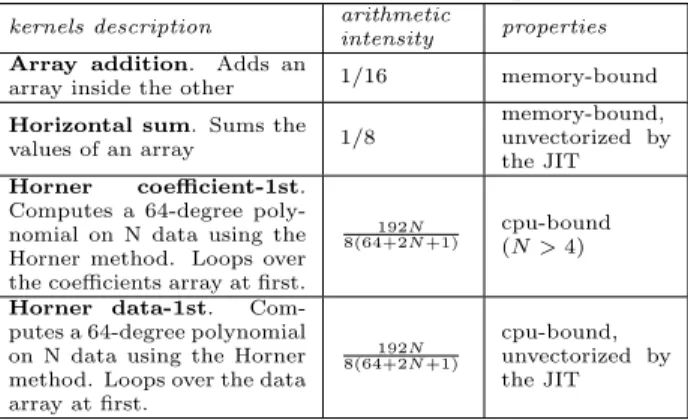
We select basic micro-kernels, described in Table 5, for our experimentation. Tested kernels computes in double preci-sion. Vectorization is always profitable since data are al-ready packed into memory.
For each kernel we provide several implementation. An im-plementation is described by the following label:
T ype InvocationOpt AsymptoticOpts
Where T ype is the type of the implementation, InvocationOpt is the optimization that reduces the invocation cost and AsymptoticOpts are the asymptotic optimizations. Table 4 details the values taken by each attributes.
Table 4: Implementation label description
T ype InvocationOpt AsymptoticOpts
• java: pure Java meth-ods + JIT • jni: JNI methods + GCC
• inline: inlining for Java methods
• native: native memory for JNI methods
• empty if no opti-mization
• vect: vectorization with aligned data
• vect unalign: vec-torization with un-aligned data
• ooo: out-of-order optimization
• empty if no opti-mization
Table 5: Micro-kernels Sample
kernels description arithmetic
intensity properties Array addition. Adds an
array inside the other 1/16 memory-bound
Horizontal sum. Sums the
values of an array 1/8
memory-bound, unvectorized by the JIT Horner coefficient-1st.
Computes a 64-degree poly-nomial on N data using the Horner method. Loops over the coefficients array at first.
192N 8(64+2N +1)
cpu-bound (N > 4)
Horner data-1st. Com-putes a 64-degree polynomial on N data using the Horner method. Loops over the data array at first. 192N 8(64+2N +1) cpu-bound, unvectorized by the JIT
4.3
Measurements
Measurements are performed using timers inside a caller method. The caller executes the method we want to bench-mark with a given number of iterations then returns the mean time spent executing the method. We also iterate over the caller to get the best mean time and then calculate the performance in flop/s performed by the method. Measure-ments are taken in a steady state considering the warm-up phase to compile the hotpots, but also the memory state. Since the caller invokes the method over the same data set, the memory bandwidth reaches its maximum for the given memory complexity. The caller arithmetic intensity is al-most equal to the arithmetic intensity of the method mul-tiplied by the method invocation count performed by the caller. Theoretically, by inlining at source code, we could increase the memory bandwidth and peak performance by swapping the loop iterating over the data with that iter-ating over the method computation. However, by default compilers do not perform this kind of optimization which can disturb numerical precision by switching floating point operations.
For each kernel we provide the performance profile for sev-eral different implementations (Figures 3, 4, 5 and 6). Per-formance profiles are plotted as a function of the memory-per-invocation. Thereby we can analyze the result by ac-counting for the cache hierarchy.
28 210 212 214 216 218 220 222 224 memory-per-invocation [byte] 0 1 2 3 4 5 6 7 Performance [Gflop/s]
L1
L2
L3
java_inline_vect
java_vect
jni_native_vect
jni_vect
java_inline
Figure 3: Array addition performance profile
26 28 210 212 214 216 218 220 222 224 memory-per-invocation [byte] 0 2 4 6 8 10 12 14 Performance [Gflop/s]
L1
L2
L3
java_inline
java_inline_ooo
java_ooo
jni_vect_ooo
jni_native_vect_ooo
Figure 4: Horizontal sum performance profile
5.1
Most efficient implementation
The performance profile allows to locate the most efficient implementation for a given range of memory-per-invocation. This range is supposed to be known for a particular calling context.
The most efficient implementation of the Array addition ker-nel is the vectorized and inlined Java version (java inline vect ) for the whole range of memory-per-invocation considered. This is an example where the JIT works as well as GCC, hence there is no benefits from using JNI in such a case. Concerning the Horizontal sum kernel, the best implementa-tion depends on the considered range of memory-per-invocaimplementa-tion. Since native memory breaks the Java language, we don’t consider JNI with native memory as eligible. Thus, until 2kB the best implementation is the inlined Java version with
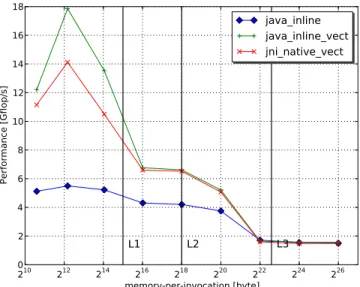
210 212 214 216 218 220 222 224 226 memory-per-invocation [byte] 0 2 4 6 8 10 12 14 16 18 Performance [Gflop/s]
L1
L2
L3
java_inline
java_inline_vect
jni_native_vect
Figure 5: Horner coefficient-1st performance profile
210 212 214 216 218 220 222 224 226 memory-per-invocation [byte] 0 5 10 15 20 25 30 35 40 45 Performance [Gflop/s]
L1
L2
L3
cpu peak
java_inline
java_inline_ooo
jni_vect
jni_vect_ooo
Figure 6: Horner data-1st performance profile
an out-of-order optimization (java inline ooo). From 2kB the most efficient implementation is the vectorized and out-of-order optimized JNI version (jni vect ooo). This kernel is an example where using static compilation leads to benefits but only when the amount of computation is sufficient to cover the invocation cost. The performance profile allows to quantify this threshold.
For the Horner kernel we provide two different algorithms. The coefficient-1st iterates over the polynomial coefficients at first then over the input values. The data-1st iterates over the data-values at first then over the coefficient values. The most efficient implementation considering both algorithm is provided by the JNI version which is vectorized and out-of-order optimized (jni vect ooo). This is true for the whole range of memory-per-invocation considered.
5.2
Vectorization
The efficiency of vectorization is related to the memory band-width. To observe a substantial speed-up, the bottleneck
must be computational. For memory-bound kernels, we ob-serve a performance decrease along with the memory-per-invocation that reduces the memory bandwidth.
Considering the Array addition kernel for a range of memory-per-invocation between L2 size and L3 size, all vectorized implementations are almost equal with a benefit of at least 30%. For memory-per-invocation greater than L3 size there is no longer a vectorization benefit since the memory band-width is the major bottleneck. Vectorization is really signif-icant if the memory-per-invocation is lower than the L1 size and optimal for a memory-per-invocation of 16kB.
Java implementations of the Horizontal sum kernel are not vectorized since the JIT doesn’t support the vectorization of reduction idioms. Since the kernel is memory bound, vectorized JNI implementations are sensible to the memory bandwidth and from a memory-per-invocation greater than the L3 size we have no more vectorization benefits. This threshold is greater for this kernel than the Array addition one because its arithmetic intensity is also greater.
Contrary to the array addition and the horizontal sum ker-nels, the Horner algorithm has an arithmetic intensity re-solved at run-time since it depends on the polynomial de-gree and the number of points to evaluate. For the range of inputs considered, the kernel is CPU-bound (the polyno-mial degree is fixed to 64 and the number of points greater than 4). However, the coefficient-1st version is affected by the memory bandwidth like a memory-bound kernel. The coefficients fills a constant amount of memory that is rela-tively small and fits into the L1 data-cache (512 bytes for a 64-degree polynomial). However, for each coefficient this version needs to load all the input data which causes a lot of cache misses when the amount of data exceeds the L1 size. And this drastically reduces the memory bandwidth. The data-1st version iterates over the coefficient array through a dependency chain for each data. Data is loaded only one time and since the coefficient array fits onto the L1 cache the memory bandwidth is optimal. However the data-1st version is not vectorized by the JIT because it exposes a reduction idiom. Vectorization of the coefficient first imple-mentation leads to a significant speed-up factor of 2 but only for a memory-per-invocation lower than L3 size. Beyond that size, vectorization has no impact due to the memory bottleneck.
5.3
Out-of-order optimization
Out-of-order optimizations are performed by dividing a de-pendency chain into several independent sub dede-pendency- dependency-chains. Kernels which expose a dependency chain are the Horizontal sum and the Horner data-1st. The number of divisions to achieve an optimal out-of-order execution de-pends on the CPU execution units requested. For example, we need 4 dependency-chains for the Horizontal sum and 8 for the Horner data-1st. Mixing out-of-order and vector-ization leads to an optimal instruction level parallelism and performance. Since the JIT can not vectorize such idioms, JNI proves to be an efficient alternative in such case. Consid-ering the Horner data-1st kernel, mixing vectorization and out-of-order allows performance to reach the CPU peak.
5.4
Call-bound part
For all implementations, the performance penalty when the memory-per-invocation decreases is initially due to the con-stant cost of the loop in the measurements. In this
decreas-ing part, implementations are call-bound since the invoca-tion cost is the main bottleneck. Considering the Array ad-dition kernel, the unvectorized Java implementation shows that this cost is rather limited since its performance remains relatively stable. The JNI and Java invocation cost is ob-served comparing the un-inlined version of the Java method with the JNI method which use native memory. Disabling inlining for Java methods shows that the invocation cost is limited since inlining yields a mean improvement of about 20%. Finally the comparison between native memory and heap memory for JNI methods shows that the call bound is mainly due to the invocation of JNI callbacks, first, to get a pointer from the Java array inside the heap and then to release it when the work is done. This causes a penalty of about 40%. The observation is the same for the Horizontal sum kernel where using native memory leads to a benefit of 60%.
5.5
Data Alignment
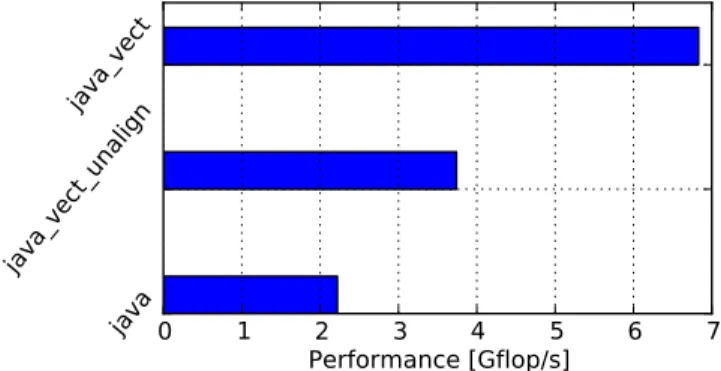
Misalignment performance penalty occurs when four-double packets are not aligned on 16-bytes. Peeling is used by com-pilers to begin vectorization at the first aligned packet. In Java we can’t explicitly align data at allocation, moreover the garbage collector can move the data and as a result change their alignment. In Java double arrays are at least 8-byte aligned. Considering the Array addition kernel, if one array is aligned on 8-byte and the second one on 16-byte then peeling is inefficient and memory access will be unaligned for one array. As showed in Figure 7, this leads to a performance decrease of around 45% which is totally unpredictable since alignment is resolved at allocation (in-visible to Java programmer) and can be modified by the garbage collector.
0
1
2
3
4
5
6
7
Performance [Gflop/s]
java
java_vect_unalign
java_vect
Figure 7: Array addition performance for a memory-per-invocation equal to 16kB
6.
RELATED WORKS
There is so far no performance comparison between pure Java and JNI that takes into account both the overhead of JNI calls and potential deeper optimization provided by the static compilation. Nuzman et al. presented a split auto-vectorization framework [7] combining dynamic compilation with an off-line compilation stage aiming at being compet-itive with static compilation while conserving application portability. Parri et al. [9] designed an API called jSIMD that uses JNI as a bridge to map Java code to SIMD in-structions using vectorized data of various types. Regarding JNI performance issues, Grimmer et al. implemented the
Graal Native Function Interface (GNFI) for the Graal Vir-tual Machine [1] as an alternative to JNI. GNFI aims to mitigate all the disadvantages met using JNI both concern-ing programmconcern-ing flexibility than performance. Stepanian et al. [10] proposed an approach for the IBM TR JIT compiler to widen the compilation span by inlining native code. Fi-nally, Kurzinyec and Sunderam [4] studied the performance of different JNI implementations for several different JVM.
7.
CONCLUSION
In this paper we have presented a performance analysis for a set of micro-kernels considering the JIT vectorization lim-itation and the JNI invocation cost. By plotting the perfor-mance profile for several different implementations of a ker-nel, we have aimed to select the most efficient implementa-tion for a specific amount of computaimplementa-tion. We have showed that one major performance issue in Java concerns reduction kernels that are not vectorized. As a consequence Java im-plementations may suffer from severe performance penalties compared to JNI ones. By using native memory we showed that JNI suffers from a major performance penalty coming from callbacks use to access data inside the Java heap.
8.
REFERENCES
[1] M. Grimmer, M. Rigger, L. Stadler, R. Schatz, and H. M¨ossenb¨ock. An efficient native function interface for java. In Proceedings of the 2013 International Conference on Principles and Practices of Programming on the Java Platform: Virtual Machines, Languages, and Tools, PPPJ ’13, pages 35–44, New York, NY, USA, 2013. ACM.
[2] M. R. Jantz and P. A. Kulkarni. Performance potential of optimization phase selection during dynamic jit compilation. In Proceedings of the 9th ACM SIGPLAN/SIGOPS International Conference on Virtual Execution Environments, VEE ’13, pages 131–142, New York, NY, USA, 2013. ACM.
[3] S. Kulkarni, J. Cavazos, C. Wimmer, and D. Simon. Automatic construction of inlining heuristics using machine learning. In Code Generation and
Optimization (CGO), 2013 IEEE/ACM International Symposium on, pages 1–12, Feb 2013.
[4] D. Kurzyniec and V. Sunderam. Efficient cooperation between java and native codes jni performance benchmark. In In The 2001 International Conference on Parallel and Distributed Processing Techniques and Applications, 2001.
[5] S. Larsen and S. Amarasinghe. Exploiting superword level parallelism with multimedia instruction sets. SIGPLAN Not., 35(5):145–156, May 2000.
[6] J. Moreira, S. Midkiff, M. Gupta, P. Artigas, M. Snir, and R. Lawrence. Java programming for
high-performance numerical computing. IBM Systems Journal, 39(1):21–56, 2000.
[7] D. Nuzman, S. Dyshel, E. Rohou, I. Rosen,
K. Williams, D. Yuste, A. Cohen, and A. Zaks. Vapor simd: Auto-vectorize once, run everywhere. In Proceedings of the 9th Annual IEEE/ACM International Symposium on Code Generation and Optimization, CGO ’11, pages 151–160, Washington, DC, USA, 2011. IEEE Computer Society.
[8] M. Paleczny, C. Vick, and C. Click. The java
hotspottm server compiler. In Proceedings of the 2001 Symposium on JavaTM Virtual Machine Research and Technology Symposium - Volume 1, JVM’01, pages 1–1, Berkeley, CA, USA, 2001. USENIX Association. [9] J. Parri, D. Shapiro, M. Bolic, and V. Groza.
Returning control to the programmer: Simd intrinsics for virtual machines. Queue, 9(2):30:30–30:37, Feb. 2011.
[10] L. Stepanian, A. D. Brown, A. Kielstra, G. Koblents, and K. Stoodley. Inlining java native calls at runtime. In Proceedings of the 1st ACM/USENIX International Conference on Virtual Execution Environments, VEE ’05, pages 121–131, New York, NY, USA, 2005. ACM. [11] G. L. Taboada, J. Touri˜no, and R. Doallo. Java for
high performance computing: Assessment of current research and practice. In Proceedings of the 7th International Conference on Principles and Practice of Programming in Java, PPPJ ’09, pages 30–39, New York, NY, USA, 2009. ACM.
[12] S. Williams, A. Waterman, and D. Patterson. Roofline: An insightful visual performance model for multicore architectures. Commun. ACM, 52(4):65–76, Apr. 2009.