HAL Id: hal-01794625
https://hal-univ-tlse2.archives-ouvertes.fr/hal-01794625
Submitted on 17 May 2018HAL is a multi-disciplinary open access archive for the deposit and dissemination of sci-entific research documents, whether they are pub-lished or not. The documents may come from teaching and research institutions in France or abroad, or from public or private research centers.
L’archive ouverte pluridisciplinaire HAL, est destinée au dépôt et à la diffusion de documents scientifiques de niveau recherche, publiés ou non, émanant des établissements d’enseignement et de recherche français ou étrangers, des laboratoires publics ou privés.
DEA and SFA research on the efficiency of microfinance
institutions: A meta-analysis
François-Seck Fall, Al-Mouksit Akim, Harouna Wassongma
To cite this version:
François-Seck Fall, Al-Mouksit Akim, Harouna Wassongma. DEA and SFA research on the efficiency of microfinance institutions: A meta-analysis. World Development, Elsevier, 2018, 107, pp.176 - 188. �10.1016/j.worlddev.2018.02.032�. �hal-01794625�
DEA and SFA Research on the Efficiency of Microfinance Institutions: a
Meta-Analysis
FALL François
LEREPS, Université de Toulouse, France1 AKIM Al-mouksit
PhD Student, Cheikh Anta Diop University of Dakar, Senegal
Researchers at CRES (Consortium for Economic and Social Research), Dakar, Senegal WASSONGMA Harouna
PhD, Cheikh Anta Diop University of Dakar, Senegal
This article has been accepted for publication and will appear in a revised form in World
Development, vol. 107, July, 2018, p. 176-188, published by Elsevier.
DOI : https://doi.org/10.1016/j.worlddev.2018.02.032
Abstract:
Microfinance has played a key role in the fight against exclusion and the promotion of entrepreneurship in developing countries. An important question today is how to increase the reach and profitability of microfinance, in a context where subsidies are withdrawing to promote the viability and sustainability of microfinance institutions (MFIs). Efficiency analysis has found favor in this context and has attracted growing interest among professionals, partners, and researchers. Abundant empirical work has been conducted over the last ten years on this subject, in very different contexts and with different methodologies. The purpose of this article is to provide a meta-regression analysis on parametric and nonparametric estimations of Mean Technical Efficiency (MTE) in microfinance, using a data set of 262 observations from 38 studies. The results show that, in the microfinance industry, MTE scores have increased over time. However, with an MTE rate of approximately 61.1%,
1 CRES (Consortium for Economic and Social Research), Dakar, Senegal
there is room for improving efficiency. MFIs use more resources than necessary for the results achieved in terms of outreach and revenue generated. Our results show heterogeneity of MTE according to the methodological approach of the studies. Studies with a larger number of variables (inputs and outputs) produced higher MTE scores than did those with a smaller number of variables. Studies using the variable returns to scale assumption resulted in higher MTE scores than those using constant returns to scale. In addition, those with a production approach had higher MTEs than did those using the intermediation approach, while studies of a large number of MFIs had lower scores than did those involving a small sample size. Moreover, research estimating social efficiency generated lower MTEs compared to those estimating financial efficiency. Studies using data from African MFIs obtained lower MTEs than did those on MFIs in Latin America and MENA, which confirms the poor performance of African microfinance.
Keywords: Meta-Analysis /Microfinance/technical Efficiency/DEA/SFA
1. INTRODUCTION
Microfinance has played a key role in the fight against exclusion and the promotion of entrepreneurship in developing countries (Dupas and Robinson, 2013; Khandker 2001; Pitt and Khandker, 1996). Microfinance differs from classical banking in particular because of its dual social and commercial mission, which also creates constant pressure for the microfinance institutions (MFIs) that truly pursue this double objective. Today, additional pressure has been added: the gradual withdrawal of subsidies for microfinance. Increasingly, donors are withdrawing from the microfinance sector because they are concerned about the continued existence of MFIs. Therefore, the overarching goal of microfinance institutions has become demonstrating viability. At the same time, management practices in MFIs have prioritized efficiency and cost reduction (Blanco-Oliver et al., 2016). This particular context has created an interest in research on the effectiveness of microfinance, making it a crucial issue today. This body of research provides empirical evidence on the sources of waste and inefficiencies in microfinance, key information for regulatory authorities and MFI managers. Also, with increasing financing by the capital market, efficiency analysis is a growing priority in this industry. Moreover, this interest in microfinance efficiency can be explained by greater
awareness of the role of efficiency in reconciling the social and financial objectives of microfinance (see Ben Soltane, 2008). For these reasons, over the past ten years there has been an abundance of empirical research analyzing microfinance efficiency.
Studies on microfinance efficiency have essentially adopted two main estimation methodologies: Data Envelopment Analysis (DEA), a nonparametric approach to data envelopment, and Stochastic Frontier Analysis (SFA), a parametric approach to estimation by stochastic boundaries. Empirical research on this issue has also been conducted in different regions, with different data, and for different periods. Studies have also covered very different MFIs in terms of their status, size, primary orientation, etc. Although the results seem to converge towards the low efficiency of microfinance, the studies have yielded rather disparate results. Despite the abundance of research, the literature has not yet provided empirical evidence about the factors that influence efficiency estimates. Another difficulty is that the techniques often used (DEA and SFA) are debatable because of their inherent weaknesses. Therefore, if we want an accurate appreciation of the role estimation techniques play and of the characteristics of studies on Mean Technical Efficiency (MTE) in microfinance, an overall analysis of current research is necessary. To date, such a study is non-existent in microfinance.
The purpose of this article is therefore to provide a meta-regression analysis on parametric and nonparametric estimations of MTE in microfinance. The challenge is to see how the methods used and the characteristics of these studies influenced their estimation of MTE. We focus particularly on the following questions: Can the differences in MTE results be explained by differences in methods? Is the MTE score determined by study characteristics such as sample size, study area, number of variables, date of publication, or quality of the journal in which it is published? Is the MTE score influenced by the returns to scale specification used (CRS vs. VRS)? Do the results change depending on whether the estimated model examines
social or financial efficiency? Does the MTE score change when moving from an intra-country to an inter-intra-country level?
These major issues have not been addressed in the microfinance literature. In fact, the literature does not provide a clear indication of the extent to which the efficiency estimates are sensitive to the methodological choices used and the characteristics of each study. The present article aims to fill this gap through a meta-analysis, a technique that explains the variations in the empirical results of a given indicator on the basis of the characteristics that differentiate the studies. We used a doubly-censored Tobit model with cluster option that provides robust estimates when the dependent variable is bounded between 0 and 1. In order to gauge model robustness, we also estimated an OLS model with the cluster option, which is commonly used in this type of analysis, as well as a simple left- and right-censored Tobit model (see Thiam et al., 2011; Bravo-Ureta et al., 2007). Given the risk of correlations between the estimated technical efficiency scores and the study characteristics, we also used a Simar and Wilson model (2007) with the bootstrap option. These models compare MTE scores with the characteristics of each study, such as estimation method, number of variables, sample size, different choices of specifications, the region where the MFIs are located, etc.
The results show that in the microfinance industry, MTE scores have increased over time. However, with an MTE rate of approximately 60%, there is room for improving efficiency by 40%. The discrepancies between studies in their estimations of technical efficiency depended on the number of variables used, the specification choices, the number of MFIs studied, the region the MFI was located in, and the scale of analysis. Studies with a larger number of variables (inputs and outputs) produced higher MTE scores than those with a smaller number of variables. Studies using the variable returns to scale (VRS) assumption resulted in higher MTE scores than those using constant returns to scale (CRS). In addition, those with a production approach had higher MTEs than those using the intermediation approach, while
studies of a large number of MFIs had lower scores than those involving a small sample size. Moreover, research estimating social efficiency generated lower MTEs compared to those estimating financial efficiency. Studies using data from African MFIs obtained lower MTEs than those on MFIs in Latin America and MENA.
This article thus makes an important contribution to the literature as it is the first meta-analysis on microfinance efficiency, to our knowledge. The results provide major insight into the factors of inter-study variabilities in estimating efficiency in this industry. The article is organized as follows: first, we briefly review the conceptual framework of efficiency and the main estimation methods in microfinance (section 2); then we present the methodology and the study data (section 3), as well as the results obtained (section 4); finally, we conclude (Section 5).
2. THE CONCEPT OF TECHNICAL EFFICIENCY AND THE FRONTIER METHODOLOGY IN MICROFINANCE
Technical efficiency (TE) in microfinance refers to the efficiency with which MFIs use resources in the production process (Widiarto and Emrouznejad, 2015). It expresses the capacity of decision-making units (DMUs, MFIs here) to produce the maximum number of outputs with a given quantity of inputs or, conversely, to mobilize the minimum inputs for a given level of outputs. When an MFI is unable to proportionally increase its output without also increasing its inputs, it is said to be technically efficient. However, technical efficiency (TE) is only one aspect of efficiency, as Farell (1957) emphasizes. Another component of efficiency is allocative efficiency. In microfinance, this refers to the efficient combination of inputs and outputs that takes into account input prices and their productivity. In this perspective, an MFI is said to be efficient if it manages to minimize its production costs or to maximize its revenues. The economic efficiency of a decision-making unit (MFI) is thus the
sum of technical efficiency and allocative efficiency. This article focuses on technical efficiency, not only because it is the most studied in the literature, but it is also easier to estimate. Calculating allocative efficiency, in fact, requires information on the prices of inputs and outputs, which is very difficult to obtain in microfinance.2
Among all the techniques for estimating efficiency in general and microfinance in particular, there are two main approaches: parametric and nonparametric. The former is based on an econometric estimate of the efficiency frontier and subdivides into two groups: deterministic parametric approaches and stochastic ones. The specificity of deterministic methods is that they consider any deviation from the frontier as a result of inefficiency. Thus, they risk being biased, especially when the data are affected by measurement errors. As an alternative, there are stochastic frontier methods, of which SFA is the best-known. Compared to conventional parametric methods such as OLS, the SFA approach is distinctive because the error term breaks down into a two-sided component: a normally distributed random error term (µ) that takes into account exogenous factors beyond the firm’s control, and an error term (ʋ) representing the firm’s technical inefficiency. First introduced by Aigner, Lovell and Schmidt (1977), this approach has been widely used in assessing banking efficiency and more recently in microfinance. Its main advantage lies in separating the inefficiency that results from random shocks from that which results from the technical inefficiency of the firm. This breakdown explains why SFA generally gives lower MTE results than DEA. In addition, SFA models can be used to estimate errors and test hypotheses (Odeck and Brathen, 2012).
However, parametric approaches, whether deterministic or stochastic, must specify the functional form of the production or cost function that serves as the basis for estimating the
2 This is often the case in other areas such as banking, education, healthcare, agriculture, etc. but is even more
efficiency frontier. Some empirical studies have used the SFA approach for estimating microfinance efficiency (Hermes et al. 2009; Oteng-Abayie et al., 2011; Masood and Ahmad, 2010; Servin et al., 2012; Desrochers and Lamberte, 2003; Quayes and Khalyli, 2014; Riaz and Gopal, 2015; Bos and Millone, 2015; Mor, 2016). Among them, some have estimated a cost function (Riaz and Gopal, 2015; Billi and Thi, 2012), while others a production function (Bos and Millone, 2015; Hermes et al., 2011). The disadvantage of SFA in microfinance lies in the difficulty of specifying a typical production function, as there are many different situations in microfinance.
In contrast, nonparametric approaches require no specification of the functional form. They are based on the mathematical estimation of a linear programming function that connects inputs and outputs. Two main approaches stand out in this group: the DEA model and the FDH (Free Disposal Hull) model. In microfinance research, DEA is predominant.3 This method consists in the nonparametric estimation of an efficiency frontier that envelops the ensemble of individuals and makes it possible to identify best practices, those located on the frontier. It was initially developed by Charmes, Cooper and Rhodes (1978) and Banker (1984), based on the theoretical framework of Farell (1957). Unlike SFA, DEA is a deterministic method that also has many advantages. Beyond the fact that it does not require any specification of the functional form of the frontier, it is flexible and well-suited to multi-product industries such as microfinance. Its fundamental limitation is its high sensitivity to data, sample size, and measurement errors. In these cases, DEA leads to biased estimates (Greene, 1993).
There is a great deal of efficiency research in the banking industry (see Berger and Humphrey, 1997; Battese, G., Coelli, T., 1995; Battese et al., 2004; Berg et al., 1995 ; Berger
et al., 1993; Bos et Kool, 2001 ; Bos et Schmiedel, 2003). In microfinance, such work is more recent and integrates new aspects. For example, the dual objective of microfinance calls for additional considerations when analyzing efficiency. In particular, taking into account social efficiency, in addition to financial efficiency, is essential. Although this was not often done in previous research (Nghiem et al., 2006, Qayyum and Ahmad, 2006, Gutiérrez-Nieto et al., 2007, Ben Soltane 2008, Hassan and Sanchez, 2009), the social aspect has been increasingly integrated in recent studies (Akram and Ahmad, 2016, Cornée and Tenet, 2016, Van Damme et al., 2016, Basharat et al., 2015, Lebovics et al., 2016, Widiarto and Emounznejad, 2015, Wijesiri, Viganò and Meoli, 2015). Moreover, in estimating efficiency, as financial intermediaries MFIs have been judged by the yardstick of banking theory. In this theory, there are two main approaches: production and intermediate (Sealey and Lindley, 1977; Berger and Humprey, 1997). In microfinance, most studies have focused on production (Wijesiri, Viganò and Meoli, 2015 ; Ben Soltane, 2008; Gutiérrez-Nieto et al., 2007; Haq et al., 2010; Nghiem et al., 2006), in particular because not all MFIs are allowed to collect savings from the general public. Nevertheless, some studies have chosen an intermediation approach (Wijesiri, Viganò and Meoli, 2015, Ben Soltane, 2008, Gutiérrez-Nieto et al., 2007, Haq et al., 2010, Nghiem et al. 2006). Some have also combined the two approaches (Piot-Lepetit and Ngongang, 2014). In addition, research breaks down into an input orientation or an output one. Both types of orientation generally provide the same results. Finally, the assumption underlying the estimate is also determinant: most microfinance models have been estimated using variable returns to scale (VRS) due to the low maturity of this industry, but also because of different regulations depending on the contexts and status of microfinance. VRS models also result in higher efficiency scores than the CRS ones, which this study will verify.
a. Data
This meta-analysis includes all research analyzing microfinance efficiency between 20064 and 2016. The studies selected were mainly published in peer-reviewed journals but some working papers have been included (Hassan and Sanchez, 2009, Ahmad, 2011, Abdelkader et al., 2012, Kablan, 2012). The latter are major works on microfinance efficiency and are very often cited in the literature, including studies published in the best journals. The integration of unpublished works is also well-viewed in meta-analysis, in particular to avoid selection bias. The studies examined were identified through platforms such as Sciencedirect, Mendeley, Springer, Jstor, SSRN, Google Scholar, etc. Some well-known studies on efficiency were excluded here because the technical efficiency score was not indicated and the information provided did not enable us to calculate it. This was the case for example with studies by Servin et al. (2012), Hartarska et al. (2013), Ben Soltane (2014), Wijisiri and Moeli (2015), and Mia and Ben Soltane (2016). We also excluded studies using the malmquist DEA to estimate microfinance productivity, since this research relates to productivity and not technical efficiency.
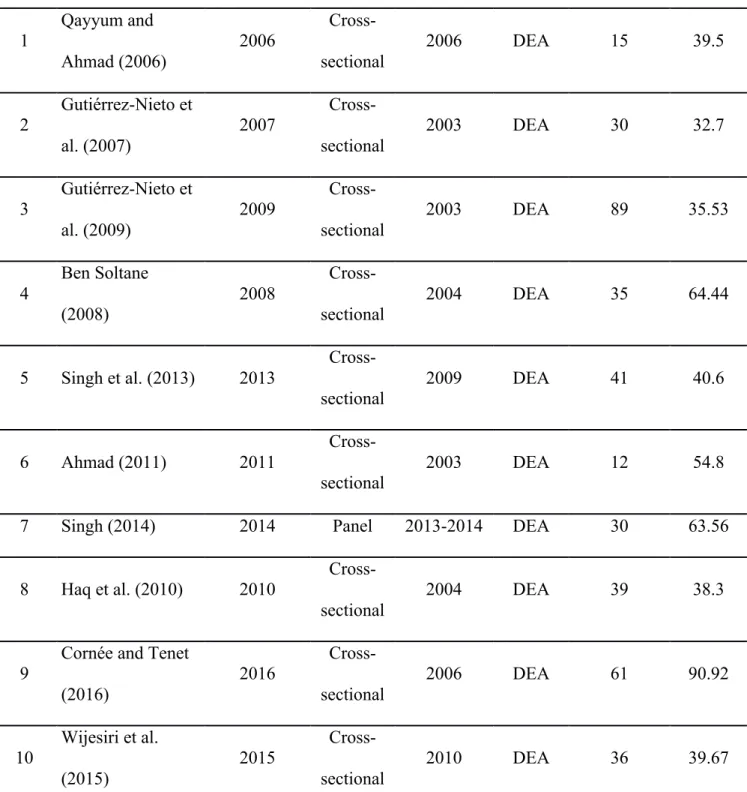
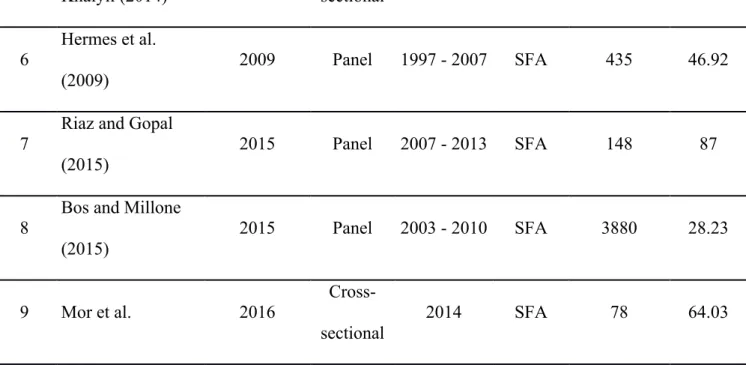
In the end, this study includes 38 articles that used DEA or SFA to estimate the efficiency of microfinance. For each study selected, we collected data on the MTE and study characteristics such as estimation choices, sample size, number of variables, year of data used, region, etc., following research on meta-analysis (Thiam et al., 2001 ; Bravo-Ureta et al., 2007 ; Moreira-Lopez and Bravo-Ureta, 2009 ; Odeck and Brothen, 2012 ; Ogundari, 2014 ; Fatimata and Yasmin, 2016 ). Table 1 gives the studies’ characteristics.
Table 1: Characteristics of the studies reviewed
Study Author(s) Publication year Data Type Year of data Basic model Number of observations MTE score I. Nonparametric DEA frontiers
1 Qayyum and Ahmad (2006) 2006 Cross-sectional 2006 DEA 15 39.5 2 Gutiérrez-Nieto et al. (2007) 2007 Cross-sectional 2003 DEA 30 32.7 3 Gutiérrez-Nieto et al. (2009) 2009 Cross-sectional 2003 DEA 89 35.53 4 Ben Soltane (2008) 2008 Cross-sectional 2004 DEA 35 64.44 5 Singh et al. (2013) 2013 Cross-sectional 2009 DEA 41 40.6 6 Ahmad (2011) 2011 Cross-sectional 2003 DEA 12 54.8 7 Singh (2014) 2014 Panel 2013-2014 DEA 30 63.56 8 Haq et al. (2010) 2010
Cross-sectional
2004 DEA 39 38.3
9 Cornée and Tenet (2016) 2016 Cross-sectional 2006 DEA 61 90.92 10 Wijesiri et al. (2015) 2015 Cross-sectional 2010 DEA 36 39.67
11 Piot-Lepetit and Nzongang (2014) 2014 Cross-sectional 2009 DEA 52 87.5 12 Widiarto and Emounznejad (2015) 2015 Cross-sectional 2009 DEA 204 78.24 13 Gueyie et al. (2010) 2010 Cross-sectional 2006 DEA 20 93.7 14
Tahir and Tahrim
(2013) 2013 Cross-sectional 2008 DEA 140 69.97 15 Kipesha (2012) 2012 Cross-sectional 2009 DEA 35 70.6 16 Jayamaha (2012) 2012 Cross-sectional 2005 DEA 125 73.6 17 Segun and Anjuvan (2013) 2013 Panel 2008 à 2010 DEA 70 23.2 18 Abdelkader et al. (2012) 2012 Cross-sectional 2006 DEA 40 83 19 Annim (2010) 2010 Cross-sectional 2004 DEA 164 42.7 20 Nzongang et al. (2012) 2012 Cross-sectional 2009 DEA 52 78.45 21 Kablan (2012) 2012 Cross-sectional 2000 DEA 104 43.07 22 Hassan and 2009 Cross- 2005 DEA 141 70
Sanchez (2009) sectional 23 Van Damme et al.
(2016) 2016 Cross-sectional 2011 DEA 36 75.27 24 Lebovics et al. (2015) 2015 Cross-sectional 2011 DEA 28 94.5 25 Akram et al. (2016) 2017 Cross-sectional 2008 DEA 170 86.7 26 Basharat et al. (2015) 2015 Panel 2005-2008 DEA 57 82.57 27 Ferdousi (2013) 2013 Cross-sectional 2010 DEA 42 40.3 28
Tahir and Tahrim
(2015) 2015 Cross-sectional 2008 DEA 13 91.1 29 Nghiem et al. (2006) 2006 Cross-sectional 2006 model 44 76 II. Parametric stochastic frontiers
1 Oteng-Abayie et al. (2011) 2011 Panel 2007-2010 SFA 135 56.29 2 Masood and Ahmad (2010) 2010 Panel 2005-2008 SFA 40 34.01 3 Servin et al.(2012) 2012 Panel 2003-2009 SFA 1681 58.1
4
Desrochers and
Lamberte (2003) 2003 Panel 1995 -1999 SFA 50 0.4 5 Quayes and 2014 Cross- 2004 SFA 45 2.22
Khalyli (2014) sectional 6 Hermes et al. (2009) 2009 Panel 1997 - 2007 SFA 435 46.92
7 Riaz and Gopal (2015)
2015 Panel 2007 - 2013 SFA 148 87
8
Bos and Millone (2015) 2015 Panel 2003 - 2010 SFA 3880 28.23 9 Mor et al. 2016 Cross-sectional 2014 SFA 78 64.03 Source: authors
Tables 2 and 3 below give some descriptive statistics on the studies analyzed. Table 2 clearly shows that nonparametric approaches dominate the literature. Of the 38 studies included in this meta-analysis, 29 used the DEA approach compared with only 9 for SFA. Since some articles, including DEA studies, estimated several models, the 35 studies produced a total of 262 MTEs, of which 230 are DEA and 32 are SFA. These models were estimated in several different contexts: Asia, Latin America, MENA (Middle East and North Africa) and Africa. Work was mainly conducted in Asia (38.7%) and in MENA (43.7%), with much less work on Africa (3.6%).
Table 2: Quantitative survey of the literature
Nonparametric studies (DEA)
Parametric studies
(SFA) Total sample
Number of studies 29 09 38
Number of data points 230 32 262
Mean TE 0.629 0.484 0.611 Data Cross-sectional 79.8% 6.5% 86.3% Panel 8.0% 5.7% 13.7% TE-orientation Input saving 77.9% 7.3% 85.1% Output increasing 9.9% 5.0% 14.9% Nonparametric specification CRS 47.8% VRS 52.2% Region of study Africa 24.4% 0.4% 24.8% Asia 32.8% 3.1% 35.9% Latin America 12.6% 2.7% 15.3% MENA 5.3% 12.6% 17.9% World 12.6% 6.1% 18.7% Scale of Analysis Intra country 35.5% 52.3% 87.8% Inter country 52.3% 8.0% 60.3% Finance vs social Finance 11.8% 0.8% 12.6% Mixed 66.8% 11.1% 77.9%
Social 9.2% 0.4% 9.5%
Source: the authors
We note that the MTE estimated by these studies is approximately 60% for the microfinance industry. This result points to the inefficiency of this industry in the technical management of resources and shows that the potential for improving efficiency in this industry is approximately 40%. Concerning the type of data used, most studies worked with cross-sectional data (86.9%), compared with only 15.3% for panel data. Most studies chose input orientation (84.7%) and very few chose output (15.3%). In the DEA studies, 57.4% of the estimated models used the VRS assumption and 42.6%, CRS. As noted above, this choice is generally justified by the imperfect competition in this industry and the fact that a large majority of MFIs have not yet matured. Most of the work estimated a mixed model of financial efficiency (77.9%) while very few estimated a social efficiency model (9.5).
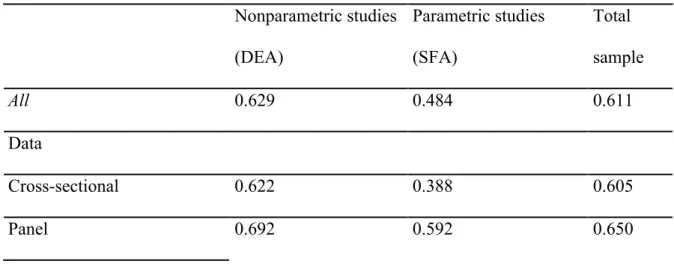
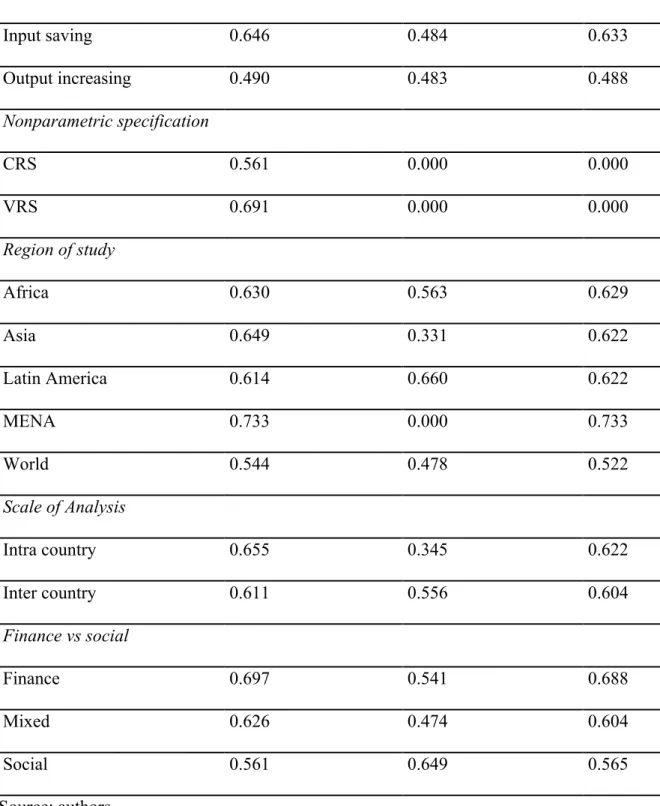
Table 3: MTE scores by different study characteristics
Nonparametric studies (DEA) Parametric studies (SFA) Total sample All 0.629 0.484 0.611 Data Cross-sectional 0.622 0.388 0.605 Panel 0.692 0.592 0.650
TE-orientation Input saving 0.646 0.484 0.633 Output increasing 0.490 0.483 0.488 Nonparametric specification CRS 0.561 0.000 0.000 VRS 0.691 0.000 0.000 Region of study Africa 0.630 0.563 0.629 Asia 0.649 0.331 0.622 Latin America 0.614 0.660 0.622 MENA 0.733 0.000 0.733 World 0.544 0.478 0.522 Scale of Analysis Intra country 0.655 0.345 0.622 Inter country 0.611 0.556 0.604 Finance vs social Finance 0.697 0.541 0.688 Mixed 0.626 0.474 0.604 Social 0.561 0.649 0.565 Source: authors
Table 3 details the MTE estimated. TE was higher in the VRS models (68.42%) than in the CRS models (48.98%). The MTE score was lower in SFA models (42.37% versus 62.45% in DEA models). The MTE scores in Africa (77.54%) and Asia (64.87%) were above the global
average, while in Latin America and the MENA region it was slightly below average. Finally, MTE was lower in studies examining social efficiency (56.5%) as compared to financial efficiency (68.8) and the mixed models (60.4).
b. Methodology
We hypothesize that the different microfinance MTE levels would be explained by factors specific to each study, such as the estimation methodology (DEA, SFA), the sample size, the number of inputs and outputs in the model, choice of basic assumptions in estimation, microfinance context, etc. In order to test these hypotheses, we estimate the following empirical model:
𝑀𝑇𝐸! = 𝑋!𝛽 + 𝐸! (1)
𝑀𝑇𝐸! is the mean technical efficiency score estimated by study i; 𝑋! is the vector of the characteristics of study i which are supposed to explain its MTE. Model errors are given by 𝐸. Given the censored nature of the dependent variable, the equation can be rewritten as a Tobit model (Greene, 1997):
𝑀𝑇𝐸
!!! !"!"!"! !" !!!"!!! !!! !" !"!!!
(2)
Equation (1) then becomes:
𝑀𝑇𝐸! = 𝛽!+ 𝛽!𝐴𝑉!"#!!
! + 𝑀𝑂𝐷𝐸𝐿! + 𝑁!"#!+ 𝑂𝑃𝑇𝐼𝑂𝑁!+ 𝐸𝐹𝐹_𝑇𝑌𝑃𝐸_𝑆𝑂𝐶!
+𝐸𝐹𝐹_𝑇𝑌𝑃𝐸_𝑀𝐼𝑋!+ 𝐴𝑃𝑃𝑅𝑂𝐴𝐶𝐻! + 𝑆𝐼𝑍𝐸!+ 𝑆𝑇𝑈𝐷_𝑇𝑌𝑃𝐸! + 𝐷𝐴𝑇𝐴_𝑇𝑌𝑃𝐸! + 𝑅𝐴𝑁𝐺! + 𝑅𝐸𝐺𝐼𝑂𝑁!!!! (3)
With MTE as the mean technical efficiency found in each study; AV_DATA_Y is the mean year of the study data; MODEL is a categorical variable with two options that indicates the model used for estimating MTE (DEA or SFA); N_VAR is the number of variables (inputs and
outputs) in the model; OPTION is a categorical variable that takes either the CRS or VRS assumption; EFF_TYPE_Soc is a categorical variable that was scored SOCIAL when the study estimated a social model and FINANCIAL when the study estimated a financial model;
EFF_TYPE_MIX is a categorical variable that is Mixed when the study estimated a mixed
model and Financial when the study estimated a financial model; APPROACH is a categorical variable with PRODUCTION when the study was estimated with the production approach and INTERMEDIATION when used the intermediation approach; SIZE represents the sample size of the study, i.e. the number of MFIs studied; STUD_TYPE is a categorical variable that takes the INTRA modality if the study was carried out within the same country and CROSS when it covered several countries; DATA_TYPE is a variable that designates the type of data used; it with either PANEL when it is panel data or CT for cross-sectional data; RANG is a dummy variable with a value 1 when the study is published in a rank 1 academic journal and 0 otherwise; REGION is a variable that designates the study region with five options (Africa, Asia, Latin America, Mena, World), with Africa as the reference. It breaks down in several ways depending on the regions compared directly. Due to the very limited number of SFA studies, we chose not to introduce a variable to distinguish the Cobb Douglas and Translog functions. We estimated a left- and right-censored Tobit model since the efficiency scores range from 0 to 100. We estimated the same model with the cluster option to account for heteroscedasticity problems that might arise from data belonging to the same study. We termed this model the ‘clustered Tobit model’. We also estimated an OLS model and a truncated bootstrap model from Simar and Wilson (2007) to gauge the robustness of our results. Estimating Simar and Wilson’s model (2007) is justified by the potential correlation between the endogenous variable and the characteristics of each study. This method also enabled us to determine the data generating process of our sample, which is not the case with the other models. We used algorithm 1 from Simar and Wilson (2007), which is more suitable
for samples of relatively large size. For more details on this algorithm, see Simar and Wilson (2007).
4. RESULTS AND DISCUSSION
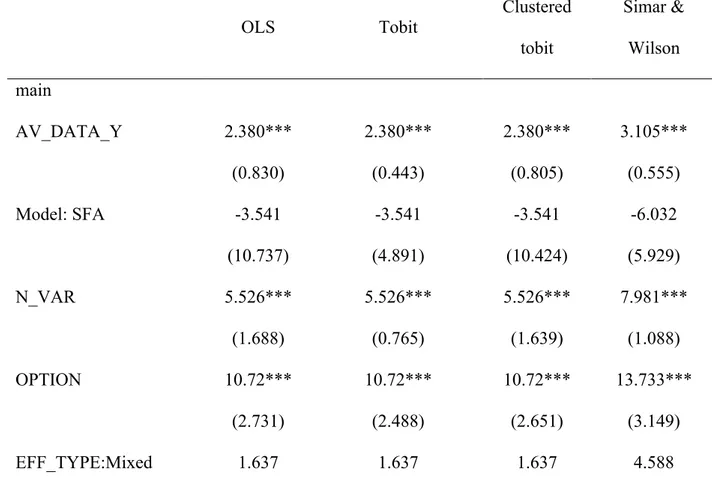
Table 4 below gives the results of the four estimated models: OLS, Tobit, clustered Tobit, and truncated bootstrap by Simar and Wilson (2007). Overall, the results of the four are similar. The estimated parameter for the mean year of the data (AV_DATA_Y) was positive and statistically significant, showing that MTE has increased over time in the microfinance industry. Intuitively, this result may indicate that the microfinance industry has gradually increased its efficiency in resource management. This result is consistent with Thiam et al. (2001). The latter conducted a meta-analysis in agriculture and found a positive relationship between MTE and the year of publication of the study5. Ogundari and Brümmer (2011) also found a significant increase in MTE over time. Odeck and Brothen (2012), in a meta-analysis on the efficiency of seaports, instead found a negative relationship. Brons et al. (2005) also found that more recent studies estimated a lower efficiency score than previous studies.
MTE increased significantly with the number of variables in the model. The estimated coefficient of the variable N_VAR was positive and significant in all the models here (at the 1% threshold). Thus studies that estimated technical efficiency with a greater number of variables obtained higher average scores. This is a standard result that highlights the sensitivity of the DEA method regarding the number of integrated variables. This result is consistent with Nguyen and Coelli (2009), which found a positive impact of the number of variables on MTE. Gutiérrez-Nieto et al. (2007) described several models based on different
5 However, our study uses the average data year as the proxy for the date, which is not the case for Thiam et al.
combinations of input and output, and their results clearly indicate higher technical efficiency scores in models with more inputs and outputs.
The results also show that studies with the variable returns to scale assumption generated a higher MTE score than those with constant returns to scale. This is also a standard result in efficiency estimation. Since the VRS assumption is less restrictive than CRS, the estimated mean efficiency is generally higher. The same result was obtained by Odeck and Brothen (2012) and Nguyen and Coelli (2009).
The sample size variable (SIZE) had a negative coefficient and was very significant in all models (threshold of 1%), showing that the MTE is lower in large-sample studies than in small-sample studies. This result is common in meta-studies on efficiency (Nguyen and Coelli, 2009, Aiello and Bonanno, 2015).
The coefficient of the type of efficiency variable (EFF_TYPE_Social) was negative and significant in all models; thus studies estimating a social efficiency model yielded lower efficiency scores than those on financial efficiency. This may be explained by the fact that social efficiency is more constraining for MFIs than financial efficiency.
The data also show that studies adopting a production approach generated a higher mean efficiency score than those with an intermediate approach. Similarly, work in the MENA and Latin America regions estimated higher efficiency scores than those in Africa. The STUD_TYPE, RANG, and REGION_WORLD variables were not significant in the OLS, Tobit, and Clustered Tobit models, but were significant in the more robust truncated bootstrap Simar and Wilson model. In addition, studies within the same country yielded higher mean efficiency scores than those carried out in several countries. Studies published in rank 1 journals estimated higher MTE scores than those published in lower ranking journals.
Moreover, the results also show that studies at the global level generated higher efficiency scores than those in Africa. The DATA_TYPE, MODEL variables often studied in meta-analyses were not significant in all estimated models. However, their signs are intuitive. The coefficient of the variable (DATA_TYPE) was positive, showing that studies using panel data had a higher mean efficiency score than those using cross-sectional data. The negative coefficient of the DATA_TYPE variable revealed higher scores in studies using panel data. This result is in line with Aiello and Bonanno (2016), but in contrast to Odeck and Brothen (2012). However, this result is not statistically significant. Finally, studies that estimated an SFA model produced a lower MTE score than those with a DEA model. This is a traditional but unfortunately not statistically significant result.
Table 4: Regression Results
OLS Tobit Clustered Simar & tobit Wilson main AV_DATA_Y 2.380*** 2.380*** 2.380*** 3.105*** (0.830) (0.443) (0.805) (0.555) Model: SFA -3.541 -3.541 -3.541 -6.032 (10.737) (4.891) (10.424) (5.929) N_VAR 5.526*** 5.526*** 5.526*** 7.981*** (1.688) (0.765) (1.639) (1.088) OPTION 10.72*** 10.72*** 10.72*** 13.733*** (2.731) (2.488) (2.651) (3.149) EFF_TYPE:Mixed 1.637 1.637 1.637 4.588
(6.496) (4.202) (6.306) (5.47) EFF_TYPE:Social -13.14* -13.14*** -13.14* -16.451*** (6.964) (4.569) (6.760) (5.79) APPROACH:Productio n 13.20* 13.20*** 13.20* 14.564*** (7.410) (3.962) (7.194) (4.593) SIZE -0.0107*** -0.0107** -0.0107*** -0.014*** (0.003) (0.004) (0.003) (0.005) STUD_TYPE:Intra country 4.536 4.536 4.536 9.008** (5.834) (3.015) (5.664) (3.646) DATA_TYPE:Panel 5.110 5.110 5.110 7.654 (7.644) (4.139) (7.420) (5.134) RANG_dummy==1 2.712 2.712 2.712 9.32** (6.154) (3.365) (5.974) (4.231) REGION:Asia 2.302 2.302 2.302 1.723 (6.408) (3.019) (6.221) (3.594) REGION: Latin Am 17.78** 17.78*** 17.78** 20.383*** (7.989) (4.422) (7.755) (5.639) REGION:MENA 14.56** 14.56*** 14.56*** 18.754*** (5.515) (5.223) (5.353) (6.903) REGION:World 7.738 7.738 7.738 12.85** (7.941) (4.837) (7.709) (5.95) _cons -4765.6*** -4765.6*** -4765.6*** -6238.329*** (1671.352) (890.884) (1622.503) (1116.637)
sigma _cons 17.16*** 17.16*** 18.7*** (0.750) (1.384) (0.987) Observations 262 262 262 262 AIC 2265.0 2267.0 2267.0 BIC 2322.1 2327.7 2327.7
Standard errors in parentheses * p < 0.10, ** p < 0.05, *** p < 0.01
5. CONCLUSION
This study is the first to propose a meta-analysis of research on technical efficiency in microfinance. We estimated several models: a doubly-censored Tobit model, a clustered Tobit model, an OLS model, and a truncated bootstrap model from Simar and Wilson (2007). This research collected data from 38 studies estimating microfinance efficiency from 2006 to 2016. As some studies estimated several efficiency models, in the end we had 262 MTE results on which we performed the meta-analysis. The four estimated models provided similar results, highlighting the robustness of our findings. The results show an improvement in the level of microfinance efficiency over time, demonstrating better resource management in this industry. However, the level of efficiency of the industry as a whole remains weak and should be improved. With a 60% MTE, there is still great potential for improving efficiency in this industry.
The results show that the specifications as well as the characteristics of each study played a decisive role in estimated MTE scores. The score was higher in studies using a large
number of variables (inputs and outputs), those with a production approach, and those using the variable returns to scale (VRS) assumption. Studies of MFIs in Latin America and the MENA region also obtained a higher MTE score than those conducted on African MFIs. On the other hand, the MTE score was lower in studies with large sample sizes and those estimating a social model. The lesson we draw from this meta-analysis is that the divergences between studies on microfinance MTE relate to the differences between study characteristics and the choice of specifications.
The main limitation of the present study is that the analysis of microfinance efficiency is still recent and the number of studies carried out is still low. In particular, little work has been done with the SFA approach; DEA is more common in estimating microfinance efficiency. Yet the latter suffers from inherent weaknesses: it is highly sensitive to data and sample size and may lead to biased estimates if there are measurement errors or outliers. Robust approaches exist today, but have hardly been used in research on the microfinance industry. A diversification of estimation methodologies, including new robust approaches (order-alpha, order-m, etc.), would introduce more heterogeneity into the data used for meta-analysis. Despite this limit, the present study sheds considerable light on the factors of variability in estimating efficiency in the microfinance industry to date.
REFERENCES
Abdelkader, B., Jemaa, B., & Mekki, M. (2012). Microfinance Institutions’ Efficiency in the MENA region: a Bootstrap-DEA approach. www.econstor.eu.
Aigner, D., Lovell, C. K., & Schmidt, P. (1977). Formulation and estimation of stochastic frontier production function models. Journal of Econometrics, 6(1), 21-37. No. 34215. Aiello, F., & Bonanno, G. (2016). Efficiency in banking: a meta-regression analysis.
International Review of Applied Economics, 30(1), 112-149.
Akram, W., Shan, S., Shaikh, S., & Yashkun, U. U. (2016). Determinants of Microfinance Institutions' Efficiency in South Asia during Financial Crisis: A Two-Stage Analysis.
Pakistan Journal of Social Sciences (PJSS), 36(2).
Akpalu, W., Alnaa, S. E., & Aglobitse, P. B. (2012). Access to microfinance and intra household business decision making: Implication for efficiency of female owned enterprises in Ghana. Journal of Socio-Economics, 41(5), 513–518.
Annim, S. K. (2010). Microfinance efficiency trade-offs and complementarities. Brooks World Poverty Institute ISBN: 978-1-907247-26-2
Aragon, Y., Daouia, A., & THOMAS-AGNAN, C. (2005). Nonparametric Frontier Estimation: a Conditional Quantile-Based Approach. Econometric Theory (Vol. 21). Balkenhol, B. (2007). Microfinance and Public Policy: Outreach, Performance and Efficiency,
Palgrave Macmillan
Banker, R. D. (1984). Estimating most productive scale size using Data Envelopment Analysis.
European Journal of Operational Research, 17, 35–44.
Basharat, B., Hudon, M., & Nawaz, A. (2015). Does Efficiency Lead to Lower Prices? A New Perspective from Microfinance Interest Rates. Strategic Change, 24(1), 49–66.
Battese, G., Coelli, T., (1995). A model for technical inefficiency effects in a stochastic frontier production function for panel data. Empirical Economics, 20, 325–332.
Battese, G.E., Prasado Rao, D.S., OÕ Donnell, C.J., 2004. A metafrontier production function for estimation of technical efficiencies and technology gaps for firms operating under different technologies. Journal of Productivity Analysis, 21 (1), 91–103.
Ben Soltane, B. (2008). Efficiency of Microfinance institutions in the Mediterranean: an application of DEA. Transition Studies Review, 15 (2), 343-354.
Ben Soltane, B. (2014). Total factor productivity change of MENA microfinance institutions: A Malmquist productivity index approach. Economic Modelling, 39, 182–189.
Berg, S., Bukh, P.N.D., Forsund, F.R., (1995). Banking efficiency in the Nordic countries: A four-country malmquist index analysis, working paper, University of Aarhus, Denmark, September.
Berger, A. N., Humphrey, D. B. (1997). Efficiency of financial institutions: International survey and directions for future research. European Journal of Operational Research, 98, 175–212
Berger, A.N., Mester, L.J., (1997). Inside the black box: What explains differences in the efficiencies of financial institutions. Journal of Banking and Finance 21, 895–947.
Berger, A. N., Hunter, W. C., & Timme, S. G. (1993). The efficiency of financial institutions: A review and preview of research past, present and future. Journal of Banking & Finance, 17(2), 221-249.
Bolli, T., & Thi, A. V. (2012). On the estimation stability of efficiency and economies of scale in microfinance institutions. Working paper, papers.ssrn.com
Bos, J.W.B., Kool, C.J.M., (2001). Bank size, specialization and efficiency in the Netherlands: 1992– 1998, Meteor Research Memorandum, Maastricht University, RM/01/018.
Bos, J.W.B., Schmiedel, H., (2003). Comparing efficiency in European banking: A metafrontier approach, Netherlands Central Bank Research Series Supervision 57.
Bos, J. WB et MILLONE, M. (2015). Practice what you preach: Microfinance business models and operational efficiency », World Development, vol. 70, p. 28-42.
Blanco-Oliver, A., Irimia-Dieguez, A., & Reguera-Alvarado, N. (2016). Prediction-oriented PLS path modeling in microfinance research. Journal of Business Research, 69(10), 4643-4649.
Bravo-Ureta, B. E., Solís, D., López, V. H. M., Maripani, J. F., Thiam, A., & Rivas, T. (2007). Technical efficiency in farming: a meta-regression analysis. Journal of
productivity Analysis, 27(1), 57-72.
Brons, M., Nijkamp, P., Pels, E., & Rietveld, P. (2005). Efficiency of urban public transit: A meta analysis. Transportation, 32(1), 1-21.
Caudill Gropper, D. M. and Hartarska, V., S. B. (2009). Which microfinance institutions are becoming more cost effective with time? Evidence from a mixture model », Journal of
Money, Credit and Banking, 41(4).
Cazals, C., Florens, J. P., Simar, L. (2002), « Nonparametric frontier estimation: A robust approach », Journal of Econometrics, 106(1), 1–25.
Charmes, A., Cooper, W., Rhodes, E. (1978), « Measuring the efficiency of decision making units »,
European Journal of Econometrics, 106, 1-25.
Cornée, S., & Thenet, G. (2017). Efficience des institutions de microfinance en Bolivie et au Pérou : une approche data envelopment analysis en deux étapes. Finance Contrôle
Stratégie, 19-1.
Daraio, C., Simar, L. (2005). ntroducing environmental variables in nonparametric frontier models: a probabilistic approach. J. Prod. Anal. 24, 93–121.
Desrochers, M., & Lamberte, M. (2003). Efficiency and Expense Preference in Philippines' Cooperative Rural Banks. Papers.ssrn.com
D’Espallier, B. D., Goedecke, J., Hudon, M., & Mersland, R. O. Y. (2017). From NGOs to Banks: Does Institutional Transformation Alter the Business Model of Microfinance.
World Development, 89, pp. 19–33.
Dorfleitner, G., Röhe, M., Renier, N. (2016). The access of microfinance institutions to debt capital: An empirical investigation of microfinance investment vehicles. The
Dupas, P., Robinson, J., (2013). Savings constraints and microenterprise development: evidence from a field experiment in Kenya. Am. Econ. J. Appl. Econ. 5 (1), 163-192. Farell, M., (1957). The measurement of productive efficiency. Journal of the Royal statistical
Society, Series A 120: 195-211.
Ferdousi, F. (2013). Performance of Microfinance Institutions in Asia: DEA based Efficiency Analysis. Proceedings of the 2013 International Conference on the Modern Development of Humanities and Social Science, (Mdhss), 91–94.
Gueyie, J.-P., Kamdjoug, J. R. K., & Nishimikijimana, E. (2010). Efficience des institutions de microfinance regroupées en réseau: cas des mutuelles communautaires de croissance du Cameroun », La Revue Des Sciences de Gestion Direction et Gestion, 45(243/244), 103–109.
Gutiérrez-Nieto, B., Serrano-Cinca, C., & Mar Molinero, C. (2007). Microfinance institutions and efficiency. Omega, 35(2), 131–142.
Gutiérrez-Nieto, B., Serrano-Cinca, C., & Mar Molinero, C. (2009). Social efficiency in microfinance institutions. Journal of the Operational Research Society, 60(1), 104–119. Greene, W., 1997. Econometric Analysis, third ed. Prentice Hall International, New Jersey Haq, M., Skully, M., & Pathan, S. (2010). Efficiency of microfinance institutions: A data
envelopment analysis, Asia-Pacific Financial Markets, 17(1), 63–97.
Hartarska, V., Shen, X., & Mersland, R. (2013). Scale economies and input price elasticities in microfinance institutions. Journal of Banking and Finance, 37(1), 118–131.
Hassan, K., Sanchez, B. (2009). Efficiency analysis of microfinance institutions in developing countries. Working paper no 12. Network Financial Institute. Indiana State University.
Hermes, N., Lensink, R., Meesters, A. (2009). Financial development and the efficiency of microfinance institutions. SSRN Electronic Journal, 1–29.
Hermes, N., Lensink, R., Meesters, A. (2011). Outreach and Efficiency of Microfinance Institutions. World Development, 39(6), 938–948.
Hudon, M., Bakenhol, B. (2011). Efficiency », in B. Armendariz et M. Labie (éds.), The
Handbook of Microfinance. World Scientific Publishing.
Jayamaha, A. (2012). Efficiency of Small Financial Institutions in Sri Lanka using Data Envelopment Analysis. Journal of Emerging Trends in Economics and Management
Sciences, 3(5), 565–573.
Kablan S. (2012). Efficacité des institutions de microfinance en UEMOA : une approche outreach-intermediation financière. Document de Travail.
Khandker, S., 2001. Does Microfinance Really Benefit the Poor? Evidence from Bangladesh. Paper Presented at Asia and Pacific Forum on Poverty: Reforming Policies and
Institutions for Poverty Reduction. Asian Development Bank, Manila.
Kipesha, E. (2012). Efficiency of Microfinance Institutions in East Africa: A Data
Envelopment Analysis. European Journal of Business and Management, 4(17), 77–88. Kipesha, E.. (2013). Production and Intermediation Efficiency of Microfinance Institutions in
Leibenstein, H. (1966). Allocative Efficiency vs. "X-Efficiency". The American Economic
Review, Vol. LVI., June.
Lebovics, M., Hermes, N., Hudon, M. (2016). Are Financial and Social Efficiency Mutually Exclusive? a Case Study of Vietnamese Microfinance Institutions. Annals of Public and
Cooperative Economics, 87(1), 55–77.
Lensink, R., Meestes, A. (2014). Institutions and bank performance: A stochastic frontier analysis. Oxford Bulletin of Economics and Statistics, 76(1), 67-92.
Masood, T., & Ahmad, M. (2010). Technical efficiency of microfinance institutions in india-a stochastic frontier approach. papers.ssrn.com
Mersland, R., Strom, R.Ø. (2010). Microfinance Mission Drift? World Development, vol. 38, n° 1, p. 28-36
Mersland, R., Strom, R.Ø. (2009). Performance and Governance in Microfinance Institutions.
Journal of Banking and Finance, vol. 33, n° 4, p. 662-669
Mia, M. A., Ben Soltane, B. I. (2016). Productivity and its determinants in microfinance institutions (MFIs): Evidence from South Asian countries. Economic Analysis and
Policy, 51, 32–45.
Mor, S. (2016). Transaction Cost and Technical Efficiency : The Case of Indian Microfinance Institutions. Working paper.
Moreira López, V. H., & Bravo-Ureta, B. E. (2009). A study of dairy farm technical efficiency using meta-regression: An international perspective. Chilean journal of
Nghiem, H., Coelli, T., & Rao, P. (2006). The efficiency of microfinance in Vietnam: Evidence from NGO schemes in the north and the central regions. International Journal
of Environmental, Cultural, Economic and Social Sustainability, 2(5), 71-78.
Nguyen, K. H., & Coelli, T. (2009). Quantifying the effects of modelling choices on hospital
efficiency measures: a meta-regression analysis (No. WP072009). School of Economics,
University of Queensland, Australia.
Nzongang, J., Piot-Lepetit, I., & Kamdem, D. (2012). La mesure de l'efficacité financière et sociale des institutions de microfinance du réseau MC² au Cameroun. Mondes en
développement, (4), 99-116.
Odeck, J., & Bråthen, S. (2012). A meta-analysis of DEA and SFA studies of the technical efficiency of seaports: A comparison of fixed and random-effects regression models.
Transportation Research Part A: Policy and Practice, 46(10), 1574-1585.
Ogundari K. (2009). A meta-analysis of technical efficiency in Nigerian agriculture. In
International Association of Agricultural Economists Conference, Beijing, China, August
(pp. 16-22).
Ogundari, K., & Brümmer, B. (2011). Estimating Technical Efficiency, Input substitution and complementary effects using Output Distance Function: A study of Cassava production in Nigeria. Agricultural Economics Review, 12(2), 62.
Oteng-Abayie, E. F., Amanor, K., & Frimpong, J. M. (2011). The measurement and determinants of economic efficiency of microfinance institutions in Ghana: A stochastic frontier approach. African Review of Economics and Finance, 2(2), 149-166.
Piot-Lepetit, I., & Nzongang, J. (2014). Financial sustainability and poverty outreach within a network of village banks in Cameroon: A multi-DEA approach. European Journal of
Operational Research, 234(1), 319-330.
Pitt, M. M., & Khandker, S. R. (1996). Household and intrahousehold impact of the Grameen
Bank and similar targeted credit programs in Bangladesh (No. 320). World Bank.
Quayes, S., & Khalily, B. (2013). Efficiency of microfinance institutions in Bangladesh.
Economics Bulletin, 34 (3), 1512-1521.
Qayyum, A., & Ahmad, M. (2006). Efficiency and sustainability of micro finance. mpra.ub.uni-muenchen.de
Riaz, M., & Gopal, P. S. (2015). In competency Aspects of Microfinance Industry: Via SFA approach. Journal of Economics and Behavioral Studies, 7(1), 1.
Sealey, C. W., & Lindley, J. T. (1977). Inputs, outputs, and a theory of production and cost at depository financial institutions. The Journal of Finance, 32(4), 1251-1266.
Segun, K. R. S., & Anjugam, M. (2013). Measuring the Efficiency of Sub-Saharan Africa's Microfinance Institutions and its Drivers. Annals of Public and Cooperative Economics,
84(4), 399-422.
Servin, R., Lensink, R., & Van den Berg, M. (2012). Ownership and technical efficiency of microfinance institutions: Empirical evidence from Latin America. Journal of Banking &
Finance, 36(7), 2136-2144.
Simar, L., & Wilson, P. W. (2007). Estimation and inference in two-stage, semi-parametric models of production processes. Journal of Econometrics, 136(1), 31-64.
Singh, S., Goyal, S. K., & Sharma, S. K. (2013). Technical efficiency and its determinants in microfinance institutions in India: a firm level analysis. Journal of Innovation Economics
& Management, (1), 15-31.
Singh, Th., R. (2014). A Study of the Efficiency of Microfinance Institutions Using Data Envelopment Analysis. Management, 4 (11), ISSN - 2249-555
Tahir, I. M., & Tahrim, S. N. C. (2015). Efficiency and productivity analysis of microfinance institutions in Cambodia: A DEA approach. International Review of Business Research
Papers, 11(1), 25-42.
Tahir, I. M., & Tahrim, S. N. C. (2013). Efficiency Analysis of Microfinance Institutions in ASEAN: A DEA Approach. Business Management Dynamics, 3(4), 13-23.
Thiam, A., Bravo-Ureta, B. E., & Rivas, T. E. (2001). Technical efficiency in developing country agriculture: a meta-analysis. Agricultural Economics, 25(2-3), 235-243.
Van Damme, P., Wijesiri, M., & Meoli, M. (2016). Governance and Efficiency of Microfinance Institutions Empirical Evidence from Sri Lanka. South Asia Economic
Journal, 1391561416650102.
Widiarto, I., & Emrouznejad, A. (2015). Social and financial efficiency of Islamic microfinance institutions: A data envelopment analysis application. Socio-Economic Planning
Sciences, 50, 1-17.
Wijesiri, M., Viganò, L., & Meoli, M. (2015). Efficiency of microfinance institutions in Sri Lanka: A two-stage double bootstrap DEA approach. Economic Modelling, 47, 74-83.
Wijesiri, M., & Meoli, M. (2015). Productivity change of microfinance institutions in Kenya: A bootstrap Malmquist approach. Journal of Retailing and Consumer Services, 25, 115-121.