HAL Id: hal-01586442
https://hal.archives-ouvertes.fr/hal-01586442
Submitted on 12 Sep 2017
HAL is a multi-disciplinary open access
archive for the deposit and dissemination of
sci-entific research documents, whether they are
pub-lished or not. The documents may come from
teaching and research institutions in France or
abroad, or from public or private research centers.
L’archive ouverte pluridisciplinaire HAL, est
destinée au dépôt et à la diffusion de documents
scientifiques de niveau recherche, publiés ou non,
émanant des établissements d’enseignement et de
recherche français ou étrangers, des laboratoires
publics ou privés.
Distributed under a Creative Commons Attribution - NonCommercial| 4.0 International
License
Link between Affinity and Cu(II) Binding Sites to
Amyloid-β Peptides Evaluated by a New Water-Soluble
UV–Visible Ratiometric Dye with a Moderate Cu(II)
Affinity
Amandine Conte-Daban, Valentina Borghesani, Stéphanie Sayen, Emmanuel
Guillon, Yves Journaux, Geoffrey Gontard, Laurent Lisnard, Christelle Hureau
To cite this version:
Amandine Conte-Daban, Valentina Borghesani, Stéphanie Sayen, Emmanuel Guillon, Yves
Jour-naux, et al.. Link between Affinity and Cu(II) Binding Sites to Amyloid-β Peptides Evaluated by a
New Water-Soluble UV–Visible Ratiometric Dye with a Moderate Cu(II) Affinity. Analytical
Chem-istry, American Chemical Society, 2017, 89 (3), pp.2155-2162. �10.1021/acs.analchem.6b04979�.
�hal-01586442�
1
Link Between Affinity and Cu(II) Binding Sites to Amyloid-
Pep-tides Evaluated by a New Water-Soluble UV-Visible Ratiometric Dye
with a Moderate Cu(II) Affinity
Amandine Conte-Daban,
a,b‡Valentina Borghesani,
a,b‡Stéphanie Sayen,
cEmmanuel Guillon,
cYves
Journaux,
d,eGeoffrey Gontard,
d,eLaurent Lisnard
d,eand Christelle Hureau
a,b,*a,b
CNRS; LCC (Laboratoire de Chimie de Coordination) ; 205, route de Narbonne, F-31077 Toulouse, France. Université de Toulouse; UPS, INPT ; LCC ; F-31077 Toulouse, France
c
Université de Reims Champagne Ardenne, Institut de Chimie Moléculaire de Reims (ICMR), UMR 7312 CNRS-URCA, Moulin de la Housse, BP 1039, 51687 Reims Cedex 2, France
d
Sorbonne Universités, UPMC Univ. Paris 06, UMR 8232, IPCM, F-75005, Paris, France
e CNRS, UMR 8232, Institut Parisien de Chimie Moléculaire, F-75005, Paris, France
ABSTRACT: Being able to easily determine the Cu(II) affinity for biomolecules of moderate affinity is important. Such
biomole-cules include amyloidogenic peptides, such as the well-known amyloid-β peptide involved in Alzheimer’s disease. Here, we report the synthesis of a new water soluble ratiometric Cu(II) dye with a moderate affinity (109 M-1 at pH 7.1) and the characterizations of the Cu(II) corresponding complex by X-ray crystallography, EPR and XAS spectroscopic methods. UV-Vis competition were performed on the Aβ peptide as well as on a wide series of modified peptides, leading to an affinity value of 1.6 109 M-1 at pH 7.1 for the Aβ peptide and to a coordination model for the Cu(II) site within the Aβ peptide that agrees with the one mostly accepted currently.
Copper ions play key biological roles.1 They are essential metal ions that play an important role as catalytic centers in several processes including very fundamental ones like energy production.1 They have also been linked to several diseases. Dyshomeostasis of Cu is very dangerous and is well docu-mented by two lethal genetic diseases, called Wilson's and Menkes' diseases, linked to an overload of Cu and to a deple-tion of Cu, respectively.2-5 Cu imbalance has also been in-volved in the etiology of most of neurological disorders6 such as Alzheimer's disease (AD),7-9 Parkinson's disease (PD),10,11 Prion diseases.10,12
At a molecular scale, two parameters are important regard-ing Cu and the peptides or proteins involved in the above-mentioned diseases: (i) the metal environment, i.e. the nature of the atoms surrounding the metal center and (ii) the affinity of the peptides for the metal center. In the context of AD which is under focus in the present article, there are many reports on the coordination sites of the Cu(II) center to the amyloid-β peptide (Aβ) (for recent reviews, see refs.8,13-15) and on the Cu(II) affinity for Aβ (see refs.16-18 and refs. therein). Some studies also aim at relating the Cu(II) affinity of modi-fied Aβ peptides with the coordination sites.19-21
Determining the affinity of Cu(II) for peptides is thus of in-terest, first because this is intrinsically an important parameter that mirrors the possibility to have the metal ion-peptide inter-action in biological conditions, and second because it give
insights into the coordination sphere of the metal center when a series of modified peptides is studied. As a direct conse-quence, the straightforward and accurate determination of Cu affinity for peptides is an important objective. However, this is an intricate task since it necessitates appropriate analytical tools. The complexity of such studies is well illustrated by the abundant and differing reports on the evaluation of Cu(II) affinities for the A peptide (see refs.16-20 and refs. therein). This is also true for the +I redox state of Cu,18,22-24 which is however not under focus in the present study. While Cu(II) affinity values ranging from 106 M-1 to 1019 M-1 have been proposed,25 a relative consensus has recently been reached around a value of 1010 M-1 at pH 7.417,18 (this value corre-sponds to the conditional affinity value, i.e. the absolute affini-ty value at a given pH ; the interaction with buffer is not con-sidered and will lead to a weaker so-called apparent affinity value).25 Hence the objective of the present study is to define a new tool appropriate for the rapid, easy and accurate evalua-tion of Cu(II) binding affinities to peptides.
There are mainly two ways of determining affinity values.16 The first one relies on potentiometric titrations that lead to absolute constants, from which an apparent affinity value can be calculated at any pH values.16,26 The second one consists in measurements at a given pH either by (i) isothermal calorimetry (ITC), fluorescence when a fluorophore is natively present in the peptide sequence or added for purpose and when
2
the fluorescence is quenched by the addition of the metal ion of interest or (ii) by competition experiments with a ligand of known affinity followed by the appropriate method. Potentiometry is likely the most powerful technique since it gives access to the affinity value at any pH values but could be extremely difficult to implement in case of biomolecules and requires important quantity of the biological material. Results from ITC are far from straightforward although additional data apart from the affinity can be evaluated (enthalpy, entropy...) (reviewed in ref. 16). Competition experiments appear to be a well-suited method. With respect to Cu(II), UV-Vis and fluo-rescent spectroscopic tools are of interest. In a seminal paper, Wedd and coworkers have designed four peptide-based fluorophores of various Cu(II) affinities ranging from 108 M-1 to 1014 M-1. They were further used to probe the affinity of Cu(II) for different peptides and proteins by competition monitored by fluorescence.27 While Cu(II) quenches the fluo-rescence of the competitor, the addition of the peptide of inter-est rinter-estores it, removing the Cu(II) from the probe.
In the present paper, we propose an alternative strategy that relies on a UV-visible competition experiment against an easy to synthesize Cu(II) dye with moderate affinity (3.2 109 M-1 at pH 7.1) that is anticipated to be perfectly appropriate for eval-uation of Cu(II) affinity to weakly structured peptide, such as A, at physiological pH. By UV-Vis, the addition of the pep-tide of interest on the colored Cu(II) complex induces the disappearance of the absorption bands.
Using this new dye, we have investigated more than seven-teen peptidic sequences derived from the human A peptide, including murine, N-terminally modified peptides and biologi-cally relevant mutants. Their Cu(II) affinities were evaluated and discuss with respect to the coordination models previously proposed in the literature.13,21,28-30
EXPERIMENTAL SECTION
Chemicals. Reagents were commercially available and
were used as received. All the solutions were prepared in milliQ water (resistance: 18.2 MΩ.cm).
The Cu(II) ion source was CuSO4.5H2O, bought from
Sig-ma-Aldrich. A stock solution was prepared at 25 mM. HEPES buffer (sodium salt of 2-[4-(2-hydroxyethyl)piperazin-1-yl]ethanesulfonic acid) was bought from Sigma-Aldrich. A stock solution was prepared at 500 mM, pH = 7.3 in order to reach a resulting pH 7.1 and the same buffer stock solution was used over the course of the present study.
Peptides. Aβ16 (DAEFRHDSGYEVHHQK) and the
mu-tants:
Ac-Aβ16, Ac-DAEFRHDSGYEVHHQK; D1N-Aβ16,
NAEF-RHDSGYEVHHQK; E3Q-Aβ16,
DAQFRHDSGYEVHHQK; D7N-Aβ16,
DAEFRHNSGYEVHHQK; E11Q-Aβ16,
DAEFR-HDSGYQVHHQK; H6R-Aβ16, DAEFRRDSGYEVHHQK;
H6A-Aβ16, DAEFRADSGYEVHHQK; H13A-Aβ16,
DAEFR-HDSGYEVAHQK; H14A-Aβ16, DAEFRHDSGYEVHAQK;
mAβ16, DAEFGHDSGFEVRHQK; R5G-Aβ16,
DAEFGHD-SGYEVHHQK; Y10F-Aβ16, DAEFRHDSGFEVHHQK;
H13R-Aβ16, DAEFRHDSGYEVRHQK; R5G-H13R-Aβ16,
DAEFGHDSGYEVRHQK; Aβ28,
DAEFRHDSGYEVHHQK-LVFFAEDVGSNK; Aβ40,
DAEFRHDSGYEVHHQK-LVFFAEDVGSNKGAILGLMVGGVV were bought from GeneCust (Dudelange, Luxembourg) with purity grade > 95 %.
Stock solutions of the peptides were prepared by dissolving powder in milliQ water (resulting pH ~ 2), except for the Aβ28
and Aβ40 peptides which were dissolved in NaOH 50 mM.
Peptide concentration was determined by UV-Vis absorption of Tyr10 considered as free tyrosine (at pH ~ 2.0, ε276 - ε296 =
1410 cm-1.M-1; at pH ~ 12.5, ε293 – ε360 = 2400 cm -1
.M-1).31 For the mutants without Tyr10, the absorption of the two Phe was used (ε258 – ε280 = 390 cm
-1
.M-1).32
As the Cu(II) coordination sites in the Aβ peptide are local-ized in the first 16 amino acids residues,8 the Aβ16 and its
counterparts were used as a model of the full-length peptides. ABH and BAH where B corresponds to the β-alanine were bought from Protéogenix (Strasbourg, France) and stock solu-tions were prepared by solubilizing the peptides in milliQ water. Their concentrations were determined by UV-Vis titra-tion with a titrated Cu(II) solutitra-tion following the d-d band absorption of the complex,33 according to ref. 34.
Ligand. The 3,4-bis(oxamato)benzoic acid ligand, L (see Scheme S1), was synthetized as described below and used in its sodium salt form. A 8.5 mM stock solution was prepared, increasing the pH until solubilization, determined by UV-Vis titration with a titrated Cu(II) solution following the band absorption at 330 nm of the complex (see text below and Fig-ure 3), according to ref. 34.
Synthesis of H5L.
H3Et2L: 3,4-(diethyloxamate)benzoic acid:
The ester form of the L ligand was prepared following the known procedure for oxamate ligands35,36 instead of the previ-ously reported synthesis.37 To 5 g of 3,4-diaminobenzoic acid (32.8 mmol) in THF (200 mL) is added with strong stirring 8.25 mL of ethyl oxalyl chloride (72 mmol, 2.2 eq). The mix-ture is refluxed for 2 hours, filtered while hot and let to cool down to room temperature. Removal of the solvent leads to a brown precipitate. The solid is abundantly washed with water, filtered, washed with 50 % v. ethanol and then with a mini-mum of cold 96 % v. ethanol, and dried in air. Yield: 8.9 g (77 %). See Supporting Info for elemental analysis, NMR and IR characterizations.
Na1.5H3.5L·2.2H2O
Aqueous NaOH (2 M, 57 mL) was added dropwise to a sus-pension of H3Et2L (8 g, 22.7 mmol) in water (400 mL). The
solution was stirred for 30 min and filtered. Addition of 4 M HCl (28 mL) to the resulting solution leads to the rapid for-mation of a brown precipitate. After 10 min the precipitate is collected on a sintered glass filter, washed with cold water, then with 96 % v. EtOH, and finally with ether before being dried for several hours in air and overnight at 45°C in an oven. Yield: 5.4 g (64%). See Supporting Info for elemental analy-sis, NMR and IR characterizations.
Synthesis of Li3[Cu(L)]
Suitable crystals of the copper dye, Cu(L), were obtained as follow: A suspension of H3Et2L (0.100 g, 0.28 mmol) in water
3
and stirred at room temperature until complete dissolution of the ligand. An aqueous solution of Cu(NO3)2·3H2O (0.068 g,
0.28 mmol, 5 mL) was then added dropwise to the oxamate solution resulting in a deep blue solution of the copper com-plex that was stirred for 30 min at room temperature and fil-tered. Slow diffusion of acetone yields crystals of Li3[Cu(L)]·5.5H2O in 15 days. Yield: 0.054 g (41 % based on
Cu). See Supporting Info for elemental analysis, NMR and IR characterizations.
METHODS
X-Ray structure. Crystallographic data were collected on a Bruker Kappa-APEX II CCD diffractometer (CuK, λ = 1,54178). Crystal data: purple plates, monoclinic C2/c, a = 26.3214(15), b = 6.7217(4), c = 20.4183(11) Å, = 112.590(3)°, V = 3335.3(3) Å3, Z = 8, T = 200(1) K, ρ = 1.567 g.cm-3, F(000) = 1560, μCuK = 2.293 mm-1. Crystals were mounted on a Hamilton cryoloop using Paratone-N oil and placed in the cold flow produced with an Oxford Cryocooling device. Partial hemispheres of data –preselected with the APEX II software38 were collected using and scans. Inte-grated intensities were obtained with SAINT+ and were cor-rected for absorption with SADABS;38,39 the structure was solved with SIR9240 and refined with SHELXL-2014/741 (WinGX software package).42 Data refinement gives (using 271 parameters and 6 restraints) wR2 = 0.2432 (2923 unique reflections), R1 = 0.0720 (2514 reflections with I>2σ(I)), GOF
= 1.128. Crystallographic details are available in CIF format, free of charge via www.ccdc.cam.ac.uk/conts/retrieving.html (or from the Cambridge Crystallographic Data Centre, 12, Union Road, Cambridge CB2 1EZ, UK; fax: (+44) 1223-336-033; or deposit@ccdc.cam.ac.uk). CCDC number 1516020.
NMR, IR and Elemental Analysis. 1
H and 13C NMR spectra were collected on a 400 MHz Bruker Avance spec-trometer at 298 K.
ATR/FT-IR spectra were collected on a Bruker TENSOR 27 equipped with a simple reflexion ATR diamond plate of the Harrick MPV2 series.
Elemental analysis was performed at the ICSN, CNRS UPR 2301, in Gif-sur-Yvette, France.
Electron Paramagnetic Resonance. Electron
Para-magnetic Resonance (EPR) data were recorded using an Elexsys E 500 Bruker spectrometer, operating at a microwave frequency of approximately 9.5 GHz. Spectra were recorded using a microwave power of 20 mW across a sweep width of 150 mT (centred at 310 mT) with modulation amplitude of 0.5 mT. Experiments were carried out at 110 K using a liquid nitrogen cryostat.
EPR samples were prepared from stock solution of ligand diluted down to 0.2 mM in H2O. 0.9 eq. of
65
Cu(II) was added from 25 mM 65Cu(NO3)2 stock solution home-made from a 65
Cu foil. Samples were frozen in quartz tube after addition of 10% glycerol as a cryoprotectant and stored in liquid nitrogen until used.
X-ray Absorption Spectroscopy (XAS). Cu(II)
K-edge EXAFS (Extended X-Ray Absorption Fine Structure) and XANES (X-ray Absorption Near–Edge Structure) spectra were recorded at the BM30B (FAME) beamline at the
Euro-pean Synchrotron Radiation Facility (ESRF, Grenoble, France).43 The storage ring was operated in 7/8+1 mode at 6 GeV with a 200 mA current. The beam energy was selected using a Si(220) N2 cryo-cooled double-crystal monochromator
with an experimental resolution close to that theoretically predicted (namely ~ 0.5 eV FWHM at the Cu energy). The beam spot on the sample was approximately 300 x 100 µm2 (H x V, FWHM). Because of the low Cu(II) concentration, spec-tra were recorded in fluorescence mode with a 30-element solid state Ge detector (Canberra) in frozen liquid cells in a He cryostat. The temperature was kept at 20 K during data collec-tion. The energy was calibrated with Cu metallic foil, such that the maximum of the first derivative was set at 8979 eV. EXAFS Cu(II) data were collected from 8840 to 8960 eV using 5 eV step of 2 s, from 8960 to 9020 eV using 0.5 eV step of 3 s, and from 9020 to 9300 eV with a k-step of 0.05 Å-1 and 3 s per step. At least six scans recorded on different spots were averaged. XAS samples were prepared from stock solu-tions of ligand and Cu(II) diluted down to approx. 1.0 mM in buffered solution. Samples were frozen in the sample holder after addition of 10% glycerol as a cryoprotectant and stored in liquid nitrogen until used. Cu(II) photoreduction was con-trolled by recording successive scans at the same spot. It was considered that during the first 20 minutes of recording the photoreduction is insignificant.
The data analysis was performed using the ‘‘Multi-Plateform Applications for X-ray Absorption’’ package, in-cluding Cherokee and Roundmidnight programs,44 according to the standard and previously reported data analysis proce-dures.45,46 Spectra were background-corrected by a linear regression through the pre-edge region and a polynomial through the post-edge region. The backscattering phase, Φi(k,
Ri), and amplitude, Ai(k, Ri), functions were obtained using
the ab initio FEFF7 code.47 Since theoretical phase shifts were used, it is necessary to fit the energy threshold E0 by adding an
extra fitting parameter, ΔE0. Moreover, the FEFF7 code was
used to check if the multiple scattering of our reference com-pounds of known crystallographic structure is negligible in the 0–3 Å range. The estimated errors for distances and coordina-tion numbers are ± 0.02 Å and ± 20%, respectively.
UV-Visible spectrophotometry. UV-vis spectra were recorded on a spectrophotometer SPECORD S600 Analytik Jena at 25°C in 1 cm path length quartz cuvette.
Competition experiments between the ligand and the pep-tides
The experiments have been monitored by UV-Vis in HEPES buffer 0.1 M (at a resulting pH = 7.1). The ligand (50 µM in theory) and Cu(II) (45 µM in theory) were mixed and successive additions of the different peptides (0 to 500 µM in total) were added. Each addition of the peptide is made once the thermodynamic equilibrium of the previous reaction is reached (this takes about 20 min). To be reproducible with respect to pH condition, the same stock buffer solution (pH = 7.3 to reach a resulting pH of 7.1) was used for all the experi-ments. The competition experiments were performed at 25°C in triplicate.
Analysis of the data
The data analysis was performed with a 2-step procedure for each experiment (corresponding to a given peptide).
4
Step 1. The theoretical concentrations of the ligand L and
the Cu(II) were adjusted using the absorbance of ligand at 246 nm (ε246 - ε450 = 18000 cm
-1
.M-1) and the absorbance of the Cu(L) complex at 330 nm (ε330 - ε450 = 18000 cm
-1
.M-1) respec-tively.
Step 2. The absorbance of the competition experiments
measured at 330 nm after completion of the reaction was plot-ted as a function of the number of peptides equivalents recal-culated with respect to the real ligand concentration (see step 1). Then these data were fitted with an in-house procedure using the adjusted concentrations as starting parameters.
Absorbance was calculated according to:
where P stands for peptide, L for the ligand, and CuP and CuL for the complex between Cu(II) and peptide and the lig-and, respectively.
The same equation can be expressed as:
where α stands for the progression of the following reaction : peptide + Cu(II) peptide-Cu(II)
and the [ ]0 correspond to the starting values in which the
dilution due to addition of the peptide has been taken into account when required.
Cu(II) is supposed to be chelated by the peptide or by L, there is no free Cu(II).
With the starting concentrations:
This is a quadratic equation having the form
, with
, with
Then, the value was adjusted to obtain the best
repro-duction of the experimental data.
NB: Although / are dimensionless values, they are given here in M or M-1, respectively, for convenience. Indeed for 1:1 system, the value in M gives a direct idea at which concentration the complex is predominantly formed.
NB: in a preliminary experiment, was evaluated by competition with ABH and BAH knowing and
33
with the similar procedure.
RESULTS
The competitor used in the present work to evaluate the Cu(II) affinity of a wide series of Aβ derived peptides by UV-Vis competition experiments, is an oxamate ligand (H5L,
Scheme S1, for the sake of clarity L5- will be written L. Simi-larly, the [Cu(L)]3- will be noted Cu(L)). Oxamate ligands have largely proved their appeal for the design of metalloligands and the subsequent preparation of multidimen-sional compounds with controlled architectures and proper-ties.48 In particular, the use of oxamate ligands and the multi-step assembly of oxamate-based complexes have successfully led to relevant objects in molecular magnetism: switchable molecules, high nuclearity coordination complexes, single-chain magnets, porous magnets.49,50 Recently oxamate-based systems have also shown attractiveness in broader coordina-tion chemistry fields such as catalysis.51,52Here, we will take advantage of the mild Cu(II) affinity and of the presence of an intense UV-Visible band for the complex with Cu(II) (λ = 330 nm, = 18000 cm-1.M-1).
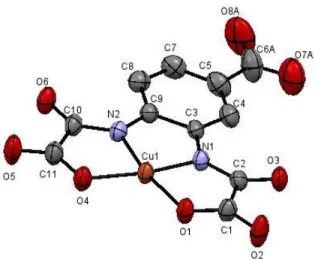
The X-ray structure of Cu(L) is shown in Figure 1 and the crystallographic parameters are given in Table 1, top, and in the Supporting Info. The complex adopts a square-planar geometry where the L ligand coordinates the Cu(II) ion via its two oxamate groups each binding the metal center through one nitrogen and one oxygen atom. The square-planar geometry is fairly regular with a 2.4° dihedral angle between the oxamate groups and a 3.1° dihedral angle between the Cu(II) coordina-tion plane and the phenyl plane of the ligand. The carboxylate group of the ligand remains uncoordinated. Supramolecular arrangements of the complexes are described in the Supporting Information (Figure S1).
5
Figure 1. Ellipsoid plot (H and disorders atoms are omitted for
clarity) of Cu(L).
The persistence of the structure in aqueous solution has been probed by several complementary techniques. The most appropriate one is EXAFS by which the Cu-N and Cu-O dis-tances have been determined in solution and are in perfect agreement with those obtained for the crystal structure (for crystallography, see Table 1, bottom and Figure S1, for EXAFS fitting, see Figure S2).
Table 1. Crystallography distances between Cu(II) and their neighbours (top) and EXAFS parameters (bottom): N = number of neighbours, R = absorber-neighbour distance, σ = Debye-Waller factor. N Distance (Å) Cu-N1 1.9061(55) Cu-N2 1.9127(37) Cu-O1 1.9588(34) Cu-O4 1.9642(51) N Distance (Å) 2 Cu-N 1.92 2 Cu-O 1.97 σ2 (Å-2 ) R factor 0.00471 0.18 %
The parameters estimated from the EPR signature (Figure 2A) are also in line with the Cu(L) solid-state structure. In-deed, the g// and A//(
65
Cu) values equal 2.22 and 212 104 cm-1, respectively and are thus in line with a 2N2O equatorial bind-ing mode accordbind-ing to the Peisach and Blumberg correlation.53 A weak rhombicity linked to the presence of four non equiva-lent equatorial ligands is at the origin of the complex features observed in the g region (coupling between ICu = 3/2 with SCu
= 1/2 for the two gx and gy transitions). The presence of two
equivalent nitrogen atoms is consistent with the five super-hyperfine lines observed on the first parallel transition, arising from the coupling between IN = 1 with SCu = 1/2. The XANES
spectrum of Cu(L) is given in Figure 2B. It is in line with Cu(II) complexes where the Cu(II) center lies in a square planar environment.1
Figure 2. Panel A. EPR signature of Cu(L). [L] = 200 µM,
[65Cu(II)] = 180 µM, [HEPES] = 50 mM, pH = 7.1, T = 120 K. Inset: superhyperfine structure on the first parallel line. Panel B. Normalized Cu K-edge X-ray Absorption Near –Edge Structure (XANES) spectrum of Cu(L). [L] = 1 mM, [Cu(II)] = 0.9 mM, [HEPES] = 0.1 M, pH = 7.0, T = 20K.
The other important parameter of this ligand is its affinity constant for Cu(II). This affinity was evaluated by the same type of competition experiments than those detailed below, performed first between L and two short peptides, namely ABH and BAH (B stands for β-alanine).33
These peptides were studied by potentiometry to determine the impact of the 5-membered versus 6-5-membered metallacycles with regard to the Cu(II) affinity in an ATCUN-like (Amino Terminal CU and Nickel) sites.54 Their conditional Cu(II) affinity values calculated at pH 7.1 from the potentiometric data equal: 3.0 108 and 3.7 109 M-1, respectively. Competition experiments with the ABH (resp. BAH) lead to a Cu(II) affinity value of 2.2 109 M-1 (resp. 4.1 109 M-1) for L. The average value of = 3.2 ± 1.0 109 M-1 was used in the rest of the study.
The competition experiment between L and the Aβ peptides for Cu(II) binding were performed by using the peptides to remove the Cu(II) from the colored Cu(L) complex leading to a disappearance of the signature at 330 nm characteristic of the Cu(L) complex. Figure 3A shows the typical series of spectra obtained for a given peptide (here Aβ16). L was first added
(dotted line), then Cu(II) (solid line) and then successive addi-tions of the peptide were performed (grey lines, See Experi-mental Section for more details). Note that the increase at 276 nm is due to Tyr10 absorbance and perfectly matches the amount of peptide added.
Figure 3. Panel A. UV-Vis spectra of a solution of L (dotted line),
in the presence of 0.9 eq. of Cu(II) (solid line) and after addition of increasing amounts (approx.. 1, 3, 7 and 10 eq.) of Aβ16 peptide
6
(grey lines). The arrows indicate the variation of the UV-Vis spectra upon addition of the peptide. The increase at 276 nm is due to Tyr10 absorption. Panel B. Experimental absorbance at 330 nm (dots) and the best fits (dashed lines) of the Cu(L) system upon addition of peptides (Aβ16 (a), H6A-Aβ16 (b) and Ac-Aβ16
(c)). [L] = 50 µM, [Cu(II)] = 45 µM, [peptides] = 0 to 500 µM, [HEPES] = 0.1 M, pH = 7.1, T = 25°C.
The absorbance at = 330 nm of the mixture was plotted as a function of the equivalent numbers of peptide added (dots in Figure 3B). Then, these data were fitted with an in-house procedure (dashed lines, for more details see Experimental section).
Experimental absorbance values and their fits are shown in Figure 3B as a matter of illustration for Aβ16, H6A-Aβ16 and
Ac-Aβ16, (curves a, b, c, respectively). Qualitative analysis
indicates that the Cu(II) affinity of the three peptides follow the trend: Aβ16 > H6A-Aβ16 > Ac-Aβ16. All the Cu(II) affinity
values obtained in the present study are gathered in Table 2 while the corresponding reproductions of the experimental data are given in the Supporting Info (Figure S3). The accura-cy of the fitting procedure is shown in the Figure S4. All the calculated Cu(II) affinity values were normalized with respect to the value of Aβ16 for an easier comparison, as shown in
Table 2 and in Figure 4.
Table 2. Cu(II) affinity values of the Aβ peptides studied here. The reference for the normalization is the Aβ16. A Cu(II) affinity value of 3.2 ± 1.0 109 M-1 for the competing ligand L was taken.
Peptide Ka (109 M-1) a Ka(peptide) / Ka(hAβ16) Aβ16 1.6 1.0 Aβ28 1.8 1.1 Aβ40 2.2 1.4 Ac-Aβ16 b < 0.1 < 0.1 D1N-Aβ16 1.1 0.7 E3Q-Aβ16 1.0 0.6 D7N-Aβ16 1.1 0.7 E11Q-Aβ16 1.3 0.8 H6R-Aβ16 0.3 0.2 H6A-Aβ16 0.3 0.2 H13A-Aβ16 0.9 0.6 H14A-Aβ16 0.8 0.5 mAβ16 3.0 1.9 R5G-Aβ16 3.1 1.9 Y10F-Aβ16 1.2 0.8 H13R-Aβ16 0.7 0.4 R5G-H13R-Aβ16 2.7 1.7 a
The error bars are evaluated in the S.I. (see Figure S4). b The Ka value for Ac-Aβ16 is too weak to be thoroughly determined by
this method. Only a higher value can be given.
DISCUSSION
The Aβ peptides used in this study were modified with re-spect to the human sequence on any potential binding amino-acids, namely the carboxylate containing amino-acid residues, the His residues and the N-terminal amine. The mutation in-volved between the human and murine sequences were also studied.
Figure 4. Bar graph of the normalized affinity constants in log
units of the Aβ peptides and some of their mutants for Cu(II). The reference for the normalization is the hAβ16. The error bars
indi-cate the standard deviation. [L] = 50 µM, [Cu(II)] = 45 µM, [pep-tides] = 0 to 500 µM, [HEPES] = 0.1 M, pH = 7.1, T = 25°C. The affinity constant of the ligand is Ka = 3.2 ± 1.0 10
9
M-1.
Human-derived peptides. The first modification is the
acetylation of the N-terminal amine (Asp1) precluding the possibility of Cu(II) binding. The affinity constant of Cu(II) for this modified peptide is at least 10 times weaker than that of the Aβ16 peptide, in line with an important contribution of
the N-terminal amine in Cu(II) binding to Aβ16, as discussed in
the literature.28,55,56 In the second group of modified peptides, the impact of the carboxylate function is evaluated. The car-boxylate group of each amino acid residues Asp1, Glu3, Asp7 and Glu11 is mutated with an amide function. Only a very weak impact is observed with a decrease in the affinity upon modification that doesn’t exceed a factor of 2. In the Aβ16
there are 4 carboxylate groups available for the Cu(II) coordi-nation. Therefore, if one carboxylate is mutated, 3 other ones remain to complete the coordination sphere. This is in perfect agreement with the possibility of having an equilibrium be-tween the four carboxylate groups for one binding position.57 The high similarity of affinity values for the four carboxylate-modified peptides also suggest that there is no preference for one given carboxylate group. The last group of modified pep-tides consist in the His mutants (His6, His13 and His14). While His6 mutation (H6A or H6R) has a significant impact (a 5-fold decrease of the affinity value), His13 or His14 mutation has a lesser effect (with a maximal 2-fold decrease of the affinity value). This indicates that (i) none of the His is essen-tial but (ii) the His13 and His14 can more easily exchange for the binding position on the peptide than His6 and His13 or than His6 and His14 do. This is in line with the proposition that in the main coordination site His13 and His14 exchange for one binding position while His6 is constantly bound.13,30,58
0,01 0,1 1 10 N o rmal iz ed Ka
7
It is worth mentioning that similar differences have been pre-viously determined by ITC.19,20 All together these data fit very well with the coordination site of Cu(II) proposed based on spectroscopic data (reviewed in refs.13,30) and reminded in Scheme 1. In such proposition, the Cu(II) ion is equatorially bound to the N-terminal amine, the adjacent carbonyl group from the Asp1-Ala2 bond, the imidazole group form His 6 and from His13 or 14 in equilibrium (see Scheme S2, top).8 A carboxylate-containing residue has been proposed to occupy the apical position.57 Last, the Cu(II) affinity seems to weakly increase with the length of the peptide, in line with previous reports,17,59 but this result has to be taken with cautious due to the increase in the error bar when working with the Aβ40
pep-tide. This confirms that the Aβ16 moiety is a good model with
respect to Cu(II) binding site within the full-length peptide.
Scheme 1. Predominant forms at pH 7.1 of the Cu(II) co-ordination with human (left) and murine (right) Aβ pep-tides.
Human versus murine peptides. The murine sequence
differs from the human one by 3 mutations: R5G, Y10F and H13R. With respect to Cu(II) affinity values, the murine pep-tide is twice stronger than the human one, in line with previous measurements by direct competition,17,29 ITC,19 and potentiometry.55 The main mutation responsible for such a difference is the R5G mutation. This has been previously related to the formation of a 6-membered metallacycle be-tween the side chain of His6 and the deprotonated Gly5-His6 peptide function for the murine peptide that is not observed in the human case (see Schemes 1 and S2 bottom).29,30
CONCLUSIONS
In the present study, a new ratiometric dye was synthetized and fully characterized. It was further used to determine the affinity constant of Cu(II) for several Aβ peptides by UV-Vis competition experiments. This was made possible by the in-tense (18000cm-1.M-1) LMCT band displayed at = 330 nm by the Cu(L) complex. The affinity values obtained in this study for the various modified peptides agree perfectly with published coordination sites, thus validating the proposed strategy that relies on the determination of affinity constants of a wide series of modified peptides to extrapolate a coordina-tion model for a given peptide. In addicoordina-tion, the designed dye could be further used to straightforwardly determine Cu(II) affinity for other flexible peptides such as alpha-synuclein involved in Parkinson’s disease11
or Prion protein,12for which the Cu(II) affinities are proposed to lie in the 108-1010 M-1
range. However, outside this range, competition with L will not give reliable values. In addition, the molar extinction coef-ficient is relatively low implying the use of quite large bio-molecule concentration. As a consequence, to generalize this approach to the evaluation of Cu(II) affinity for any other (bio)molecules relies on the ability to modulate the Cu(II) affinities and to increase the molar extinction coefficient of oxaloamino-benzoic acid derivatives by playing with the scaf-fold.
ASSOCIATED CONTENT
Supporting Information
The Supporting Information is available free of charge on the ACS Publications website. Characterization of the ligand and of the Cu(L) complex, EXAFS parameters, Competition data, Error bar, Cu coordination model.
AUTHOR INFORMATION
Corresponding Author:
* E-mail: christelle.hureau@lcc-toulouse.fr.
Author Contributions
‡A.C.D. and V.B. contributed equally to this work.
ACKNOWLEDGEMENTS
CH thanks the ERC aLzINK - Contract n° 638712 for financial support. The authors thank the European Synchrotron Radiation Facility for provision of beamtime (experiment 30-02-1060), the FAME staff for their support, F. Collin, and C. Cheignon for their help in recording the XANES and EXAFS data. Prof. P. Faller is acknowledged for interesting discussions.
REFERENCES
(1) Solomon, E. I.; Heppner, D. E.; Johnston, E. M.; Ginsbach, J. W.; Cirera, J.; Qayyum, M.; Kieber-Emmons, M. T.; Kjaergaard, C. H.; Hadt, R. G.; Tian, L. Chem. Rev. 2014, 114, 3659-3653.
(2) Sarkar, B. Chem. Rev. 1999, 99, 2535-2544. (3) Delangle, P.; Mintz, E. Dalton Trans. 2012, 41.
(4) Lalioti, V.; Muruais, G.; Tsuchiya, Y.; Pulido, D.; Sandoval, I. V. Frontiers Biosciences 2009, 14, 4878-4903.
(5) Scheiber, I. F.; Mercer, J. F. B.; Dringen, R. Prog. Neurobiol. 2014, 116, 33-57.
(6) Kozlowski, H.; Luczkowski, M.; Remelli, M.; Valensin, D. Coord. Chem. Rev. 2012, 256, 2129-2141.
(7) Ayton, S.; Lei, P.; Bush, A. I. Free Radic. Biol. Med. 2013, 62, 76-89. (8) Hureau, C. Coord. Chem. Rev. 2012, 256, 2164-2174.
(9) Barnham, K. J.; Bush, A. I. Chem. Soc. Rev. 2014, 43, 6727-6749. (10) D'Ambrosi, N.; Rossi, L. Neurochem. Int. 2015, 90, 36-45.
(11) Binolfi, A.; Quintanar, L.; Bertoncini, C. W.; Griesinger, C.; Fernández, C. O. Coord. Chem. Rev. 2012, 256, 2188-2201.
(12) Arena, G.; La Mendola, D.; Pappalardo, G.; Sóvágó, I.; Rizzarelli, E. Coord. Chem. Rev. 2012, 256, 2202-2218.
(13) Drew, S. C.; Barnham, K. J. Acc. Chem. Res. 2011, 44, 1146-1155. (14) Faller, P.; Hureau, C.; Berthoumieu, O. Inorg. Chem. 2013, 52, 12193-12206.
(15) Telpoukhovskaia, M. A.; Orvig, C. Chem. Soc. Rev. 2013, 42, 1836-1846.
(16) Zawisza, I.; Rozga, M.; Bal, W. Coord. Chem. Rev. 2012, 256, 2297-2307.
(17) Alies, B.; Renaglia, E.; Rozga, M.; Bal, W.; Faller, P.; Hureau, C. Anal. Chem. 2013, 85, 1501-1508.
8 (18) Young, T. R.; Kirchner, A.; Wedd, A. G.; Xiao, Z. Metallomics 2014,
6, 505-517.
(19) Hong, L.; Carducci, T. M.; Bush, W. D.; Dudzik, C. G.; Millhauser, G. L.; Simon, J. D. J. Phys. Chem. B. 2010, 114, 11261-11271.
(20) Hong, L.; Simon, J. D. Metallomics 2011, 3, 262-266.
(21) Alies, B.; Bijani, C.; Sayen, S.; Guillon, E.; Faller, P.; Hureau, C. Inorg. Chem. 2012, 51, 12988-13000.
(22) Alies, B.; Badei, B.; Faller, P.; Hureau, C. Chem. Eur. J. 2012, 18, 1161-1167.
(23) Feaga, H. A.; Maduka, R. C.; Foster, M. N.; Szalai, V. A. Inorg. Chem. 2011, 50, 1614-1618.
(24) Xiao, Z.; Gottschlich, L.; van der Meulen, R.; Udagedara, S. R.; Wedd, A. G. Metallomics 2013, 5, 501-513.
(25) Faller, P.; Hureau, C. Dalton Trans. 2009, 1080-1094.
(26) Arena, G.; Papppalardo, G.; Sovago, I.; Rizzarelli, E. Coord. Chem. Rev. 2012, 256, 3-12.
(27) Young, T. R.; Wijekoon, C. J. K.; Spyrou, B.; Donnelly, P. S.; Wedd, A. G.; Xiao, Z. Metallomics 2015, 7, 567-578.
(28) Alies, B.; Eury, H.; Bijani, C.; Rechignat, L.; Faller, P.; Hureau, C. Inorg. Chem. 2011, 50, 11192-11201.
(29) Eury, H.; Bijani, C.; Faller, P.; Hureau, C. Angew. Chem., Int. Ed. Engl. 2011, 50, 901-905.
(30) Hureau, C.; Dorlet, P. Coord. Chem. Rev. 2012, 256, 2175-2187. (31) Faller, P.; Hureau, C.; Dorlet, P.; Hellwig, P.; Coppel, Y.; Collin, F.; Alies, B. Coord. Chem. Rev. 2012, 256, 2381-2396.
(32) Fasman, G. D. H. o. B. a. M. B., Proteins, I, 3rd ed., CRC, 1976, p. 183.
(33) Nagaj, J.; Stokowa-Sołtys, K.; Zawisza, I.; Jeżowska-Bojczuk, M.; Bonna, A.; Bal, W. J. Inorg. Biochem. 2013, 119, 85-89.
(34) Hureau, C.; Eury, H.; Guillot, R.; Bijani, C.; Sayen, S.; Solari, P. L.; Guillon, E.; Faller, P.; Dorlet, P. Chem. Eur. J. 2011, 17, 10151-10160. (35) Stumpf, H. O.; Pei, Y.; Kahn, O.; Sletten, J.; Renard, J. P. J. Am. Chem. Soc. 1993, 115, 6738-6745.
(36) Cervera, B.; Sanz, J. L.; Ibanez, M. J.; Vila, G.; Lloret, F.; Julve, M.; Ruiz, R.; Ottenwaelder, X.; Aukauloo, A.; Poussereau, S.; Journaux, Y.; Munoz, M. C. J. Chem. Soc., Dalton Trans. 1998, 5, 781-790.
(37) Paul-Roth, C. O. C. R. Chimie 2005, 8, 1232-1236. (38) Bruker AXS Inc, B. Madison, Wisconsin, USA, 1998.
(39) Blessing, R. H. Acta Crystallogr., Sect. A: Found. Crystallogr. 1995, 51, 33.
(40) Altomare, A.; Cascarano, G.; Giacovazzo, C.; Guagliardi, A.; Burla, M. C.; Polidori, G.; Camalli, M. J. Appl. Crystallogr. 1994, 27, 435. (41) Sheldrick, G. M. Acta Crystallogr., Sect. C: Cryst. Struct. Commun.
2015, 71, 3-8.
(42) Farrugia, L. J. J. Appl. Crystallogr. 2012, 45, 849-854.
(43) Proux, O.; Biquard, X.; Lahera, E.; Menthonnex, J. J.; Prat, A.; Ulrich, O.; Soldo, Y.; Trévisson, P.; Kapoujvan, G.; Perroux, G.; Taunier, P.; Grand, D.; Jeantet, P.; Deleglise, M.; Roux, J.-P.; Hazemann, J.-L. Phys. Scr. 2005, 115, 970-973.
(44) Michalowicz, A.; Moscovici, J.; Muller-Bouvet, D.; Provost, K. J. Phys.: Conf. Ser. 2009, 190, 012034-012035.
(45) Lengeler, B.; Eisenberg, P. Phys. Rev. B: Condens. Matter Mater. Phys. 1980, 4507-4520.
(46) Guillon, E.; Merdy, P.; Aplincourt, M. Chemistry - A European Journal 2003, 9, 4479-4484.
(47) Zabinsky, S. I.; Rehr, J. J.; Ankudinov, A. L.; Albers, R. C.; Eller, M. J. Phys. Rev. B: Condens. Matter Mater. Phys. 1995, 52, 2995-3009. (48) Pardo, E.; Ruiz-García, R.; Cano, J.; Ottenwaelder, X.; Lescouëzec, R.; Journaux, Y.; Lloret, F.; Julve, M. Dalton Trans. 2008, 21, 2780. (49) Dul, M.-C.; Pardo, E.; Lescouëzec, R.; Journaux, Y.; Ferrando-Soria, J.; Ruiz-Garcia, R.; Cano, J.; Julve, M.; Lloret, F.; Cangussu, D.; Pereira, C. L. M.; Stumpf, H. O.; Pasan, J.; Ruiz-Perez, C. Coord. Chem. Rev.
2010, 254, 2281-2296.
(50) Grancha, T.; Ferrando-Soria, J.; Castellano, M.; Julve, M.; Pasán, J.; Armentano, D.; Pardo, E. Chem. Commun. 2014, 50, 7569-7585. (51) Fortea-Pérez, F. R.; Schlegel, I.; Julve, M.; Armentano, D.; De Munno, G.; Stiriba, S.-E. J. Organomet. Chem. 2013, 743, 102-108. (52) Pim, W. D. d.; Oliveira, W. X. C.; Ribeiro, M. A.; Faria, É. N. d.; Teixeira, I. F.; Stumpf, H. O.; Lago, R. M.; Pereira, C. L. M.; Pinheiro, C. B.; Figueiredo-Júnior, J. C. D.; Nunes, W. C.; Souza, P. P. d.; Pedroso, E. F.; Castellano, M.; Cano, J.; Julve, M. Chem. Commun. 2013, 49, 10778-10780.
(53) Peisach, J.; Blumberg, W. E. Arch. Biochem. Biophys. 1974, 165, 691-708.
(54) Bal, W.; Sokołowska, M.; Kurowska, E.; Faller, P. Biochim. Biophys. Acta 2013, 1830, 5444-5455.
(55) Kowalik-Jankowska, T.; Ruta, M.; Wisniewska, K.; Lankiewicz, L. J. Inorg. Biochem. 2003, 95, 270-282.
(56) Syme, C. D.; Nadal, R. C.; Rigby, S. E.; Viles, J. H. J. Biol. Chem.
2004, 279, 18169-18177.
(57) Hureau, C.; Coppel, Y.; Dorlet, P.; Solari, P. L.; Sayen, S.; Guillon, E.; Sabater, L.; Faller, P. Angew. Chem., Int. Ed. Engl. 2009, 48, 9522-9525.
(58) Dorlet, P.; Gambarelli, S.; Faller, P.; Hureau, C. Angew. Chem., Int. Ed. Engl. 2009, 48, 9273-9276.
(59) Kowalik-Jankowska, T.; Ruta-Dolejsz, M.; Wisniewska, K.; Lankiewicz, L. J. Inorg. Biochem. 2001, 86, 535-545.