HAL Id: inserm-00425550
https://www.hal.inserm.fr/inserm-00425550
Submitted on 22 Oct 2009
HAL is a multi-disciplinary open access
archive for the deposit and dissemination of sci-entific research documents, whether they are pub-lished or not. The documents may come from teaching and research institutions in France or abroad, or from public or private research centers.
L’archive ouverte pluridisciplinaire HAL, est destinée au dépôt et à la diffusion de documents scientifiques de niveau recherche, publiés ou non, émanant des établissements d’enseignement et de recherche français ou étrangers, des laboratoires publics ou privés.
follow-up in the GAZEL cohort.
Jussi Vahtera, Hugo Westerlund, Jane Ferrie, Jenny Head, Maria Melchior,
Archana Singh-Manoux, Marie Zins, Marcel Goldberg, Kristina Alexanderson,
Mika Kivimaki
To cite this version:
Jussi Vahtera, Hugo Westerlund, Jane Ferrie, Jenny Head, Maria Melchior, et al.. All-cause and diagnosis-specific sickness absence as a predictor of sustained suboptimal health: a 14-year follow-up in the GAZEL cohort.. J Epidemiol Community Health, 2010, 64 (4), pp.311-7. �10.1136/jech.2008.083923�. �inserm-00425550�
All-cause and diagnosis-specific sickness absence as a predictor of
sustained sub-optimal health: a 14-year follow-up in the GAZEL
cohort
Jussi Vahtera, MD, Hugo Westerlund, PhD, Jane E. Ferrie, PhD, Jenny Head, Msc, Maria Melchior, ScD, Archana Singh-Manoux, PhD, Marie Zins, MD, Marcel Goldberg, MD, PhD, Kristina Alexanderson, PhD, Mika Kivimäki, PhD.
Finnish Institute of Occupational Health, Helsinki, Finland (J Vahtera, M Kivimäki); Department of Public Health, University of Turku and Turku University Hospital, Turku, Finland (J Vahtera); Stress Research Institute, Stockholm University,
Stockholm, Sweden (H Westerlund); Department of Epidemiology and Public Health, University College London, London, UK (JE Ferrie, J Head, M Kivimäki); INSERM, U687-IFR69, Paris, France (M Melchior, A Singh-Manoux, M Zins, M Goldberg); Karolinska Institutet, Section of Personal Injury Prevention, Stockholm, Sweden (K Alexanderson)
Correspondence:
Dr Jussi Vahtera, Finnish Institute of Occupational Health, Lemminkäisenkatu 14-18, FIN-20520 Turku, Finland. Telephone +358 30 474 7520, fax +358 30 474 7555, e-mail: jussi.vahtera@ttl.fi
The Corresponding Author has the right to grant on behalf of all authors and does grant on behalf of all authors, an exclusive licence (or non exclusive for government employees) on a worldwide basis to the BMJ Publishing Group Ltd and its Licensees to permit this article (if accepted) to be published in JECH and any other BMJPGL products to exploit all subsidiary rights as set out in the licence (http://jech.bmj.com/ifora/licence.pdf)".
Word count: Abstract 231, main text 3615. Number of tables: 4; number of figures: 0.
ABSTRACT
Background. Previous studies show that sickness absence predicts health, but it is
unclear whether this association is persistent over time and whether specific diseases underlie long-term associations. The aim of this study was to investigate overall and diagnosis-specific sickness absences as predictors of sustained sub-optimal health.
Methods. Prospective occupational cohort study of 15,320 employees (73% men) aged
37 to 51. Sickness absence records in 1990-1992, including 13 diagnostic categories, were examined in relation to self-rated health measured annually for the years 1993-2006.
Results. 3,385 employees (22%) had >30 days of sickness absence and 5,564 (36%)
1-30 days during the 3-year exposure window. Repeated-measures logistic regression analysis adjusted for age, sex, occupational status and chronic diseases show employees with >30 absence days, compared to those with no absences, had 2.14 (95% CI 2.00-2.29) times higher odds for suboptimal health over the 14 years of follow-up.
Retirement did not dilute this association. 9 sickness absence diagnostic categories, such as diseases of the nervous, circulatory, metabolic, musculoskeletal, sensory and gastro-intestinal systems, cancer, mental disorders and external causes, independently
predicted increased risk of sustained sub-optimal health.
Conclusions. There is a remarkably persistent association between sickness absence and
future long-term self-rated health status for the majority of diagnostic categories for sickness absence. This suggests that the association between sickness absence and health is ubiquitous and not driven by a limited number of rare and severe diseases.
INTRODUCTION
High levels of sickness absence are associated with increased prevalence of chronic conditions and also predict future health outcomes, such as early retirement on medical grounds and mortality.1-6 It has been hypothesised that the associations between
sickness absence and health are driven by a range of common and general health
problems and not only by rare and severe conditions in a small minority.3 If this really is the case, sickness absence in general, as well as common causes of sickness absence, should predict long-term health problems, persisting over several years.
To date only two large-scale cohort studies appear to have examined whether the association between all-cause sickness absence and health is ubiquitous, or is driven by specific diagnostic categories for sickness absence. Findings from the British Whitehall II cohort and the French GAZEL cohort show increased mortality rates among
employees who take sick leave for common diagnostic categories, such as mental disorders, respiratory diseases and circulatory diseases.5,6 However, the predictive value of diagnosis-specific sickness absence in relation to long-term health remains unclear, as repeated measurements of health over an extended follow-up period would be needed to examine this issue.
Data from GAZEL, an ongoing large-scale prospective study of employees from the French national gas and electricity company,7 enabled us to examine the association between sickness absence and sub-optimal self-rated health over an extended period. A particular strength of the GAZEL study is physician-certified sickness absence data from company registers followed by 14 repeated annual measurements of self-rated
health to date. Self-rated-health, a single-item measure of health status in which
individuals are asked to rate their own health, has been shown to be highly predictive of mortality in different settings,8-9 including the GAZEL cohort.10 We hypothesised that higher levels of sickness absence over an exposure window of three years would be associated with subsequent sub-optimal self-rated health over repeated assessments. We also hypothesised that these associations would be observed in many diagnostic
categories, including the common categories, such as musculoskeletal diseases and mental disorders.
METHODS Study population
The GAZEL cohort was established in 1989 and is comprised of employees from the French national gas and electricity company: Electricité de France-Gaz de France (EDF-GDF).11 At baseline, 20,625 employees (73% men), aged 35-50, gave consent to
participate. The project uses an annual questionnaire to collect data on health, lifestyle, individual, familial, social and occupational factors, and life events. Various sources within EDF-GDF provide additional data on GAZEL participants, e.g. sickness absence.
Participants excluded from the analysis were those with <3 measurements for self-rated health between 1993 and 2006 inclusive (n=3339), those retired prior to 1994 (n=1750), those with >700 days of sickness absence 1990-1992 (n=73), and those with missing data for any of the baseline covariates (n=143). The resulting cohort consisted of 15,320 employees, who were employed between 1990 and 1992, the sickness absence exposure period for this study, and who had three or more self-rated health measures over the follow-up period from 1993 to 2006.
Data on sickness absence
EDF-GDF workers receive their salary in full during a sick leave regardless of the length of the absence. Therefore, a medical certificate is required for all sick leaves. Every absence spell is recorded and each sickness absence must be verified by a company physician. All diagnoses are coded by company physicians using an abridged version of the International Classification of Diseases (ICD) version 9. Company physicians may contact the employee’s treating physician to verify the diagnosis if required. The validity of the sickness absence data has proved to be of high quality.12,13
We obtained computerised sickness absence records from 1 January 1990 to 31 December 1992 from EDF-GDF. These records included the first and last dates of all absences. For each employee, we computed the total number of sick days for all absences which began between January 1, 1990 and December 31, 1992. From this participants were categorised into one of the 3 following groups: 0 sickness absence days, 1-30 sickness absence days and >30 sickness absence days during the three-year exposure window. We chose >30 days of sickness absence in a 3 year period to
represent a high level of sickness absence. Earlier reports have found an increased risk of all-cause and cause-specific mortality among male and female employees with >15 recorded sickness absence days a year.4 We used diagnoses in 13 ICD-9 chapters to study cause-specific associations. The chapters relating to injury, poisoning and external causes were collapsed into one category, external causes. Spells of absence with a diagnosis that fell outside the 13 categories (diseases of the blood and blood-forming organs, complications of pregnancy, congenital abnormalities, conditions originating in
the perinatal period, and symptoms, signs and ill-defined conditions) were classified as ‘Other’, and spells with no diagnosis were classified as ‘Diagnosis missing’.5 To be included as an absentee in a particular diagnostic category participants had to have at least one new sickness-absence spell for that diagnosis during the three-year exposure window.
Data on self-rated health
Annual measures of self-rated health for the years 1993-2006 were used to measure sustained sub-optimal health subsequent to our measure of sickness absence. Self-rated health was assessed by an overall rating of health on an 8-point scale (1 = very
good….8 = very poor). This measure was dichotomized as in earlier studies on this cohort, by categorising response scores 1 - 4 as good health and scores 5 - 8 as sub-optimal health.7
Covariates
Variables obtained from EDF-GDF company records included sex, age, occupational status, and the year of retirement. Data on occupation before 1993 was derived from data supplied by the company and classified into higher (managers), intermediate (technical), and lower (clerical and manual) grades, respectively, based on
categorisations from the French National Statistics Institute.10 Because all pensions are paid by EDF-GDF, company data on retirement are comprehensive and accurate. Statutory age of retirement is between 55 and 60 years, depending on the type of job. Affirmative responses (yes) to a checklist of over 50 chronic conditions in the annual surveys were used to identify the following chronic diseases and their timing: ischemic
heart disease or stroke, asthma or bronchitis, rheumatoid arthritis or osteoarthritis, cancer, and depression.7
Statistical methods
We examined self-rated health status from 1993 to 2006 in relation to sickness absence from 1990 to 1992. Because repeated measurements of health status in the same person are correlated observations, we applied repeated-measures logistic regression analysis with generalized estimating equations with autoregressive correlation structure.14 The generalized estimating equations method takes into account the correlation between measurements of self-rated health within persons, and it does not exclude people with some missing measurements on self-rated health. For the 3 categories of sickness absence (0 days, 1-30 days, >30 sickness absence days) observed during the 1990-1992 exposure window, we calculated the overall and annual odds ratios (OR) for
sub-optimal health and their 95% confidence intervals (95% CI) for the time period 1993-2006. Annual estimates were derived from GEE-models including the interaction term "sickness absence x year". To examine the effect of missing data on the associations observed we repeated the analyses among the participants with complete data on self-rated health for all 14 repeated measurements.
Subsequent analyses examined the odds ratios for suboptimal health by sickness absence diagnostic category (absence or no absence), separately and simultaneously adjusted for sickness absence in all other categories, including those without classifiable diagnoses. The improvement in predictive power for suboptimal health gained by using
the sickness absence diagnostic categories rather than a simpler model with no diagnostic categories was tested by using the likelihood ratio chi square test.
Sex differences in the sickness absence-health associations were tested by including the interaction term for sex and sickness absence in the models. In further analyses we also examined whether the predictive ability of sickness absence (1990-1992) for subsequent sub-optimal health (1993-2006) was simply an artefact of the presence of high levels of sickness absence in certain individuals. Indeed, sickness absence can show a repetitive pattern. In order to examine this possibility, we analysed the predictive associations between sickness absence in 1990-1992 and sub-optimal health separately in the years before retirement (when sickness absence can occur) and in the years after retirement (when sickness absence cannot occur).
All analyses were adjusted for age, sex, occupational status, the year of assessment of self-rated health (treated as a categorical variable) and chronic diseases, treated as a time dependent covariates (disease in each year preceding the measurement of health). They were conducted using the SAS 9.2 program.
RESULTS
In 1990-1992, altogether 387,066 days of sickness absence were recorded for the 15,320 participants. In all 42% of the participants had no sickness absence in 1990-1992, 36% had 1-30 absence days and 22% more than 30 days (Table 1). Table 1 also shows that a high number of absence days was more common among those in the lower occupational grades, in women and those with chronic diseases at baseline. As expected, the
proportion of participants reporting prevalent ischemic heart disease, stroke,
musculoskeletal disorder or cancer was higher at the end of follow-up than at baseline. Accumulation of these diseases was not more common among those with a high number of sickness absence days than among the other groups.
All-cause sickness absence
The median number of measurements of self-rated health during the follow-up was 13 (inter quartile range 11-14). As shown in Table 2, higher levels of all-cause sickness absence in 1990-1992 were associated with a greater likelihood of sub-optimal health in every annual survey from 1993 to 2006. After adjustment for age, sex, occupational grade and year of assessment of self-rated health the odds ratio for sub-optimal health for employees with >30 absence days compared to those with no sickness absence was 2.9 in the first year and was still 2.1 times in the 14th year of follow-up. Further adjustment for chronic diseases in the year preceding the assessment of sub-optimal health attenuated these associations by 17-26%, but the odds ratios remained elevated, ranging from 1.8 to 2.5, depending on the year. The adjusted odds ratio for sub-optimal health across the years 1993-2006 was 2.14 (95% CI 2.00-2.29) for those with more than 30 absence days and 1.29 (1.21-1.37) for those with 1-30 absence days. The association between sickness absence and subsequent sub-optimal health did not vary substantially by sex, as indicated by the interaction term (p=0.072).
Repeating the analyses in a sub-cohort of the 7394 participants with complete data on self-rated health for all 14 years of follow-up (48% of the total) replicated these findings (Table 2). The odds ratio for sub-optimal health adjusted for age, sex, occupational
grade, year, and chronic disease was 2.14 (1.93-2.37) for employees with more than 30 absence days and 1.32 (1.21-1.44) for those with 1-30 absence days compared to participants with no absence days. In analyses that were adjusted for sub-optimal health instead of chronic disease in the year preceding the measurement of the outcome odds ratios were attenuated by 34%-43% compared to those adjusted for age, sex,
occupational grade and year only: 1.80 (1.67-1.95) for >30 absence days and 1.25 (1.16-1.33) for 1-30 absence days.
Table 1 — Descriptive statistics. Figures are numbers (percentages), unless otherwise stated Sickness absence in 1990-1992
Baseline variable Number of
participants (%) Total number of days (%) Participants (%) with 0 days Participants (%) with 1-30 days Participants (%) with >30 days Age, mean (SD) 44.8 (3.3) 387066 45.2 (3.1) 44.6 (3.3) 44.4 (3.5) Sex Men 11185 (73) 219133 (57) 5373 (48) 3902 (35) 1910 (17) Women 4135 (27) 167933 (43) 998 (24) 1662 (40) 1475 (36) Occupational grade Higher 4552 (30) 47352 (12) 2727 (60) 1391 (31) 434 (9.5) Intermediate 8513 (55) 227352 (59) 3147 (37) 3324 (39) 2042 (24) Lower 2255 (15) 112362 (29) 497 (22) 849 (38) 909 (40)
Chronic diseases at baseline
Asthma, bronchitis 763 (5.0) 28623 (7.4) 233 (31) 287 (38) 243 (32)
IHD, stroke 143 (0.9) 10457 (2.7) 30 (21) 43 (30) 70 (49)
Musculoskeletal disorders 2285 (14.9) 96606 (25.0) 664 (29) 810 (35) 811 (36)
Cancer 71 (0.5) 9880 (2.6) 11 (16) 15 (21) 45 (63)
Depression 1228 (8.0) 78506 (20.3) 264 (22) 394 (32) 570 (46)
Chronic diseases at the end of follow-up
Asthma, bronchitis 828 (5.4) 30995 (8.0) 288 (35) 280 (34) 260 (31)
Ischemic heart disease, stroke 539 (3.5) 21413 (5.5) 203 (38) 167 (31) 169 (31)
Musculoskeletal disorders 3449 (22.5) 122679 (31.7) 1102 (32) 1312 (38) 1035 (30)
Cancer 591 (3.9) 20569 (5.3) 228 (39) 207 (35) 156 (26)
Year of follow-up Sickness absence in 1990-1992 N of participa nts 1993 1994 1995 1996 1997 1998 1999 2000 2001 2002 2003 2004 2005 2006 All participants n=13372 n=13006 n=13319 n=13361 n=12801 n=12741 n=12722 n=12403 n=12671 n=12730 n=12898 n=12887 n=12690 n=12619 Model 1 0 days 6371 1 1 1 1 1 1 1 1 1 1 1 1 1 1 1-30 days 5564 1.41 (1.27-1.57) 1.43 (1.28-1.58) 1.43 (1.30-1.58) 1.43 (1.29-1.58) 1.35 (1.22-1.50) 1.25 (1.13-1.39) 1.29 (1.16-1.43) 1.24 (1.10-1.40) 1.22 (1.08-1.38) 1.42 (1.26-1.60) 1.24 (1.10-1.40) 1.30 (1.16-1.46) 1.30 (1.15-1.46) 1.23 (1.09-1.38 >30 days 3385 2.92 (2.61-3.27) 2.76 (2.46-3.08) 2.58 (2.33-2.87) 2.56 (2.30-2.85) 2.34 (2.09-2.62) 2.23 (2.00-2.49) 2.27 (2.03-2.54) 2.48 (2.19-2.82) 2.44 (2.16-2.76) 2.35 (2.07-2.67) 2.27 (2.00-2.57) 2.16 (1.92-2.45) 2.23 (1.97-2.53) 2.08 (1.84-2.36 Model 2 0 days 6371 1 1 1 1 1 1 1 1 1 1 1 1 1 1 1-30 days 5564 1.36 (1.22-1.52) 1.38 (1.24-1.53) 1.39 (1.27-1.53) 1.37 (1.24-1.51) 1.31 (1.18-1.45) 1.21 (1.09-1.34) 1.25 (1.13-1.39) 1.21 (1.07-1.37) 1.18 (1.05-1.33) 1.39 (1.23-1.56) 1.20 (1.07-1.36) 1.26 (1.12-1.42) 1.25 (1.11-1.41) 1.19 (1.06-1.35 >30 days 3385 2.53 (2.26-2.84) 2.40 (2.14-2.69) 2.29 (2.06-2.54) 2.25 (2.02-2.51) 2.08 (1.85-2.33) 1.99 (1.78-2.22) 2.01 (1.80-2.25) 2.23 (1.96-2.54) 2.19 (1.93-2.48) 2.11 (1.86-2.40) 2.04 (1.80-2.32) 1.92 (1.70-2.18) 1.99 (1.75-2.26) 1.82 (1.61-2.07 Participants with no
missing data at follow-up n=7394 n=7394 n=7394 n=7394 n=7394 n=7394 n=7394 n=7394 n=7394 n=7394 n=7394 n=7394 n=7394 n=7394 Model 2 0 days 3325 1 1 1 1 1 1 1 1 1 1 1 1 1 1 1-30 days 2740 1.40 (1.21-1.63) 1.49 (1.29-1.72) 1.35 (1.19-1.53) 1.47 (1.28-1.70) 1.32 (1.15-1.53) 1.29 (1.12-1.48) 1.37 (1.19-1.58) 1.29 (1.09-1.53) 1.23 (1.04-1.45) 1.32 (1.12-1.56) 1.19 (1.00-1.41) 1.31 (1.12-1.53) 1.30 (1.10-1.53) 1.16 (0.99-1.36 >30 days 1329 2.58 (2.19-3.03) 2.42 (2.06-2.85) 2.11 (1.82-2.45) 2.39 (2.04-2.80) 2.06 (1.76-2.43) 2.02 (1.73-2.37) 2.05 (1.74-2.41) 2.20 (1.83-2.65) 2.34 (1.96-2.79) 2.09 (1.74-2.51) 2.02 (1.68-2.43) 1.87 (1.56-2.23) 2.07 (1.72-2.49) 1.75 (1.47-2.09
Odds ratios and 95% confidence intervals are derived from a repeated measures logistic regression GEE analysis. Model 1 adjusted for age, sex, and occupational grade.
Model 2 adjusted additionally for chronic diseases (ischemic heart disease or stroke, asthma or bronchitis, rheumatoid arthritis or osteoarthritis, cancer, and depression) as time-dependent covariates for the year preceding the assessment of the outcome.
Diagnostic categories of sickness absence
The distribution of sickness absences in 1990-1992 by diagnostic category is shown in Table 3. To be included as an absentee in a particular diagnostic category, participants had to have at least one new sick leave for that diagnosis during the three-year exposure window. Although one third of the participants were missing a diagnosis for at least one sick leave, the proportion of the total number of sick leave days missing a diagnosis was only 17%. Most days of sick leave were taken in the categories musculoskeletal diseases (18%), external causes (14%), and mental disorders (12%), followed by respiratory diseases (7%), diseases of the circulatory system (7%), and gastrointestinal diseases (6%). Of all sick leave days, 64% were attributable to these categories.
Table 3 also shows that the odds ratios for sub-optimal health in 1993-2006 were significantly higher for participants with any spell for specific diagnosis in almost all diagnostic categories compared to those with no absence in the corresponding category, adjusted for age, sex, occupational grade, year, and chronic disease. Even when the associations were mutually adjusted for sickness absences in all other diagnostic
categories, the results remained essentially the same. Sickness absence with a diagnosis of disease of the nervous system, circulatory system, metabolic system and mental disorders independently predicted a 1.5-1.8 greater likelihood of sub-optimal health in the subsequent 14 years. The mutually adjusted odds ratios varied between 1.3-1.4 for diagnoses of cancer and diseases of the sense organs, musculoskeletal system, and gastro-intestinal system and were between 1.1 and 1.2 for respiratory diseases, diseases of the gastro-intestinal system and external causes. The only diagnostic categories not independently associated with later sub-optimal health were infections and diseases of
the skin. All associations between sub-optimal health and sickness absence by
diagnostic category were independent of sex, as indicated by non-significant p-values for sex interactions. The only exception was cancer [fully adjusted OR 1.76 (95% CI 1.32-2.34) in men and 1.27 (1.05-1.53) in women; test of interaction p<0.0001]. The comparison of models with and without sickness absence diagnoses indicated that inclusion of diagnoses improved the prediction of suboptimal health (p for improvement in chi square <0.0001).
Sub-optimal health in 1993-2006†
adjusted for year + age, sex, grade and
chronic disease
+ mutually adjusted
Diagnosis of sickness absence in 1990-1992 Number of participants (%)
Total number of days (%)
OR (95% CI) OR (95% CI) OR (95% CI)
Infectious and parasitic diseases 183 (1.2) 4194 (1.1) 1.45 (1.16-1.81) 1.22 (0.98-1.51) --- ---
Cancer 354 (2.3) 20773 (5.4) 1.72 (1.46-2.02) 1.42 (1.21-1.66) 1.28 (1.09-1.51)
Endocrine, nutritional and metabolic diseases 142 (0.9) 4945 (1.3) 2.38 (1.87-3.02) 1.97 (1.56-2.48) 1.74 (1.38-2.19)
Mental disorders 1008 (6.6) 46644 (12.1) 2.45 (2.24-2.68) 1.76 (1.61-1.92) 1.47 (1.34-1.61)
Diseases of nervous system 95 (0.6) 4257 (1.1) 2.70 (1.98-3.67) 2.14 (1.57-2.92) 1.82 (1.30-2.54)
Diseases of sense organs 252 (1.6) 6850 (1.8) 1.71 (1.43-2.05) 1.52 (1.28-1.81) 1.34 (1.13-1.60)
Diseases of the gastro-intestinal system 1147 (7.5) 23284 (6.0) 1.66 (1.51-1.82) 1.44 (1.32-1.58) 1.23 (1.12-1.35)
Diseases of the circulatory system 643 (4.2) 25208 (6.5) 1.97 (1.75-2.22) 1.69 (1.51-1.89) 1.50 (1.34-1.68)
Diseases of the respiratory system 2292 (15.0) 28071 (7.3) 1.59 (1.48-1.70) 1.32 (1.24-1.41) 1.11 (1.03-1.19)
Diseases of the skin and subcutaneous tissue 154 (1.0) 2414 (0.6) 1.66 (1.31-2.12) 1.35 (1.08-1.70) 1.16 (0.92-1.46)
Diseases of the genitourinary system 615 (4.0) 18512 (4.8) 1.83 (1.63-2.07) 1.50 (1.34-1.69) 1.34 (1.19-1.51)
Diseases of musculoskeletal system 1922 (12.3) 69065 (17.8) 1.86 (1.73-2.00) 1.53 (1.43-1.64) 1.36 (1.19-1.46)
External causes 1400 (9.1) 55263 (14.3) 1.46 (1.34-1.59) 1.29 (1.19-1.40) 1.17 (1.08-1.27)
Other 767 (5.0) 11539 (3.0) 1.92 (1.73-2.13) 1.51 (1.36-1.67) 1.21 (1.09-1.35)
Diagnosis missing 5354 (34.9) 66047 (17.1) 1.52 (1.44-1.61) 1.31 (1.24-1.38) 1.22 (1.16-1.29)
To be included as an absentee in a particular diagnostic category, participants had to have at least one new sick leave for that diagnosis during the three-year exposure window.
The reference group for each diagnostic category is participants with no sickness absence for that specific diagnosis.
All interactions with sex were non-significant (p>0.05) except for cancer (p<0.0001). †Derived from a repeated measures logistic regression GEE analysis.
Predictive associations after retirement
During the follow-up, 87% of all participants retired, almost half during 1995-1999 and the rest between 2000 and 2006. The association between sickness absence and sub-optimal health, adjusted for age, sex, grade, year and chronic disease, was analysed before and after retirement. Before retirement, the odds ratio for sub-optimal health was 2.37 (2.20-2.56) for participants with more than 30 absence days and 1.36 (1.27-1.45) for those with 1-30 absence days. The corresponding odds ratios in the years after retirement were 1.84 (1.67-2.03) and 1.20 (1.10-1.31), respectively.
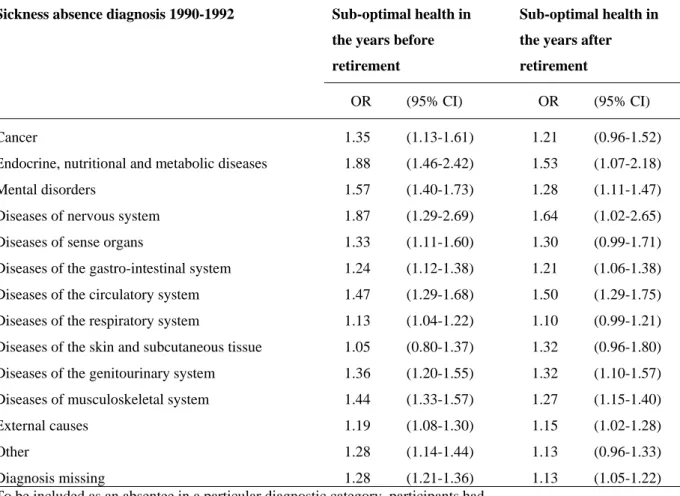
Table 4 presents the associations between diagnostic categories of sickness absence and sub-optimal health before and after retirement in analysis adjusted for age, sex,
occupational grade, year, chronic disease and all other diagnostic categories of sickness absence. Odds ratios for sub-optimal health in most diagnostic categories were slightly higher in the years before retirement than in the years after retirement. However, a significantly increased likelihood of sub-optimal health after retirement was observed for 9 of the 14 diagnostic categories studied. The strongest associations with sub-optimal health after retirement were found for sickness absences due to disease of the nervous system, circulatory system, and metabolic system.
TABLE 4 — Mutually adjusted odds ratios for overall sub-optimal self-rated health in
1993-2006 before and after retirement by sickness absence diagnosis 1990-1992†.
Sickness absence diagnosis 1990-1992 Sub-optimal health in
the years before retirement
Sub-optimal health in the years after retirement
OR (95% CI) OR (95% CI)
Cancer 1.35 (1.13-1.61) 1.21 (0.96-1.52)
Endocrine, nutritional and metabolic diseases 1.88 (1.46-2.42) 1.53 (1.07-2.18)
Mental disorders 1.57 (1.40-1.73) 1.28 (1.11-1.47)
Diseases of nervous system 1.87 (1.29-2.69) 1.64 (1.02-2.65) Diseases of sense organs 1.33 (1.11-1.60) 1.30 (0.99-1.71) Diseases of the gastro-intestinal system 1.24 (1.12-1.38) 1.21 (1.06-1.38) Diseases of the circulatory system 1.47 (1.29-1.68) 1.50 (1.29-1.75) Diseases of the respiratory system 1.13 (1.04-1.22) 1.10 (0.99-1.21) Diseases of the skin and subcutaneous tissue 1.05 (0.80-1.37) 1.32 (0.96-1.80) Diseases of the genitourinary system 1.36 (1.20-1.55) 1.32 (1.10-1.57) Diseases of musculoskeletal system 1.44 (1.33-1.57) 1.27 (1.15-1.40)
External causes 1.19 (1.08-1.30) 1.15 (1.02-1.28)
Other 1.28 (1.14-1.44) 1.13 (0.96-1.33)
Diagnosis missing 1.28 (1.21-1.36) 1.13 (1.05-1.22)
To be included as an absentee in a particular diagnostic category, participants had to have at least one new sick leave for that diagnosis during the three-year
exposure window. The reference group for each diagnostic category is participants with no sickness absence for that specific diagnosis.
†Derived from repeated measures logistic regression GEE analyses adjusted for sex, age, occupational grade, year, and chronic disease (IHD or stroke, asthma or bronchitis, rheumatoid arthritis or
osteoarthritis, cancer, and depression) as time-dependent covariates for the year preceding the assessment of the outcome.
DISCUSSION
To our knowledge, this is the first study to examine the long-term associations between sickness absence and subsequent health status. We found a remarkably persistent association between the number of sickness absence days and sub-optimal self-rated health measured every year over a follow-up period of 14 years. Compared to employees who had no sickness absence, the odds of sub-optimal health were over 2 times higher among those with a high number of sickness absence days (>30 days) during the 3-year observation window. This association was robust to adjustments for age, sex, occupational grade and chronic disease, and was observed in the years before and after retirement. The results suggest a dose-response pattern in that a lower but still detectable risk was also observed for those with 1-30 absence days over the baseline exposure window. Importantly, the increased risk of sub-optimal health was observable not only in relation to rare and severe diseases leading to sickness absence but also in common diagnostic categories for sickness absence, such as musculoskeletal diseases and mental disorders.
Self-rated health is one of the most widely used general measures of health status (15) and in prospective epidemiological studies it has consistently been linked with a number of important medical endpoints, such as morbidity, permanent disability, hospitalization and all-cause and cause-specific mortality.3,7, 8, 16-18 There is a close association between sub-optimal self-rated health and many diseases, with changes in perceived health moving in the same directions as changes in reported diseases.19 In line with this, poor or fair self-rated health has been found to be particularly predictive for respondents with
self-reported history of circulatory system diagnoses and perception of symptoms, but not for respondents without symptoms or diagnoses.20
Our finding that high levels of sickness absence over an exposure window of three years can be used to detect individuals who repeatedly rate their health status to be
sub-optimal over the subsequent fourteen years, irrespective of prevalent and emerging chronic disease, is important. In spite of the subjective component in sickness absence and the fact that it can be influenced by external conditions, such data are routinely collected by employers and seem to be an exceptionally reliable predictor of long-term health trajectories among employees. These findings are in agreement with prospective epidemiological studies that have demonstrated an association between high sickness absence levels and severe health outcomes.1-8 Sickness absence has been found to be a more powerful predictor of all-cause mortality than established self-reported health measures and available objective measures of specific physical illnesses and medical conditions,3 and including the diagnosis for sickness absence seems to improve the prediction of the risk of death.6 Sickness absence is also a strong predictor of specific causes of death, such as cardiovascular disease, cancer, alcohol-related causes and suicide,4 and a risk marker for future disability retirement.1, 2, 21, 22
In this study, sick leaves taken in the six most common categories - musculoskeletal diseases, external causes, mental disorders, respiratory diseases, circulatory diseases, and gastrointestinal diseases - were predictive of sustained sub-optimal health status over the subsequent 14 years, even after adjustment for prior health status. Only for respiratory diseases was this association substantially attenuated on mutual adjustment
for sickness absence in all other diagnostic categories. These findings support the interpretation that the association between sickness absence and health is not driven by a limited number of diagnostic categories, but it is more ubiquitous, with strong
evidence of an association with sustained sub-optimal health for the majority of diagnostic categories of absence. This may partly explain the very robust link between sickness absence and mortality which has been observed across different follow-up periods and which held after deaths during the first years of follow-up were excluded.3, 4
Our findings are in agreement with earlier research on diagnosis-specific sickness absence and mortality. An earlier study from the GAZEL cohort found excess
premature death among men and women taking sick leave with a diagnosis of mental disorders and among men with a diagnosis of gastrointestinal and circulatory diseases. 5 Among British civil servants, excess premature death was found in employees with a diagnosis of circulatory diseases, mental disorders, and respiratory diseases.6
We found no evidence of sex-differences in the association between sickness absence and subsequent self-rated health. This is an interesting finding, as women not only rate their health status less favourably than men but also have more sickness absence.3, 4, 23 Studies of associations between sickness absence and mortality have found little
difference between the sexes 3-6 but studies of sex differences in the association between self-rated health and mortality are mixed.16 Obviously, sex differences in health remain an important issue for further studies.24, 25
At least three limitations to this study are noteworthy. First, cohorts like GAZEL that follow the same individuals over an extended time period are subject to a “healthy survivor” effect as participants with severe illnesses are more prone to drop out of the study over time.26 Because sub-optimal health is correlated with many severe illnesses, those completely lost to follow-up might have had higher risk of non-optimal health than their remaining counterparts. However, when the analyses were restricted to the 7394 participants (48% of the total) for whom data on self-rated health were available for all 14 years of follow-up, the findings were almost identical. Thus we believe that loss-to-follow-up is an unlikely source of major bias in this study.
Second, a range of chronic diseases are likely to underlie the remarkably persistent association between sickness absence and non-optimal health. However, adjustment for self-reported pre-existing and emerging chronic conditions did not eliminate the
association. This suggests that preclinical disease may play a role, as measurements of biological risk factors were not available in this cohort. We adjusted for a broad set of confounders and mediators; age, sex, occupational grade, retirement and chronic disease. It is possible that other factors such as personality traits or negative affectivity, may act as predisposing factors for health problems and illness behaviour.27, 28 Such dispositions are not likely to change over time and this could explain why self-rated health scores remained sub-optimal over a long time. Further research on these and other factors are needed to identify mechanisms that explain the strength of all-cause and diagnosis-specific sickness absence in relation to predicting long-term health.
Third, the serial data for this study came from the French National Gas and Electricity company in which the personnel enjoy stability of employment and good terms and conditions. Typically, they have civil servant status: they stay within the company their whole career until their retirement between 55 and 60 years of age, and their pensions are paid by the company. More research is needed to affirm that the results seen in this cohort would hold for other working populations and conditions of employment.
In conclusion, serial measurements in the GAZEL study provide strong evidence for the ability of all-cause and diagnosis-specific sickness absence records to identify groups of employees at risk of long-term sub-optimal health. Our study supports the hypothesis that sickness absence is not only a marker of contemporaneous health status but also a powerful predictor of sustained sub-optimal health resulting from a wide array of illnesses experienced by employees. Given that sickness absence records are collected routinely in many workplaces, such data may provide a useful tool for targeted
ACKNOWLEDGMENTS
The authors express their thanks to EDF-GDF, especially to the Service des Etudes Médicales and the Service Général de Médecine de Contrôle, and to the “Caisse
centrale d’action sociale du personnel des industries électrique et gazière”. We also
wish to acknowledge the Risques Postprofessionnels – Cohortes de l’Unité mixte 687
Inserm – Cnamts - Cetaf team responsible for the GAZEL data base management. The
GAZEL Cohort Study was funded by EDF-GDF and INSERM, and received grants from the Association de la Recherche sur le Cancer and from the Fondation de France.
FUNDING
JV and MK are supported by the Academy of Finland (grants #117604, #124271, #124322 and 129262), HW is supported by the Swedish Council for Working Life and Social Research (FAS, grants #2004-2021, #2007-1143). JEF is supported by the MRC (Grant number G8802774). AS-M is supported by a EUYRI award from the European Science Foundation. KA was supported by the Swedish Council for Working Life and Social Research.
REFERENCES
1. Kivimäki M, Forma P, Wikstrom J, et al. Sickness absence as a risk marker of future disability pension: the 10-town study. J Epidemiol Community Health 2004;58:710-1.
2. Kivimäki M, Ferrie JE, Hagberg J, et al. Diagnosis-specific sick leave as a risk marker for disability pension in a Swedish population. J Epidemiol Community Health 2007;61:915-20.
3. Kivimäki M, Head J, Ferrie JE, et al. Sickness absence as a global measure of health: evidence from mortality in the Whitehall II prospective cohort study. BMJ 2003;327:364.
4. Vahtera J, Pentti J, Kivimäki M. Sickness absence as a predictor of mortality among male and female employees. J Epidemiol Community Health
2004;58:321-6.
5. Ferrie JE, Vahtera J, Kivimäki M, Westerlund H, Melchior M, Alexanderson K, Head J, Chevalier A, Leclerc A, Zins M, Goldberg M, Singh-Manoux A.
Diagnosis-specific sickness absence and all-cause mortality in the GAZEL study. Journal of Epidemiology and Community Health 2009; 63:50-5. 6. Head J, Ferrie JE, Alexanderson K, Westerlund H, Vahtera J, Kivimäki M.
Diagnosis-specific sickness absence as a predictor of mortality in the Whitehall II prospective cohort study. BMJ 2008 Oct 2;337:a1469.
7. Niedhammer I, Chea M. Psychosocial factors at work and self reported health: comparative results of cross sectional and prospective analyses of the French GAZEL cohort. Occup Environ Med. 2003;60:509-15.
8. Idler EL, Benyamini Y. Self-rated health and mortality: a review of twenty-seven community studies. J Health Soc Behav 1997;38:21-37.
9. Jylha M, Guralnik JM, Ferrucci L, et al. Is self-rated health comparable across cultures and genders? The journals of gerontology 1998;53:S144-52.
10. Singh-Manoux A, Dugravot A, Shipley MJ, et al. The association between self-rated health and mortality in different socioeconomic groups in the GAZEL cohort study. Int J Epidemiol 2007;36:1222-8.
11. Goldberg M, Leclerc A, Bonenfant S, et al. Cohort profile: the GAZEL Cohort Study. Int J Epidemiol 2007;36:32-9.
12. Melchior M, Krieger N, Kawachi I, Berkman LF, Niedhammer I, Goldberg M. Work factors and occupational class disparities in sickness absence: findings from the GAZEL cohort study. Am J Public Health. 2005;95:1206-12. 13. Metzger MH, Goldberg M, Chastang JF, et al. Factors associated with
self-reporting of chronic health problems in the French GAZEL cohort. J Clin Epidemiol 2002;55:48-59.
14. Lipsitz SR, Kim K, Zhao L. Analysis of repeated categorical data using generalized estimating equations. Stat Med 1994;13:1149-63.
15. Krause NM, Jay GM. What do global self-rated health items measure? Med Care 1994;32:930-42.
16. Idler EL, Russell LB, Davis D. Survival, functional limitations, and self-rated health in the NHANES I Epidemiologic Follow-up Study, 1992. First National Health and Nutrition Examination Survey. Am J Epidemiol 2000;152:874-83. 17. Kennedy BS, Kasl SV, Vaccarino V. Repeated hospitalizations and self-rated health among the elderly: a multivariate failure time analysis. Am J Epidemiol 2001;153:232-41.
18. Trump DH. Self-rated health and health care utilization after military deployments. Military Medicine 2006;171:662-8.
19. Goldberg P, Gueguen A, Schmaus A, et al. Longitudinal study of associations between perceived health status and self reported diseases in the French Gazel cohort. J Epidemiol Community Health 2001;55:233-8.
20. Idler E, Leventhal H, McLaughlin J, et al. In sickness but not in health: self-ratings, identity, and mortality. J Health Soc Behav 2004;45:336-56.
21. Qin P, Agerbo E, Mortensen PB. Suicide risk in relation to socioeconomic, demographic, psychiatric, and familial factors: a national register-based study of all suicides in Denmark, 1981-1997. Am J Psychiatry 2003;160:765-72.
22. Lund T, Kivimäki M, Labriola M, Villadsen E, Christensen KB. Using administrative sickness absence data as a marker of future disability pension: The prospective DREAM study of Danish private sector employees. Occup Environ Med 2008;65:28-31.
23. Alexanderson K, Norlund A, (Eds.). Sickness absence - causes, consequences, and physicians' sickness certification practices: A systematic review.
Scandinavian Journal of Public Health 2004;32 (Suppl 63):1-263.
24. Messing K, Punnett L, Bond M, et al. Be the fairest of them all: challenges and recommendations for the treatment of gender in occupational health research. Am J Ind Med 2003;43:618-29.
25. Singh-Manoux A, Gueguen A, Ferrie J, et al. Gender differences in the association between morbidity and mortality among middle-aged men and women. Am J Public Health 2008;98:2251-7.
26. Goldberg M., Chastang JF., Zins M., Niedhammer I., Leclerc A. Health problems were the strongest predictors of attrition during follow up of the GAZEL cohort. J Clin Epidemiol. 2006,59:1213-21.
27. Macleod J, Davey Smith G, Heslop P, et al. Psychological stress and cardiovascular disease: empirical demonstration of bias in a prospective observational study of Scottish men. Bmj 2002;324:1247-51.
28. Davidson J, Krishnan R, France R, et al. Neurovegetative symptoms in chronic pain and depression. J Affect Disord 1985;9:213-8.
What is already known on this subject.
Previous studies show that sickness absence predicts health, but it is unclear whether this association is persistent over time and whether specific diseases underlie long-term associations.
What does this study add.
There is a remarkably persistent association between sickness absence and future long-term self-rated health status for the majority of diagnostic categories for sickness absence.
This suggests that the association between sickness absence and health is ubiquitous and not driven by a limited number of rare and severe diseases.
Given that sickness absence records are collected routinely in many workplaces, such data may provide a useful tool for targeted interventions.