HAL Id: hal-01174209
https://hal-brgm.archives-ouvertes.fr/hal-01174209
Submitted on 19 Nov 2019
anthropogenic forcing on the groundwater resource in a
karst catchment
Hervé Jourde, Antoine Lafare, Naomi Mazzilli, Gilles Belaud, Luc Neppel,
Nathalie Dörfliger, Flavie Cernesson
To cite this version:
Hervé Jourde, Antoine Lafare, Naomi Mazzilli, Gilles Belaud, Luc Neppel, et al.. Flash flood mitigation
as a positive consequence of anthropogenic forcing on the groundwater resource in a karst catchment.
Environmental Earth Sciences, Springer, 2014, 71 (2), pp.573-583. �10.1007/s12665-013-2678-3�.
�hal-01174209�
Flash flood mitigation as a positive consequence of anthropogenic
forcing on the groundwater resource in a karst catchment
Herve´ Jourde • A. Lafare • N. Mazzilli • G. Belaud • L. Neppel • N. Do¨ rfliger • F. Cernesson
H. Jourde (&) A. Lafare N. Mazzilli L. Neppel Laboratoire Hydrosciences Montpellier,
UMR 5569 CNRS-IRD-UM1-UM2, Universite´ Montpellier 2, Place Euge`ne Bataillon, 34095 Montpellier, France
e-mail: herve.jourde@um2.fr A. Lafare
British Geological Survey, Nicker Hill, Keyworth, Nottingham NG12 5GG, UK
N. Mazzilli
Laboratoire EMMAH, UMR 1114 INRA-UAPV, Universite´ d’Avignon et des Pays de Vaucluse, 33 rue Louis Pasteur, 84000 Avignon, France
G. Belaud
Montpellier SupAgro, UMR G-eau AgroParisTech,
CIHEAM-IAMM, Cirad, IRD, IRSTEA, SupAgro Montpellier, 2, Place Pierre Viala, 34060 Montpellier Cedex 1, France N. Do¨ rfliger
BRGM, 3 Avenue C. Guillemin, BP 36009, 45060 Orle´ans, France
F. Cernesson
Agro Paris Tech, UMR Tetis AgroParisTech CIRAD Irstea, 500 rue J.F. Breton, 34093 Montpellier Cedex 5, France
Introduction
In Mediterranean regions, the coexistence of extreme rainfall events (in the order of 200–300 mm per 24 h) and fractured and karstified calcareous terrains prevents the use of classical methods for the determination of flood hazard. Actually, only a small number of recent studies address the underground flood risk assessment in karst aquifers (Bon- acci et al. 2006; Najib et al. 2008). Indeed, the ambiguous relationship between rainfall and flow is complicated by specific interactions between the river and the fractured and karstified basement (Bailly-Comte et al. 2009). The com- bination of both groundwater and surface water floods can increase flood peak discharge by a factor two, if compared with the discharge predicted by hydrological modelling considering surface runoff only (Jourde et al. 2007). Over
small catchments, fast groundwater contribution to the flood yields specific discharges up to 5 m3/s/km2 (Camar- asa Belmonte and Segura Beltran 2001; Gaume et al. 2003); peak flood discharges of some watersheds (areas smaller than 100 km2) even seem to have exceeded 20 m3/ s/km2 during the 2002 floods in the Gard region, southern France (Gaume and Bouvier 2004; Delrieu et al. 2005; Gaume et al. 2009).
This work aims at a better understanding of the role of the karst in the flash floods of a Mediterranean river, within the specific context of the Lez karst watershed in which the groundwater resource is largely used to supply the potable water network of the city of Montpellier. A methodology is proposed to quantify the relative importance of the surface and the underground processes involved in flash flood genesis, based on the analysis of groundwater levels and discharge dynamics during selected flood events.
Note that the issues linked to the understanding of the flash floods of this Mediterranean river are very important both for the city of Montpellier and for the cities further downstream towards the coast, because of recurrent
inundations that caused cost effective damages during recent years (Dec. 2002, 2003 and Sept. 2005 floods in particular).
The karst hydro system
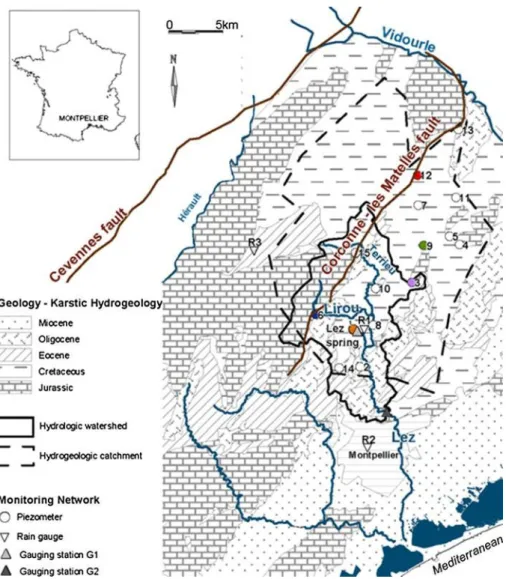
The Lez river is a 26-km long coastal river that flows through the city of Montpellier and reaches the Mediter- ranean Sea after a channel passage in the seafront lagoons (Fig. 1).
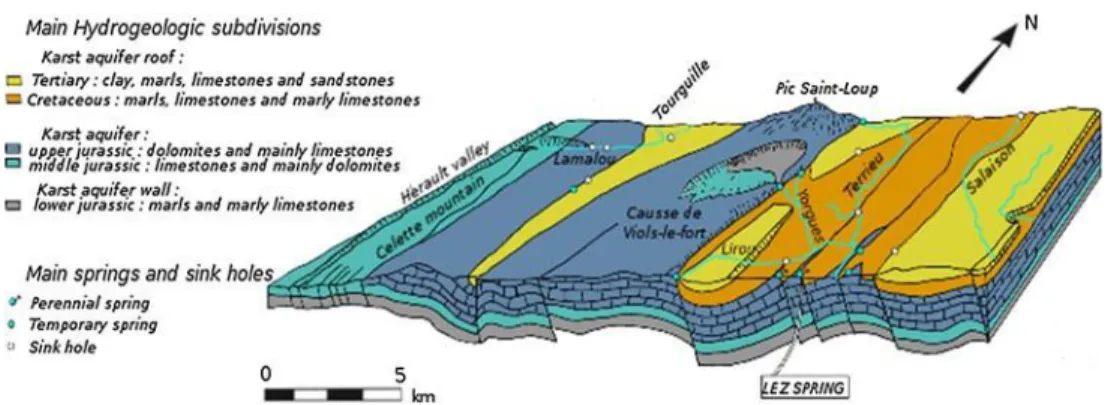
This river is fed by a karst spring located at a contact between the calcareous and marly levels, 10 km to the north of Montpellier (Fig. 1). The Lez spring is the seventh largest karst spring in France (Avias 1995). The karst aquifer that outcrops upstream of the Lez River watershed also gives rise to the main tributaries of the Lez River (the Lirou, Yorgues and Terrieu rivers). These temporary streams flow during heavy rainfall events. Most of their course is located within the calcareous, karstified and fractured part of the watershed (Fig. 2). Accordingly, their
Fig. 1 Hydrogeological and hydrological settings
Fig. 2 Schematic hydrogeological and
hydrological context of the karst hydro system, modified after Berard 1983
discharge is partly related to underground floods (when the water table increases beyond the elevation of the streams bed).
The particularity of this karst aquifer lies in the man- agement of the water resource, which consists in pumping water directly within the karst conduit at a depth under the level of the spring outlet (overflow level of the spring) extracting only part of the naturally renewable stock. Therefore, after a period where only the natural overflow of the spring was used, until 1965, water was pumped in the spring down to -6.50 m below the overflow level of the spring. This method allowed pumping 800 l/s for Mont- pellier water supply, even when the natural outflow of the spring was lower than 200 l/s (Avias 1995). When the needs of Montpellier increased above 800 l/s, four deep wells were drilled. These wells reached the karst conduit feeding the spring, 48 m below the overflow level of the spring (17 mASL). Pumping these wells allows up to 2,000 l/s to be withdrawn under low-flow conditions, while the average annual pumping flow rate is 1,100 l/s (1988–2009). This type of management is possible as long as the mean pumped flow rate does not exceed the mean annual discharge of the spring that is about 2,200 l/s (Avias 1992). Note that the natural spring discharge displays a high inter-annual vari- ability as highlighted by extreme values for the discharge (after Drogue 1974) monitored before pumping within the spring: in 1952 (dry year, 590 mm annual rainfall) the mean annual discharge of the spring was estimated to be 1.5 m3/s, while it was estimated to be 2.8 m3/s in 1962 (wet year, 1,150 mm annual rainfall).
Pumping flow rates and groundwater levels within the main karst conduit are monitored continuously (Montpel- lier Agglomeration/Veolia data). During low-flow condi- tions, when the pumping rates exceed the natural discharge of the karst aquifer, the water level in the karst conduit and in the spring pool drops below the overflow level of the spring. Pumping then causes a drawdown that can reach 30 m at the end of the low-water period, and the spring dries up (Fig. 3). Note that this large drawdown highly
modifies the local hydraulic gradient and is likely to increase the area of the hydrogeological catchment
(Fig. 1), when water level drops below the overflow level of the spring. During autumn and winter, the karst aquifer is recharged and its reserves are renewed. The water level in the karst conduit then rises above that of the pool.
The hydrogeological catchment of the Lez spring under anthropogenic forcing (Fig. 1) comprises Jurassic and Cretaceous karstified limestone formations. Relief alter- nates between calcareous plateaus (300–700 mASL) and marly plains (50–100 mASL). In the plains, limestone layers are covered by 200–800 m thick Valanginian marls and shallow soils (generally less than 1 m thick). Vegeta- tion is primarily made of scrubs on the causes and crops (vineyard, olive trees) on the plains. The boundaries of this large karst system, referred to as the Lez karst aquifer, are the He´rault River to the West and the Vidourle River to the North and East (Drogue 1963). The area of the hydrogeo- logical catchment under anthropogenic forcing is estimated to be 380 km2 (Thie´ry and Be´rard 1984) based on the geology, dye tracings and groundwater level dynamics. Most of the recharge occurs where limestone of the karst aquifer outcrops, which corresponds to a surface area of approximately 150 km2. Recharge also occurs through river losses (swallow holes) in the limestone and marly limestone layers, in particular along tectonic faults (Cor- conne-Les Matelles fault network, see Figs. 1, 2).
Measurements and methods
The groundwater dynamics is studied through the water table variations measured in piezometers located within the hydrogeological catchment of the Lez spring (Fig. 1). These groundwater level data are spatially interpolated to yield what is referred to as apparent piezometric surface. Indeed, a karst aquifer is characterized by highly hetero- geneous and anisotropic hydrodynamic properties related to the spatial distribution of the karst conduits within the less permeable rock matrix: any interpolation exercise should be taken with caution, in particular at small scale. For the purpose of this study, the interpolation is used to estimate the overall variation of the groundwater level
Fig. 3 a Cross section and b 3D Sketch of the Lez spring (modified after Avias 1992)
within the whole catchment. The Lez spring groundwater discharge is measured at the gauging station G1 (DREAL data). It gives information on underground flood dynamics. The reference point of the study is the discharge gauging station G2 (DREAL data) that corresponds to the hydro- logical watershed (HW-128 km2) of the Lez River at the entry of Montpellier (Fig. 1). The flood dynamics observed at G2 reflects the dynamics of the whole karst basin (river/ aquifer), as urban runoff does not influence the hydrograph. At this gauging station G2, the 10-year return period for the peak discharge is estimated at 280 m3/s and the 50-year return period discharge is about 420 m3/s. No value is
provided for the 100-year return period due to the low confidence in the discharge estimations.
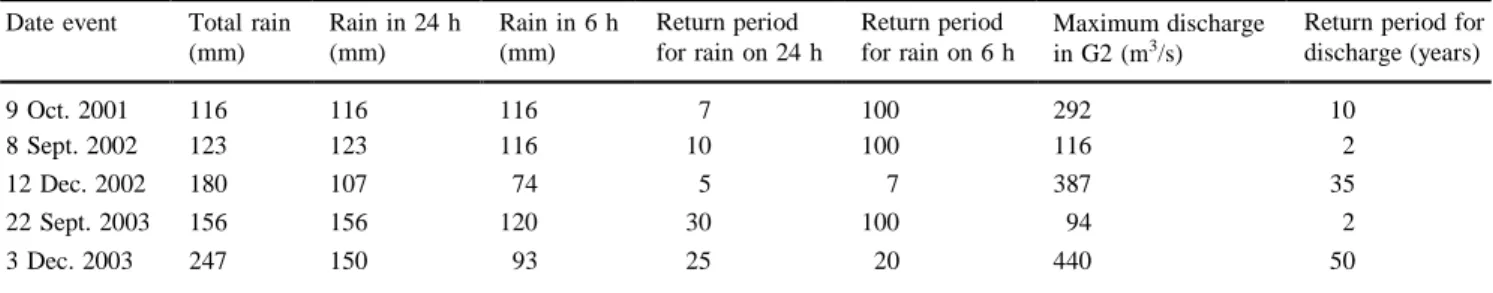
Six rainfall events that generated flash floods of the Lez River were analysed (Table 1). The selected episodes correspond to six major floods monitored between 2001 and 2005. This sample covers a wide range of peak flow (from 90 to 487 m3/s) and of hydrogeological conditions since three events occurred after a long period of drought (September 2002, 2003 and 2005) and the three others occurred after first rains or at the end of autumn (October 2001, December 2002 and 2003). The average rainfall over the hydrological catchment indicated in Table 1 is
Table 1 Rain and discharge values for the six flood events Date event Total rain
(mm) Rain in 24 h (mm) Rain in 6 h (mm) Return period for rain on 24 h Return period for rain on 6 h Maximum discharge in G2 (m3 /s)
Return period for discharge (years) 9 Oct. 2001 116 116 116 7 100 292 10 8 Sept. 2002 123 123 116 10 100 116 2 12 Dec. 2002 180 107 74 5 7 387 35 22 Sept. 2003 156 156 120 30 100 94 2 3 Dec. 2003 247 150 93 25 20 440 50
computed based on the spatial interpolation of daily rain- falls measured on a large network of meteorological sta- tions, much larger than the study area.
Results
To better explain and quantify the role of the karst aquifer in the Lez river flash floods, surface processes (runoff processes) are considered first and then underground pro- cesses (storage and overflow processes). Finally, the impact of high-rate pumping within the karst aquifer on flash flood mitigation is discussed.
Surface processes
With the aim to consider the surface processes, an apparent runoff coefficient is introduced that corresponds to the ratio between the surface flood volume calculated from the hydrograph measured at G2 gauging station and the rainfall volume precipitated on the hydrological watershed HW (Table 2).
These values of apparent runoff coefficient allow iden- tifying different types of flash floods:
• Floods with an apparent runoff coefficient below 0.25 (e.g. late summer flash floods of September 2002 and 2003). These values are in agreement with both the geological frame of the hydrologic watershed and the regional land use. From these values, it may be concluded that the flash floods of September 2002 and 2003 are mainly related to runoff processes. • Floods with intermediate values of the apparent runoff
coefficient (around 0.5) such as flash floods of October 2001 and September 2005. This slightly higher appar- ent runoff coefficient might be related to a significant karst groundwater contribution to surface flow. • Floods with large values of the apparent runoff
coefficient ([0.7) such as late Autumns flash floods (December 2002 and 2003). Groundwater contribution from the karst towards the main springs and tributaries (Lirou and Terrieu streams) of the Lez River is probably at the origin of such large apparent runoff coefficients. Actually, the amount of rainfall received by the hydrological catchment of the Lez River in G2 cannot produce such a high volume observed at the gauging station without a considerable contribution of
the springs and tributaries fed by the larger hydrogeo- logical catchment.
Note that rainfall events with comparable rainfall vol- umes on HW may yield very distinct flash floods (e.g. October 2001, September 2002 and 2003), which may be related to the rainfall spatial distribution and intensity. In September 2003, the south of HW (mainly constituted of marly impermeable terrains) receives most of the rainfall. This event is clearly related to surface processes such as runoff. In October 2001, for a rainfall volume slightly lower, the discharge at G2 gauging stations is three times as large as in the previous case. As most of the rainfall hits the north of HW constituted of fractured and karstic limestone, a significant part of the precipitation first infil- trates and then participates to the groundwater overflow towards the main springs and tributaries (Lirou and Terrieu streams) that feeds the Lez River. This may explain the quite larger apparent runoff coefficient determined for this later flood. The above analysis also implies that parameters such as the water table level and the initial saturation of the karst aquifer may play a major role in the flood intensity: previous rainfall events saturated the karst in October 2001 and the water table level was higher for this event than that for the September events.
Thus, it appears as fundamental to characterize the underground processes, given their apparent impact on flood discharge intensity.
Underground processes
Underground storage and overflow processes are investi- gated based on an estimate of the volume available for storage within the karst aquifer before each flood event.
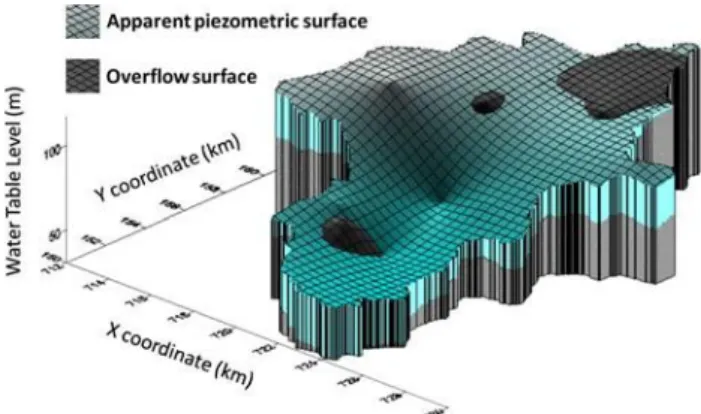
The apparent piezometric surface allows characterizing the degree of saturation of the karst aquifer and allows determining the volume available for storage while con- sidering the estimated effective porosity of the karst. This effective porosity is estimated based on the total volume pumped at the Lez spring and on the difference in the apparent piezometric surface during a given period free from rainfall precipitation. Then, the effective porosity of the karst aquifer is defined as the ratio between the pumped volume and the aquifer volume delimited by the two apparent piezometric surfaces corresponding to the begin- ning and the end of the period. The estimated effective porosity value is about 0.17 %.
Table 2 Apparent runoff coefficient (Cr) calculated at G2, 6 and 24 h after the last rainfall event, for the six events
October 2001 September 2002 December 2002 September 2003 December 2003 September 2005 Cr (?6 h) 0.38 0.16 0.76 0.13 0.65 0.39
V ( 10 6m 3 )
Fig. 4 Volume stored by the karst below (grey shading) and above (blue shading) the overflow surface for the December 2003 event, at the underground flood peak
The overflow surface of the karst basin refers to the interpolated surface going through the springs outflow levels and the bottom of the river tributaries (e.g. Fig. 4). Note that this overflow surface is different from the topo- graphic surface, both in shape and elevation (it is lower than the topography); however, it allows the determination of the volume of groundwater delimited by the hydrolog- ical watershed and temporarily stored within the karst (at the underground flood peak) before it is drained towards the main spring and tributaries.
Using the overflow surface, the boundaries of the hydrological catchment and the apparent porosity one can determine the volume that can be stored by the karst system (below the overflow surface) as well as the volume that overflows towards the surface drainage flow (above the overflow surface; Fig. 4).
For each event, the degree of saturation of the lower compartment (epiphreatic zone) of Lez karst aquifer is
estimated before the flash flood, and at the underground flood peak, based on the apparent piezometric surface and the overflow surface. Combined with the effective porosity value, this degree of saturation allows determining for each flood an estimated volume available for storage (volume between the overflow surface and the apparent piezometric surface) before each event, the volume of water above the overflow surface at the flood peak, and the estimated vol- ume of water stored within the epiphreatic zone (below the overflow surface) during the flood (Fig. 5).
To better assess the processes involved in the floods, the dynamics of underground and surface processes are ana- lysed for both the December 2003 event that occurred at the end of autumn when water table is high and the Sep- tember 2005 event occurring after a long period of drought.
Event of December 1st, 2nd and 3rd 2003
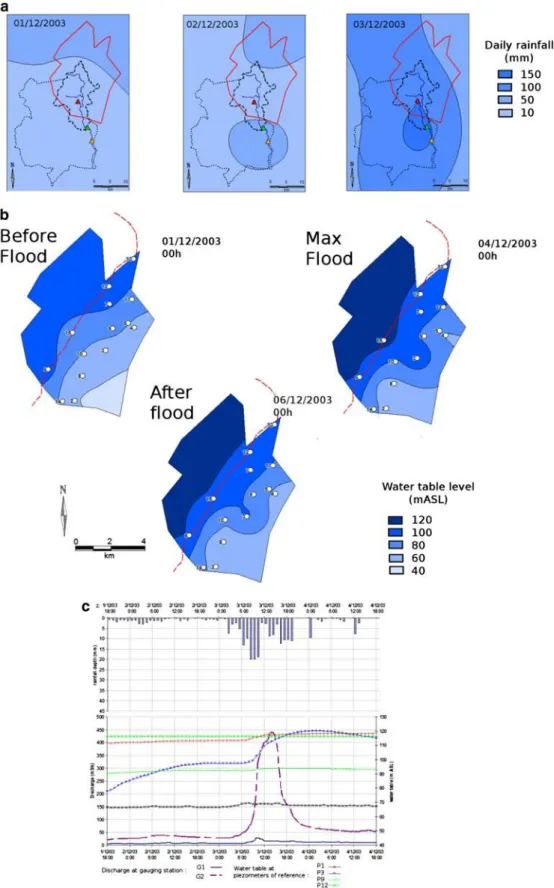
The main rainfall event, preceded by several days with a weak but continuous rain that saturated the soil, occurs on December 3rd. It consists of an intense storm which brings up to 167 mm of precipitation in 24 h over the city of Montpellier (Fig. 6a). On December 1st and 2nd, the rainfall depth is lower than 50 mm in 24 h, except in the extreme north of the hydrogeological catchment HC (where rapid infiltration probably occurs) and in the extreme south of HC (Fig. 6a). On December 3rd, the whole studied area receives more than 100 mm of rain in 24 h, and up to 150 mm in the south of the hydrologic watershed HW, north of Montpellier city.
The total volume of rain that falls on HW and HC during this event is about 83 9 106 m3, while it is about 28 9 106 m3 on the hydrologic watershed HW. It should be noted that these volumes are comparable to those
Fig. 5 Volume of water stored in the aquifer for the six studied events 8 10/2001 09/2002 12/2002 09/2003 12/2003 09/2005 7 6 5 4 3 2 1 0 BF PF BF PF BF PF BF PF BF PF BF PF
Volume available for storage (below the overflow surface) Vo
ume of water stored below the overflow surface during the flood
Volume of water above the overflow surface BF = State before the flood
calculated for the event of December 2002 that yet resulted in a much lower flood.
As for the event of December 2002, the initial water table level before the flood is rather high, and a quite uniform hydraulic gradient from 110 mASL in the north- west of HC to 70 mASL in the south-west of HC can be observed on the apparent piezometric map (Fig. 6a).
At the underground flood peak, the water table level exceeds 130 mASL in the north-western hydrogeological compartment and reaches 110 mASL in the central zone of the karst aquifer, in the vicinity of the Corconne-Les Ma- telles fault. Several piezometers become artesian (P6, P12 and P13), which indicates groundwater overflow towards the main streams and tributaries.
The hydrograph of the surface flood exhibits one peak, with a very high discharge that reaches 28 m3/s at gauging station G1 and 440 m3/s at gauging station G2 (Fig. 6b). The lag-time between the flood peak observed at gauging stations G1 (Lez River spring) and G2 is about 4 h. The flood starts on December 3rd, when the main rainfall event occurs; however, the general water table rise begins on December 1st (piezometer P12 becomes artesian), before the surface flood. The underground and surface flood dynamics (Fig. 6b) illustrates an upstream to downstream pressure transfer within the karst aquifer, before ground- water probably contributes to the surface flood as high- lighted by a water table level higher than the overflow surface (Fig. 5) although the flood peak occurs slightly after the surface flood peak.
In this case again, it may be seen that the karst system first absorbs part of the precipitation, which induces a general water table rise in the aquifer, and then contributes to surface flood by overflow towards the main outlet and drainage streams of the karst watershed that continues after the rainfall and the river flood peak in G2. The contribution by the outflow of the karst after the rainfall could be approached by the base flow, which remains around 60 m3/s.
Event of September 6th, 2005
This event occurs after several months of drought; it cor- responds to two violent storms on September 5th and 6th (Fig. 7a). The major rainfall event that occurred on Sep- tember 5th is located in the southern part of the hydrologic watershed HW, over the city of Montpellier. The second rainfall event that occurred on September 6th is located in the centre of HW that receives an exceptional rainfall depth (between 150 and 200 mm in 24 h). For this event, the discharge data at gauging station G1 are not available because the gauging station was damaged. The hydrograph
recorded at gauging station G2 exhibits several peaks. The largest flood peak occurred on September 6th, with an exceptional discharge for a September flood that reached about 487 m3/s (Fig. 7b). During this event, the total vol- ume of rain that falls on the cumulated HW and HC is about 97 9 106 m3, while it is about 35 9 106 m3 on the sole hydrologic watershed HW. These volumes are com- parable to those precipitated during the events of December 2002 and 2003.
When this rainfall event occurs, the groundwater levels are very low in the whole Lez aquifer as for the September 2003 event with a water table below 80 m ASL in the north-western hydrogeological compartment of the karst aquifer and below 50 m ASL in the south-eastern hydro- geological compartment (Fig. 7a) before the underground flood peak.
Note that for the first rainfall event on September 5th, there is no appreciable change in the water table level, which indicates that the precipitated rain is stored within the overlying unsaturated layers (soil, epikarst and non- saturated zone) of the karst aquifer.
After the rainfall of September 6th, the water table rise is rapid and concomitant with the Lez river flood, which highlights the rapidity of recharge and transfers towards the saturated zone of the karst basin; considering the fact that the system was particularly dry, it also shows the shortcuts from the surface through the epikarst and non-saturated zone; note that the underground flood peak is slightly delayed with respect to the surface flood peak at G2, as illustrated by the water table rise in piezometers P12 and P13 before they become artesian (Fig. 7b). The rapid water table rise recorded at most piezometers has large amplitude and is concomitant with the surface flood (Fig. 7c). This demonstrates the large and rapid storage in the epiphreatic zone of the karst aquifer before the water table level reaches the overflow levels towards the main outlet and drainage stream of the karst watershed, which is illustrated by the artesian phenomenon that occurred at several piezometers.
Discussion
For the flash flood events occurring after a marked drought (September 2003 and 2005), a large initial volume is potentially available for storage of infiltrated water within the unsaturated part of the hydro system but also in the epiphreatic zone of the karst aquifer whose influence is investigated in this study. On the other hand, for the late Autumn flash floods (December 2002 and 2003) when the water table level is high and the Lez spring flows, the volume potentially available for the storage of the infil- trated water in epiphreatic zone is much lower (Fig. 5).
These differences in the volume available for storage within the karst aquifer are related to the summer rain deficiency but also pumping within the karst aquifer.
Fig. 6 a Daily rainfall spatial distribution and b apparent piezometric surface over the Hydrogeological Catchment HC; c water table variations at piezometers of reference and discharge at G1 and G2 gauging stations for December 2003 event
Indeed, during the winter period water table is high and the karst aquifer is quite saturated due to autumnal rainfall, and less water is pumped for Montpellier water supply (about 80,000 m3/day). On the contrary, during the summer per- iod, the upper compartment of the karst aquifer is dried due to high evapotranspiration rates and pumping at the spring for Montpellier water supply increases by 50 % due to enlarged population related to tourism and water needs (up to 120,000 m3 are pumped daily). This generates large drawdown (up to 30 m) at the regional scale and the depleted aquifer is thus able to absorb a large part of infiltrated water in the epiphreatic zone, as illustrated by the volume available for storage before the flood (Fig. 5). Accordingly, the flash floods of September 2003 and 2005 are thus relevant for the assessment of the flood mitigation related to active groundwater management that generates large drawdown and thus large volume available for stor- age in the epiphreatic zone of the Lez karst aquifer at the end of the drought period (summer). Note that at this period of the year, especially when no noticeable precipi- tations occurred during summer, the upper compartment of the karst aquifer is dried due to high evapotranspiration rates, which allows storage of a large amount of the first rainfall events.
Consider the volume of water stored during the Sep- tember 2003 flash flood. This volume is lower than the volume available for storage before the flood. Therefore, the karst aquifer absorbs a large part of the infiltrated rainfall in the lower carbonate compartment of HW and water is stored within the epiphreatic zone; groundwater contribution to the surface flood does not occur as the overflow surface is not reached. As the stored volume is lesser than the volume available for storage before the flood, this indicates that discharge measured at gauging station G2 is mainly due to runoff and thus mainly the consequence of surface processes. It also means that the flash flood might have been much bigger without the storage of water within the karst aquifer. Indeed, compared with the October 2001 event, the rainfall volume during September 2003 is larger but the associated flood is three times lesser, which can be attributed to the fact that the overflow surface is not reached
For the flash flood of September 2005, the large rainfall event that occurs on both HC and HW generated a general water table rise in the karst aquifer (Fig. 7), which may induce overflow towards the main outlet and drainage streams of the karst watershed. This flash flood can be qualified of composite flood, as its genesis is the result of both surface and underground processes. Indeed, the rain- fall volume exceeds the initial volume available for storage within the karst aquifer (about 5.8 9 106 m3), which means that a large part of the rainfall volume was stored
within the karst system and also that a non negligible part of the rainfall volume overflows towards the main outlets and drainage streams (such as Yorgues, Lirou and Terrieu) of the karst watershed. This partly explains the high peak discharge measured at gauging station G2 (Fig. 7), but also signifies that the consequences of this flash flood might have been much worse without high-rate pumping within the karst aquifer. Therefore, this event could be taken as reference to quantify the flash flood mitigation related to water storage in the lower compartment of the karst aqui- fer, which noticeably increases the potential storage in the soil/epikarst zone at the end of the drought period (100– 150 mm).
On the contrary, the flash flood of October 2001, and especially the flash floods of December 2002 and 2003 are relevant for the evaluation of flood intensity when water table is high and groundwater may contribute to surface flood. Indeed, when the karst aquifer is saturated, there is a rapid and large hydrodynamic response of the aquifer to each rainy event, sometimes concomitant with discharge, with overflow phenomenon from the karst illustrated by artesian flow on several piezometers. For example, before the December 2002 flash flood, the volume available for storage in the epiphreatic zone of the aquifer is very low or nonexistent (Fig. 5), which prevents a possible mitigation of the flash flood by the karst system. As the overall water table (i.e. apparent piezometric surface) is high, the water coming from infiltration cannot be stored by the karst aquifer within the epiphreatic zone and the volume tem- porarily stored above the overflow surface is particularly large (about 4.5 9 106 m3); this is the consequence of a large subsurface flow within the epikarst towards the sur- face drainage network that contributes to the discharge in G2 when groundwater outflows in the main streams and tributaries occur.
Conclusion
The analysis of these six flood events shows that the volume available for storage before the flood in the epi- phreatic zone (and thus the saturation state of the karst aquifer) is an important factor considering the genesis of large flash floods in karst systems such as the Lez River watershed. When the karst is saturated, the rainfall gen- erates a general groundwater level rise above the overflow surface as no storage is available in the epiphreatic zone of the karst aquifer; this contributes to surface flood because of overflow towards the main outlet and drainage streams of the karst system. For these late autumn flash floods, both the absence of storage in the epiphreatic zone and likely groundwater contribution explain the much
larger peak discharge but also larger flood volumes measured at gauging station G2 than for the late summer flash floods. It also signifies that if a rainfall event, such as the September 2005 event, occurs in such conditions (saturated karst), it may generate a huge flash flood with possible large damages. On the contrary, when the karst aquifer is depleted due to high-rate pumping (late sum- mer), part of the precipitation can be stored in the epiphreatic zone of the karst below the overflow surface, which mitigates surface flood.
One can, therefore, identify different types of flash floods in a karst watershed based on different genesis processes:
(1) Hydrological flood mainly related to surface runoff processes over the hydrologic watershed.
(2) Composite flood corresponding to hydrological flood with flood mitigation related to water storage in the karst aquifer.
(3) Composite flood corresponding to hydrological flood combined with groundwater contribution from the karst aquifer to surface flood.
This later type of flash flood, which results from a combination of both underground and surface processes, can generate very high discharge because of the enlarge- ment of the catchment’s extent when the hydrological catchment becomes tributary from the hydrogeological catchment. Thus, the karst aquifer outcropping upstream of the Lez river watershed has a major impact on the Lez River flash floods. It is shown that karst groundwater can contribute to flash floods under certain conditions, while high-rate pumping within the karst aquifer, that generates significant drawdown, may act as a protection against these flash floods under other conditions. To assess the flood risk, the piezometer network might thus be used to determine the saturation state of the karst aquifer and better under- stand and anticipate the karst aquifer hydrodynamic response to the rainfall events (Roesch and Jourde 2006). In this way, the water table level measured in piezometers identified as representative of this saturation state might be considered both as an indicator for the flood risk and as a
References
Avias J (1992) Karstic aquifer of mediterranean type, geological controls: lez spring example (North Montpellieran karsts). IAH, Hydrogeol Selected Karst Reg 13:89–113
Avias J (1995) Gestion active de l’exsurgence karstique de la source du Lez. Hydroge´ologie 1:113–127
Bailly-Comte V, Jourde H, Pistre S (2009) Conceptualization and classification of groundwater–surface water hydrodynamic inter- actions in karst watersheds. J Hydrol 376:456–462
Berard (1983) Alimentation en eau de la ville de Montpellier. Captage de la source du Lez. Etude des relations entre la source et son re´servoir aquife`re. Rapport BRGM n 3, de´finition des unite´s hydroge´ologiques
Bonacci O, Ljubenkov I, Roje-Bonacci T (2006) Karst flash floods: an example from the Dinaric karst (Croatia). Nat Haz Earth Sys Sci 6:195–203
Camarasa Belmonte A, Segura Beltran F (2001) Flood events in Mediterranean ephemeral streams (ramblas) in Valencia region, Spain. Catena 45:229–249
Delrieu G, Ducrocq V, Gaume E, Nicol J, Payrastre O, Yates E, Kirstetter P, Andrieu H, Ayral P, Bouvier C (2005) The catastrophic flash-flood event of 8–9 September 2002 in the Gard Region, France: a first case study for the Ce´vennes- Vivarais mediterranean hydrometeorological observatory. J Hy- drometeorol 6(1):34–52
Drogue C (1963) Essais de de´limitation du bassin d’alimentation d’une re´surgence des karsts noye´s languedociens. Ann Speleol 18(4):409–414
Drogue C (1974) Etude hydroge´ologique des principales re´surgences de la re´gion nord montpellie´raine. Me´moire du CERH, Tome I, pp 61–121
Gaume E, Bouvier C (2004) Analyse hydro-pluviometrique des crues du Gard et du Vidourle des 8 et 9 Septembre 2002. La Houille Blanche 6:99–106
Gaume E, Livet M, Desbordes M (2003) Study of hydrological processes during the Avene river extraordinary flood (south of France): 6–7 October 1997. Phy Chem Earth 28(2003):263–267 Gaume E, Bain V, Bernardara P, Newinger O, Barbuc M, Bateman A,
Blasˇkovicˇova´ L, Blo¨ schl G, Borga M, Dumitrescu A, Daliako- poulos I, Garcia J, Irimescu A, Kohnova S, Koutroulis A, Marchi L, Matreata S, Medina V, Preciso E, Sempere-Torres D, Stancalie G, Szolgay J, Tsanis J, Velasco D, Viglione A (2009) A collation of data on European flash floods. J Hydrol 367:70–78
Jourde H, Roesch A, Guinot V, Bailly-Comte V (2007) Dynamics and contribution of karst groundwater to surface flow during mediterranean flood. Environ Geol 51:725–730
Najib K, Jourde H, Pistre S (2008) A methodology for extreme groundwater surge pre-determination in carbonate aquifers: groundwater flood frequency analysis. J Hydrol 352:1–15