HAL Id: hal-00656883
https://hal.archives-ouvertes.fr/hal-00656883
Submitted on 5 Jan 2012
HAL is a multi-disciplinary open access
archive for the deposit and dissemination of
sci-entific research documents, whether they are
pub-lished or not. The documents may come from
teaching and research institutions in France or
L’archive ouverte pluridisciplinaire HAL, est
destinée au dépôt et à la diffusion de documents
scientifiques de niveau recherche, publiés ou non,
émanant des établissements d’enseignement et de
recherche français ou étrangers, des laboratoires
Quantitative Analysis of Crack Closure Driven by
Laplace Pressure in Silica Glass
Gael Pallares, Antoine Grimaldi, Matthieu George, Laurent Ponson, Matteo
Ciccotti
To cite this version:
Gael Pallares, Antoine Grimaldi, Matthieu George, Laurent Ponson, Matteo Ciccotti. Quantitative
Analysis of Crack Closure Driven by Laplace Pressure in Silica Glass. Journal of the American Ceramic
Society, Wiley, 2011, 94, pp.2613-2618. �10.1111/j.1551-2916.2011.04471.x�. �hal-00656883�
Quantitative analysis of crack closure driven by Laplace pressure
in silica glass
Gal Pallares
1,2, Antoine Grimaldi
1, Matthieu George
1,∗,
Laurent Ponson
3and Matteo Ciccotti
1,4December 21, 2010
1 Laboratoire des Collodes, Verres et Nanomatriaux, CNRS, Universit Montpellier 2, France
2 CEA, IRAMIS, SPCSI, Grp. Complex Systems & Fracture, F-91191 Gif Sur Yvette, France
3 Division of Engineering and Applied Science, California Institute of Technology, Pasadena, CA
91125, USA
4 Laboratoire de Physico-Chimie des Polymres et des Milieux Disperss, CNRS, ESPCI, Paris, France
∗ email: mgeorge@univ-montp2.fr
Submitted to Journal of the American Ceramic Society
Abstract
Crack tips in silica glass in moist atmosphere are filled with an equilibrium liquid condensation of a few hundred nanometers length. Not only does this local environment affect the chemistry of slow crack propagation by stress corrosion, but it also has an important mechanical effect due to its highly negative Laplace pressure. The present article presents an original technique for measuring the physical properties
of the liquid condensation in terms of the Laplace pressure and critical condensation distance. This is achieved by combining in-situ atomic force microscopy (AFM) measurements of the condensate length and optical determination of the crack closure threshold in a double cleavage drilled compression (DCDC) specimen.
1
Introduction
Crack tips in silicate glasses in moist atmosphere are invariably filled with a stable liquid phase, mainly composed by water, due to the phenomenon of capillary condensation. This is due on one hand to the extremely hydrophilic nature of glass surfaces, that are generally perfectly wet by water, and on the other hand to the elevated stiffness of glass that makes cracks very sharp, the crack opening remaining limited to less than a few nanometers up to a distance of hundreds of nanometers to few microns. Macroscopic failure properties of materials being essentially governed by mechanisms taking place in the vicinity of the crack tip, such a liquid condensate has a potential for playing an important role on the propagation of the crack, in spite of its submicronic extension. First, it affects the chemistry allowing for crack propagation at low velocity by determining the local environmental condition for the stress-corrosion reactions at the crack tip. But it can also have a mechanical effect due to the highly negative Laplace pressure in the condensate that acts on the crack walls and is responsible for the closure of the crack when the stresses become lower than some threshold.
Although the presence of capillary menisci in glass fractures have been previously argued [?, ?] for elevated relative humidity, proper characterization by in-situ AFM measurements has been only recently achieved [?, ?]. An original application of AFM phase imaging techniques has made it possible to measure the length L of the condensate as a function of the stress intensity factor (SIF) K, that controls the crack opening profile1. For silica glass the condensation was shown to be at equilibrium with an
atmosphere of moist nitrogen and the critical condensation distance Hc was measured for several values
of the relative humidity [?]. Silica glass is particularly suited to investigate the physico-chemical properties of the capillary condensate since the stress-corrosion reaction does not involve corrosion products nor ion 1The symbol K will stand for the macroscopic mode I stress intensity factor. When making the difference between
exchange phenomena.
When measuring the K − L curves by AFM phase imaging as in Grimaldi et al [?], the range of measurable values is insufficient for estimating the Laplace pressure. It was shown that neglecting the mechanical effect of the Laplace pressure on the crack opening profile induces a bias in the estimate of the critical distance Hc which was limited to within 15% [?]. The present work presents an important
extension of the previous technique, which allows for the concomitant determination of both the critical condensation distance Hcand the Laplace pressure -∆P in the condensate2, and thus leads to a complete
unbiased characterization of the physical properties of the wetting liquid.
2
Mechanical effect of capillary forces
When a hydrophilic solid is in equilibrium with a moist atmosphere, capillary condensation is expected to fill all gaps which are smaller than a critical distance Hc, that can be related to the Kelvin radius and
to the wetting properties [?]. For a sharp crack with an opening profile f (X) this implies a condensation length L given by the condition (cf. Fig. ??):
f (X = L) = Hc (1)
Figure 1: Schematic representation of an open crack showing how a capillary condensate modifies the crack opening profile near the crack tip.
2The Laplace pressure -∆P (∆P > 0) is the difference between the pressure of the condensed liquid phase and the moist
atmosphere at equilibrium. The pressure in the condensate is assumed to be constant and independent of the crack profile geometry because its value is governed by the radius of curvature of the meniscus that is a function of relative humidity. In addition, the fluid is at rest in the condensate, insuring a homogeneous pressure.
When neglecting the effect of capillary forces, the crack opening profile can be modelled according to the Irwin solution3:
δ = 2uy(X, 0) = f (X) = 2K
E′
√ 8X
π (2)
where E′ is an effective elastic modulus4, X the distance from the crack tip and uy(X, 0) the elastic
displacement of the crack lips. Using relation (??) we obtain the following relation for equilibrium K− L curves: L(K, Hc) = π 8 ( E′Hc 2K )2 (3)
that was used by Grimaldi et al [?] to estimate Hc without knowing the Laplace pressure. This relation
has the form of an inverse square dependence of L on K and does not account for a closure threshold. Capillary forces can be modelled as the action of a constant internal negative Laplace pressure−∆P between the crack lips when the crack opening is less than a distance Hc:
σyy = −∆P δ≤ Hc 0 δ > Hc (4)
i.e. when the distance X from the crack tip is less than L. This internal force distribution is completely
equivalent to the Dugdale formalism for the cohesive zone in ductile fracture [?], and thus presents the same solutions. The solutions for the crack opening profile can be written as the superposition of two terms respectively related to the external and internal forces5:
3The Irwin solution is only valid in a close neighborhood of the crack tip, which is estimated to X < 15 µm in the
Appendix for our sample geometry. This is comfortably satisfied since the observed condensate lengths are always smaller than 4 µm.
4E′= E/(1−ν2) refers here to the plane strain Young’s modulus. Indeed, we make such an assumption in our 2D model since most of the measurements such as the crack closure conditions will be measured in the mid plane of the sample, where such plane strain conditions prevails. The characterization of the condensate properties at the free surface of the sample will be justified in the discussion part.
5The procedure used here closely follows the approach described in Lawn (1993) p. 59 [?]. The problem is solved as the
superposition of two solutions. The superscript ‘Ext’ refers to the solution where only the external forces are applied, i.e. the macroscopic forces applied to the sample grips, as in equation (??). The superscript ‘Int’ refers to the solution where only the internal forces are applied, i.e. the microscopic capillary forces acting between the crack lips. The superscript ‘Tot’ refers to the sum of these two solutions, which corresponds to the real problem. We should stress that the term KT ot
KT ot= KExt+ KInt uT oty = u Ext y + u
Int
y (5)
For small condensate length6, the contribution of the internal forces can be written as [?]:
KInt=− √ 2 π∆P ∫ L 0 dX √ X =−∆P √ 8L π X, L≪ c (6) uInty (X, 0) = KInt E′ √ 8X π − 1 2 KInt E′ √ 8L π √ X L − 1 2 ( 1−X L ) ln √ X L + 1 √ X L − 1 (7)
The new condensation length can be obtained by applying the condition (??) to these new solutions7.
The equilibrium KExt− L curve becomes:
2uy(L) = 2KExt+ KInt E′ √ 8L π = Hc (8)
This modelling predicts a crack closure threshold K0when the condition KT ot= KExt+ KInt= 0 is
satisfied, i.e. KInt=−KExt=−K0. By combining Eqs. (??) and (??), the threshold can be expressed as:
K0= √
E′Hc∆P (9)
This can be easily related to the adhesion energy [?]:
G0= w = ∫ ∞ 0 σyyduy = ∫ Hc 0 ∆P duy = ∆P· Hc (10)
by using the equivalence G0 = K02/E′. At crack closure, the condensate length assumes a maximum value Lmaxgiven by:
Lmax=π 8 E′Hc ∆P = π 8 K02 ∆P2 (11)
Let us note that the leading term proportional to√X in the development of the crack profile vanishes
at the onset of crack closure, so that the crack opening evolves as uy(X)≃ KEExt′ π2 X3/2
L in the vicinity of
corresponds to the loading felt by the silica at the crack tip.
6This corresponds to the small size yield approximation of the Dugdale model. The domain of validity of this
approxi-mation is L < 15 µm (cf. Appendix), which is also satisfied.
the tip (X << L) for KExt= K0. We remark that K0 and Lmax naturally constitute two characteristic
values for K and L, emerging from the values of E′, Hc and ∆P . The KExt− L curves (??) can thus be
expressed in an elegant dimensionless form8:
L Lmax = KExt K0 − √( KExt K0 )2 − 1 2 (12)
In the limit of large loadings (KExt>> K0), we recover from this formula the variations of L∝ 1/KExt2
found when the mechanical effect of the condensate is neglected (Eq. ??). As discussed previously, it is difficult to adjust both parameters by only using the KExt−L curves determined by AFM phase imaging.
However, if the closure threshold K0 is measured independently, it is then easy to adjust the parameter
Lmax on the KExt− L curves. This allows to have an unbiased and robust measurement of both the
critical condensation distance Hc and the Laplace pressure according to the inverse relations:
∆P = K0 √ π 8Lmax Hc =K0 E′ √ 8Lmax π (13)
3
Experimental procedure and results
3.1
In-situ monitoring of slow crack propagation
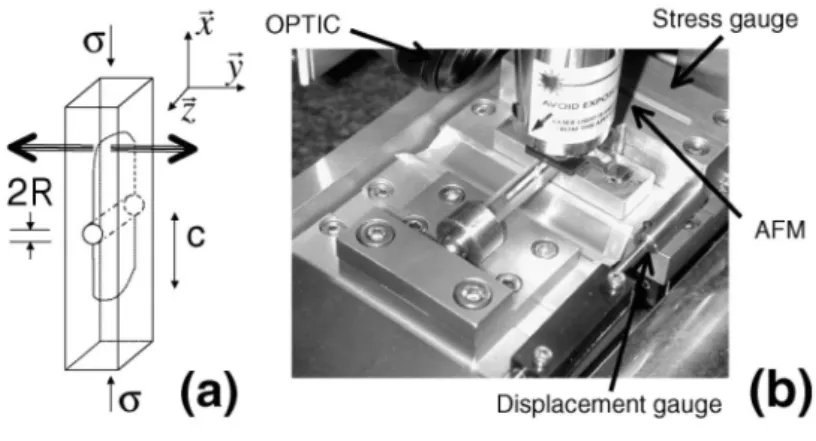
Fractures are initiated and propagated on a DCDC setup [?] at a constant temperature of (25.5±0.5)◦C in
a leak-proof chamber under an atmosphere composed of air and water vapor at a given relative humidity level RH = (39± 2)%. The parallelepipedic DCDC samples (4x4x40 mm3, with 10 µm tolerance) of pure silica glass (Suprasil 311, Heraeus, Germany) were polished to a RMS roughness of 0.25 nm (for an area of 10x10 µm2) and a hole of radius R = 0.5 mm was drilled at their center to trigger the initiation of
8Multiplying equation (??) by ∆p we obtain:
E′Hc∆P = (2KExt+ KInt)∆P √
8L
π K2
0 = (2KExt+ KInt)(−KInt)
KInt2 + 2KIntKExt+ K02= 0
KInt=−KExt+ √ K2 Ext− K 2 0=−∆P √ 8L π
two symmetric fractures of length c shown in Fig. ??. The hole’s radius is evaluated precisely for each sample by optical microscopy.
Figure 2: Experimental setup: (a) Sketch of the DCDC geometry; (b) picture of the experiment.
For an applied external compressive stress σ, the SIF KExtis determined as a function of the crack
length according to the Eq. (??) in the Appendix. By coupling optical and atomic force microscopy (Nanoscope 3a, Veeco Metrology Inc, Santa Barbara, CA), the crack propagation velocity can be measured from 10−5 m/s down to 10−12 m/s. The details of the technique can be found in [?].
3.2
Measurement of condensate length by AFM phase imaging
AFM observations are done in tapping mode with AFM tips having a nominal radius of Rtip ∼ 10 nm
(DNP, MPP-11100-10, Veeco Metrology Inc, Camarillo, CA). The tip is oscillated at constant frequency
ω (close to the resonance frequency ω0). The oscillation amplitude A is kept constant to a set value thanks to a feedback loop controlling the vertical position of the scanner. The phase delay (ϑ∈ [−π : 0]) between the stimulation and the oscillation of the tip can be related to the energy ED dissipated per
cycle by the tip-surface interactions [?]:
ED= πkA2 Q ( −A A0 sin ϑ− ω ω0 ) (14)
where k, Q, A0 are respectively the stiffness of the AFM cantilever, the quality factor, and the free
resonance amplitude. Fig. ?? shows typical height and phase images of the crack tip. The crack plane intersects perpendicularly the observed external surface of the sample. The region along the crack, characterized by a strong phase contrast, corresponds to the portion of the crack cavity which is filled by
(b)
(a)
Condensate length
Figure 3: Typical AFM height (a) and phase (b) images of the crack tip for a fracture propagating from top to bottom of the image (400x400 nm2). The scale range is respectively 5 nm and 5◦.
a condensed liquid phase. According to Eq. (??), the phase contrast on the condensate region corresponds to an increase in the energy dissipated by the tip-sample interaction [?]. Under humidity, the presence of thin water films on both the external sample surface and the AFM tip entails energy dissipation due to the combination of two phenomena: (1) the formation and rupture of a capillary bridge at each oscillation of the AFM tip [?] and (2) the visco-elastic displacement in the thin films [?]. The dissipated energy is very weak when scanning the glass surface, but it is greatly enhanced when the AFM tip crosses a portion of the crack tip filled with liquid water [?]. The resolution of the AFM technique does not allow to measure the opening of the crack accurately (a few nanometers here), but it allows to measure the length
L of the condensed region, ranging between 100 nm and 400 nm in our experiments, with an incertitude
lower than 10 nm. Each estimate of the condensate length L is the average of three measurements on images with an optimized scan size. The measurement was shown not to be dependent on the AFM working conditions, nor on the details of the AFM tip shape and its chemical nature within the given incertitude. The weak crack propagation velocity during the test was previously shown not to affect the equilibrium length of the condensate [?]. In order to avoid aging phenomena and to provide an optimum mode I loading condition, it is preferable to make each determination of the KExt− L curve on a new
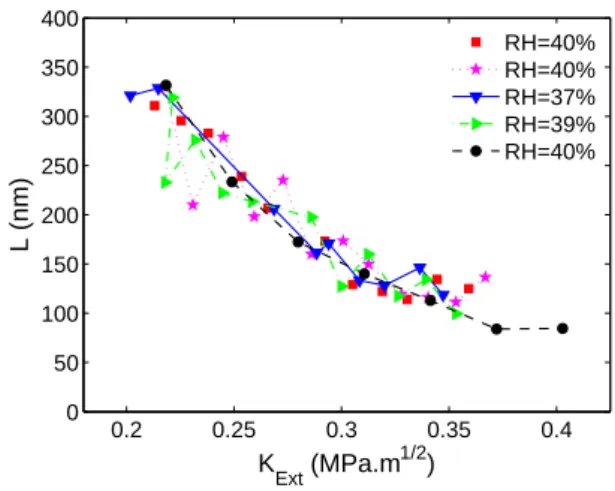
specimen just after the crack initiation. The results are reported in Fig. ?? for five different samples and we remark an excellent reproducibility.
0.2 0.25 0.3 0.35 0.4 0 50 100 150 200 250 300 350 400 K Ext (MPa.m 1/2 ) L (nm) RH=40% RH=40% RH=37% RH=39% RH=40%
Figure 4: Condensate length L as a function of the stress intensity factor KExtobtained by AFM.
3.3
Measurement of crack closure threshold by optical microscopy
It is well known that when the external stresses are reduced below some threshold, cracks in glass are observed to progressively close [?, ?]. In order to perform the measurement of the crack closure by using the same loading setup and the same environmental conditions as for the KExt− L curves, we can use
the optical microscope associated to the AFM system. When measuring KExt− L curves, the crack front
is vertical in order to image the crack tip by AFM at the free surface of the sample (cf. Fig. ??). In order to observe the crack closure, the DCDC sample is rotated by 90◦, the fracture front laying horizontally according to Fig. ??. The white light source illuminates the sample vertically, after passing through the optical axis of the CCD camera and after being reflected by an inclined mirror in the AFM head. The field of view of the camera is 920 µm and the resolution is limited by the pixel size to 10 µm.
σ σ
2R
c
Figure 5: Sketch of the DCDC sample arranged to observe the crack closure by optical microscopy (horizontal crack plane)
For the same reasons discussed for KExt− L curves, it is again preferable to make each determination
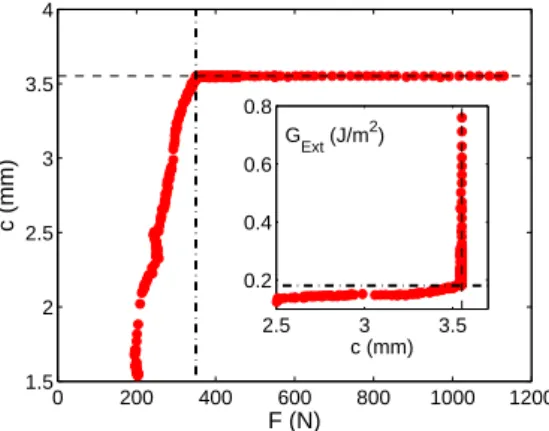
of the closure threshold on a new specimen just after the crack initiation. The new crack is propagated for a convenient crack length (c > w = 2 mm) until the propagation velocity becomes less that 10−9 m/s, in order to avoid any further optically observable propagation during the measurement. Then, we continuously decrease the stress to a rate of 0.12 MPa/s and monitor the evolution of the crack front position, and thus the crack length, with an acquisition frequency of 1 image/second as reported in Fig.
??. 0 200 400 600 800 1000 1200 1.5 2 2.5 3 3.5 4 F (N) c (mm) 2.5 3 3.5 0.2 0.4 0.6 0.8 c (mm) G Ext (J/m 2)
Figure 6: Evolution of the apparent crack length c as a function of the external decreasing load F . In the inset the same data are plotted in terms of the strain energy release rate GExt= KExt2 /E′ as a function
of the apparent crack length c (NB: the axes are switched because c should now be considered as the independent variable). The crack closure threshold G0 corresponds to the intersection between the two
regimes.
According to the modelling proposed in section ??, the crack opening profile undergoes two regimes: in a first stage of the unloading the crack length will remain constant, while the crack opening profile is progressively reducing and the condensate length is increasing. When the external SIF reaches the threshold value K0, the contribution of internal and external forces is perfectly balanced, the crack tip
singularity vanishes and the condensate length assumes the maximum value Lmax. By further decreasing
the external load the system enters another regime where the crack closes progressively. The threshold value K0 is then accurately determined by measuring the load and the crack length9 at the transition
9The exact position of the crack tip can not be perceived optically since the reflectivity of the glass-water interface is
point (Fig. ??). The average over three tests in moist atmosphere with RH = (40± 3)% is:
K0= (0.114± 0.006) MPa.m1/2 G0= (180± 20) mJ/m2
where we used the elastic moduli of silica glass10 E = (72± 2) GPa and ν = (0.170 ± 0.005).
3.4
Estimate of the Laplace pressure
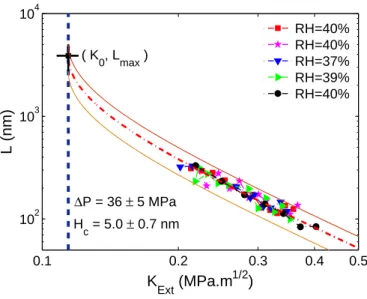
Although none of the previous techniques allows the complete solution of the problem, their combination does. Indeed, we can insert the measured value of K0 = (0.114± 0.006) MPa.m1/2 into equation (??) and adjust the single missing parameter Lmax on the KExt− L curves. The fit is well conditioned and
the result is shown in Fig. ??. We find:
Lmax= (4± 1) µm
By using equations (??) we determine the values of the critical distance Hcand of the Laplace pressure
∆P :
Hc= (5.0± 0.7) nm ∆P = (36± 5) MPa
4
Discussion and Conclusion
Although several measurements exist in the literature for the closure threshold in glass [?, ?, ?, ?], it is the first time that they are combined with an in-situ observation of the length of a liquid condensate. This allows us providing both a sound physical interpretation of the crack closure phenomenon and a complete characterization of the physical parameters of the wetting liquid in terms of its Laplace pressure and critical condensation distance.
10Silica glass is known to exhibit non-linear elastic deformation according to [?]:
∆E
E = (1 + 5.75ϵ)
However, in the present analysis the crack tip stresses are limited by the Laplace pressure ∆P∼ 40 GPa (ϵ ∼ 0.05%). The maximum effect on the elastic modulus is thus of the order of 0.3%, which is negligible for our purposes.
0.1 0.2 0.3 0.4 0.5 102 103 104 K Ext (MPa.m 1/2 ) L (nm) RH=40% RH=40% RH=37% RH=39% RH=40% ( K 0, Lmax ) ∆P = 36 ± 5 MPa H c = 5.0 ± 0.7 nm
Figure 7: Fit of the KExt− L curve according to equation (??). The AFM measurements of Fig. ?? are
combined with the optical measurements of the threshold K0 (vertical dashed line). The black square
symbol corresponds to the estimated value of Lmax.
The value of the adhesion energy G0= (180± 20) mJ/m 2
is in good agreement with other determina-tions in the literature ranging between 100 and 200 mJ/m2(ibid.), which are generally roughly compared
to the energy required to create two water surfaces (2γw∼ 144 mJ/m2). According to more sophisticated
modeling [?], the adhesion energy in perfect wetting conditions is expected to exceed the surface tension term.
Our simple modelling accounts for the crack closure by the action of capillary forces and it neglects other kinds of interactions between the solid surfaces. This is also in agreement with the observed independence of the closure threshold on the glass nature [?], and with similar conjectures formulated by Rayleigh [?] and Lawn et al. [?]. Several other interpretations of the crack closure have been proposed ranging from hydrogen bond interaction between adsorbed water molecules to alkali ion bridging or partial reformation of SiOSi bonds between opposite crack surfaces [?]. However, they result from observations of the crack closure behavior on alkali containing glasses after several aging or thermal treatments. The present study avoids all ambiguity since it is performed on freshly fractured silica glass samples in very clean conditions. Although the cracks were produced by stress-corrosion, no corrosion products are expected at ambient conditions in silica since the silanol groups remain bonded to the crack walls and our KExt− L measurements were stable on several days periods. In a previous paper [?], we reported
larger values for the condensate length and critical distance, but these were taken on a sample that had been aged for one year in primary vacuum. A detailed study of the aging behavior is out of the scope of the present work and will be published later.
It is the first time that the Laplace pressure is measured for a capillary condensation inside a crack tip. We remark that the reported value ∆P = (36± 5) MPa corresponds to a very negative pressure inside the liquid phase and the remarks given above suggest that this condensed phase is very close to pure water. The stability of this phase is provided by the high degree of confinement which prevents nucleation of vapor bubbles [?]. Although the largest reported measured negative pressures are around -140 MPa [?], the most reliable ones are around -20 MPa [?]. By combining this technique with a low humidity environmental chamber, it will be possible to obtain important data on the behavior of water at very negative pressure [?, ?].
An important remark concerns the opportunity of comparing KExt− L curves that are measured
at the sample surface with threshold measurements performed by observing the crack front in the bulk of the sample. Our modelling of the mechanical behavior of the DCDC sample, and in particular, the determination of the value of SIF, has been performed by a two dimensional plane strain analysis, which describes accurately the behavior in the bulk of the specimen. However, the recent application of digital image correlation techniques to the measurement of the surface displacement fields near the crack tip in our DCDC specimens have shown en excellent agreement between the values of the stress intensity factor determined at the surface and the values determined by a macroscopic determination according to two dimensional models of the DCDC sample [?].
Incidentally, we remarked a significant hysteresis between the closure and reopening behavior of the crack as previously observed in Refs. [?, ?, ?]. Moreover, while our equilibrium modelling would predict a constant stress intensity factor during the progression of the crack closure, a decrease of the threshold is observed during the closure at constant load rate (cf. Fig. ??), followed by a progressive increase when the loading process is arrested. These observations suggest the presence of irreversible processes that are not simply related to a velocity dependence as suggested in [?]. For that reasons, we limited our determinations of the threshold to the onset of the first closure, while leaving these interesting observations to future investigations.
are intimately related to capillary forces. The elevated stiffness of these materials along with the high degree of chemical inertness of silica glass have allowed original and reproductible measurements of the condensate length. This precious ingredient, combined with the measurement of the adhesion energy through the crack closure threshold, allows obtaining an estimate of the Laplace pressure, and thus a complete characterization of the physical properties of the condensed phase.
Acknowledgement
We thank E. Charlaix, M. Flemming and T. Fett for fruitful discussion. This work was supported by the ANR Grant “Corcosil” No. ANR-07-BLAN-0261-02. L. Ponson is supported by the European Union through the “Phycracks” Marie Curie fellowship.
Appendix: 2D modelling of the DCDC specimen and small
con-densate approximation
For a DCDC specimen of dimensions 2w×2t×2ℓ, containing a hole of radius R and two symmetric cracks of length c (cf. Fig. ??), the stress intensity factor KExtcaused by the external loading σ = F/4wt can
be accurately approximated by the following dimensionless expansion in terms of the ratios c/R and w/R [?]: σ√πR KExt = [ C0+ C1 w R + C2 (w R )2] + [ C3+ C4 w R+ C5 (w R )2] c R (15)
with the set of parameters: C0 = 0.3156, C1 = 0.7350, C2 = 0.0346, C3 =−0.4093, C4 = 0.3794, and
C5=−0.0257 for 2.5 ≤ w/R ≤ 5 and w < c < ℓ − 2w. For our geometry, this reduces to:
σ√πR KExt
= 3.547 + 0.650c
R (16)
In the absence of internal forces, the crack opening profile was shown [?] to be described by a fifth order Williams expansion [?] with 1% accuracy when X < 0.85 w = 1.7 mm:
uy(X) =KI E′ √ 8 π √ X ( 1 + 1.319 ( X w ) + 0.515 ( X w )2) . (17)
This expression remains valid as far as the effects of the finite size of the specimen are not relevant, i.e. for 2.5 w− R < c < L − 2.3 w − R. The range of 1% validity of the first order term, corresponding to the Irwin equation (??) used in the present work, is thus X < 0.0076w = 15 µm [?].
The stress intensity factor caused by a generic distribution of internal forces along the crack faces can be calculated according to the weight function procedure developed by Bueckner [?]:
KInt= ∫ c
0
h(c, X)σyy(X) dX (18)
where the weight function h(c, X) does not depend on the stress distribution, but only on the geometry of the specimen. The mode I weight function for the DCDC geometry were approximated by Fett et al. [?] by finite element simulation, and can be rewritten according to our formalism:
hI(c, X) = √ 2 πX ( 1 + D(I)1 X c + D (I) 2 ( X c )2) (19) where DI
1 and D2I were fitted by the following development in the range 0≤ c/R ≤ 8:
D(I)1 =−3.97 + 1.466c R + 4.533 exp ( −0.291c R ) (20) D2(I)=−0.246 + 0.222c R + 0.529 exp ( −2.08c R )
In our measurements the crack length ranges between 3 and 5 mm, corresponding to c/R ranging between 5.66 and 9.43. Although the upper end is slightly higher than the domain where the former development where adjusted, the behavior of the equations (??) is quite linear near c/R = 8. It is thus sound to extrapolate for estimate purpose the values D(I)1 = 10.152 and D(I)2 = 1.848 that correspond to
the largest corrections. The range of 1% validity of the small condensate approximation, corresponding to the first term of equation (??) is thus X < 15 µm for our DCDC geometry. Since this domain of validity is always larger than the condensate length, this justifies the use of a global first order approximation in all our modelling.
References
[1] Crichton SN, Tomozawa M, Hayden JS, Suratwala TI, Campbell JH (1999) Subcritical crack growth in a phosphate laser glass. J Am Cer Soc 82:3097
[2] Lawn B (1993) Fracture of Brittle Solids. Cambridge University Press 2nd ed, Cambridge.
[3] Wondraczek L, Dittmar A, Oelgardt C, C´elari´e F, Ciccotti M, Marli`ere C (2006) Real-time observa-tion of non-equilibrium liquid condensate confined at tensile crack tips in oxide glasses. J Am Ceram Soc 89:746
[4] Ciccotti M, George M, Ranieri V, Wondraczek L, Marlire C (2008) Dynamic condensation of water at crack tips in fused silica glass. J Non-Crist Solids 354:564
[5] Grimaldi A, George M, Pallares G, Mali`ere C, Ciccotti M (2008) The crack tip: a nanolab for studying confined liquids. Phys Rev Lett 100:165505
[6] Ciccotti M, Pallares G, Ponson L, Grimaldi A, George M (2009) Mechanical effect of capillary forces in the crack tip of a DCDC specimen. Proceedings of the 12th International Conference on Fracture, July 12-17, 2009, Ottawa, Canada
[7] Charlaix E, Ciccotti M (2010) Capillary condensation in confined media. Handbook of Nanophysics: Principles and Methods. Ed. Klaus Sattler, CRC Press 12–1
[8] Dugdale DS (1960) Yielding of steel sheets containing slits. J Mech Phys Solids 8:100
[9] Burns SJ, Lawn B (1968) A simulated crack experiment illustrating the energy criterion. Int J Fract Mech 4:339
[10] He MY, Turner MR, Evans AG (1995) Analysis of the double cleavage drilled compression specimen for interface fracture energy measurements over a wide range of mode mixities. Acta Metall Mater 43(9):3453
[11] C´elari´e F (2004) Ph.D. thesis, Universit´e Montpellier 2, France
[12] Cleveland JP, Anczykowski B, Schmid AE, Elings VB (1998) Energy dissipation in tapping-mode atomic force microscopy. Appl Phys Lett 72:2613
[13] Zitzler L, Herminghaus S, Mugele F (2002) Capillary forces in tapping mode atomic force microscopy. Phys Rev B 66:155436
[14] Nony L, Cohen-Bouhacina T, Aime JP (2002) Dissipation induced by attractive interaction in dy-namic force microscopy: contribution of adsorbed water layers. Surf Science 499:152
[15] Michalske TA, Fuller ER, (1985) Closure and repropagation of healed cracks in silicate glass. J Am Ceram Soc 68:586
[16] Stavrinidis B, Holloway DG (1983) Crack healing in glass. Phys Chem Glasses 24:19
[17] Brckner R (1970) Properties and structure of vitreus silica. J Non-Cryst Solids 5:123
[18] Wiederhorn SM, Townsend PR (1970) Crack healing in glass. J Am Ceram Soc 53:486
[19] Wan KT, Smith DT, Lawn BR (1992) Fracture and contact adhesion energies of mica mica, silica silica, and mica silica interfaces in dry and moist atmospheres. J Am Ceram Soc 75:667
[20] Rayleigh L (1937) Optical contact. Nature 139:781
[21] Israelachvili JN (1985) Intermolecular and Surface Forces. 2nd edition, Academic Press, New York
[22] Zheng Q, Durben DJ, Wolf GH, Angell CA (1991) Liquids at large negative pressures - water at the homogeneous nucleation limit. Science 254:829
[23] Caupin F, Herbert E (2006) Cavitation in water: a review. CR Physique 7:1000
[24] Yang SH, Nosonovsky M, Zhang H, Chung KH (2008) Nanoscale water capillary bridges under deeply negative pressure. Chem Phys Lett 451:88
[25] Caupin F, Herbert E, Balibar S, Cole MW (2008) Comment on ’Nanoscale water capillary bridges under deeply negative pressure’ [Chem Phys Lett 451 (2008) 88]. Chem Phys Lett 463:283
[26] Han K, Ciccotti M, Roux S (2010) Measuring Nanoscale Stress Intensity Factors with an Atomic Force Microscope. EPL 89:66003
[27] Pallares G, Ponson L, Grimaldi A, George M, Prevot G, Ciccotti M (2009) Crack opening profile in DCDC specimen. Int J Fract 156:11
[28] Williams ML (1957) On the stress distribution at the base of a stationary crack. ASME J Appl Mech 24:109
[29] Bueckner HF (1970) A novel principle for the computation of stress intensity factors. Z Angew Math Mech 50:529
[30] Fett T, Rizzi G, Guin JP, L´opez-Cepero JM, Wiederhorn SM (2009) A fracture mechanics analysis of the double cleavage drilled compression test specimen. Eng Fract Mech 76:921