Creating Value with Industry 4.0
ByGitarthi Medhi
B.Tech in Production Engineering, National Institute of Technology, Trichy, 2008
SUBMITTED TO THE FACULTY IN PARTIAL FULFILLMENT OF THE REQUIREMENTS FOR THE DEGREE OF
MASTER OF SCIENCE IN ENGINEERING AND MANAGEMENT AT THE
MASSACHUSETTS INSTITUTE OF TECHNOLOGY JUNE 2016
@2016 Gitarthi Medhi. All rights reserved.
The author hereby grants to MIT permission to reproduce and to distribute publicly paper and electronic copies of this thesis document in whole or in part in any
medium now known or hereafter created.
Signature of Author:
Certified by:
Accepted t
Signature redacted
Gitarthi Medhi System Design and Management Program, May 2016Signature redacted__
David Simchi-Levi, Thesis Supervisor
Professor of Engineering and Society
,q sacus l~isu'of Techuoilngy
)y:
Signature redacted
MASSACHUSETTS INS UTE OF TECHNOLOGY
OCT
2
6
2016
LIBRARIES
ARCHIVES
Patrick Hale, Director System Design and Management ProgramCreating Value with Industry 4.0
ByGitarthi Medhi
Submitted to The Faculty in partial fulfillment of the requirements for the degree of Master of Science in Engineering and Management at the Massachusetts Institute of
Technology, June 2016 ABSTRACT
We are in the age of Industry 4.0. Evolution and advancements in information and communication technology, sensors, Big Data, the Internet of Things, 3D printing, cloud computing, robots and mobile internet are some of the key technology areas that will digitize the value chains in various industries. The benefits are expected to be enormous along all value dimensions: efficiency, flexibility, quality, larger
product selection and unique customer experience.
The goal of this thesis is to understand and explore how adoption of Industry 4.0 technologies will impact and transform the functions of a value chain. Research consists of extensive study of industry case studies from leading providers, research papers, industry reports and journals. This thesis analyzes current applications and benefits of Industry 4.0 technologies and their impacts. It also explores risk and barriers of technology adoption by researching industry examples.
The outcomes of the thesis
are-- A "Benefit-Impact Mapping Framework" to capture the how implementation Industry 4.0 technologies can impact organizations.
- A "Conceptual Framework" to assist in strategic decision making for adoption of Industry 4.0.
Thesis Supervisor: David Simchi-Levi
Title: Professor of Engineering Systems Institute for Data, Systems, and Society, Massachusetts Institute of Technology
Acknowledgements
I am very grateful to Professor David Simchi-Levi for giving me the opportunity to work on this research project and for his continued support and guidance as my thesis advisor.
I would like to extend my gratitude to the PwC team -Constantine Vassiliadis, PhD, Senior Manager and W. Brad Householder, Principal -Management Consulting for their guidance and insights on defining the scope of this thesis.
I would like to thank Interscope Records giving me insights about the impact of technology in the music industry.
My sincere thanks to Mr. Pat Hale and the entire SDM staff for making my SDM experience so rewarding. A special thanks to my SDM friends, working with them has been a truly enriching experience.
Lastly, I would like to thank my family for their constant support and encouragement.
[This page has been intentionally left blank]
Table of Contents
1.1: INDUSTRIAL REVOLUTIONS ... 12
1.2: DEFINING INDUSTRY 4.0 ... 13
1.3 LITERATURE REVIEW ... 15
1.3.1: CURRENT STATE OF INDUSTRY 4.0... 15
1.3.2: THREE MAIN CLASSIFICATIONS ... 18
1.4: PRIMARY RESEARCH OBJECTIVES... 20
CHAPTER 2: TECH NO LOGIES OF INDUSTRY 4.0 ... 21
2.1 INDUSTRY 4.0 ENVIRONMENT:... 21 2.2 TECHNOLOGIES OF INDUSTRY 4.0 ... 22 2.2.1 INTERNET OF THINGS... 22 2.2.2 BIG DATA ... 23 2.2.3 ANALYTICS...25 2.2.4 3D PRINTING ... 28 2.2.5 RO BOTS ... 29 2.2.6 AUGMENTED REALITY ... 29
CHAPTER 3: INDUSTRY CASE STUDIES... 3 1 3.1 INTRODUCTION... 31
3.2 Tw o M AIN OUTCOMES ... 31
3.2.1 CASE STUDY 1: MANUFACTURING AT INTEL - PREDICTIVE MAINTENANCE ... 32
3.2.2 CASE STUDY 2: ADOBE SYSTEMS- TARGETED M ARKETING... 35
3.2.3 CASE STUDY 3: ALLIANDER (2013) -PREDICTING FLUCTUATING ENERGY DEMAND...37
3.2.4 CASE STUDY 4: ARI -IMPROVING OPERATIONAL EFFICIENCY ... 38
3.2.5 CASE STUDY 5: CONAGRA- BETTER PRICING AND SUPPLIER RELATIONSHIPS ... 40
3.2.7 CASE STUDY 7: JCB INDIA-NEW BUSINESS MODEL ... 43
3.2.8 CASE STUDIES- 3D PRINTING ... 45
CHAPTER 4: MAPPING TECHNOLOGY BENEFITS & IMPACT ... 48
4.1 INTRODUCTION:... 48
4.2 M ETHODOLOGY ... 48
4.3 Two MAIN IMPACTS - GROWTH & PRODUCTIVITY ... 49
4.4 STEP 1: INDUSTRY CASE STUDY RESEARCH ... 51
4.5 STEP 2: IMPACT ANALYSIS... 52
4.6 STEP 3: GROUPING OF CAPABILITIES, BENEFITS AND IMPACTS ... 54
4.7 STEP 4: MAPPING CAPABILITIES, BENEFITS & IMPACTS ... 60
4.8 BENEFIT IMPACT MAPPING FRAMEWORK & MODEL BUILDING BLOCK ... 62
CHAPTER 5: TECHNOLOGY AND VALUE CHAIN DISRUPTION ... 64
5.1 INTRODUCTION... 64
5.2 VALUE CHAIN DISRUPTION EXAMPLE - MUSIC INDUSTRY ... 64
5.2.1 STAKEHOLDERS IN MUSIC INDUSTRY ... 65
5.2.2 TRADITIONAL MUSIC VALUE CHAIN... 68
5.2.3 CHARACTERISTICS OF TRADITIONAL MUSIC INDUSTRY... 69
5.2.4 DIGITAL MUSIC VALUE CHAIN ... ... 71
5.3.5 CHARACTERISTICS OF DIGITAL M USIC INDUSTRY... 73
5.3.6 M ODEL BUILDING BLOCKS ... 79
CHAPTER 6: WHEN TECHNOLOGY ADOPTION FAILS... 81
6.1 INTRODUCTION... 81
6.2 W HEN TECHNOLOGY FAILED ORGANIZATIONS... 81
6.2.1 HERSHEY'S ERP IMPLEMENTATION... 81
6.2.2 TOYS R US.COM CHRISTMAS DELIVERY... 82
6.2.4 FOXM EYER D RUG ... 83
6.2.5 G M 's ROBOT FAILURES ... 84
6.3 IM PACTS OF FAILURES ... 84
6.4 SUM M ARY ... 86
CHAPTER 7: BARRIERS OF TECHNOLOGY ADOPTION ... 87
7.1 INTRODUCTION ... 87
7.2 CHALLENGES AND BARRIERS ... 87
CHAPTER 8: RESEARCH FINDINGS AND SUMMARY ... 92
8.1 INTRODUCTION ... 92
8.2 CONCEPTUAL FRAM EW ORK ... 93
8.3 CONCLUSION: ... 96
List of Figures
Figurel: Industrial Revolutions ... 14
Figure 2: Smart manufacturing and connected supply chains... 17
Figure 3: Industry 4.0 Environment... 21
Figure 4 : B ig D ata - 3V s ... 24
Figure 5: Four stages of Analytics ... 25
Figure 6: IoT and Big Data Analytics ... 27
Figure 7: High level Architecture of IoT implementation ... 34
Figure 8: Methodology - Benefits and Impacts Map ... 48
Figure 9: Growth & Productivity approach ... 49
Figure 10: Step 1 -Industry Case Study Research... 51
Figure 11: Step 2 -Impact Analysis ... 52
Figure 12: Step 3: Grouping of Capabilities, Benefits & Impacts... 54
Figure 13: Step 4: Mapping Capabilities, Benefits & Impacts... 60
Figure 14(a): Benefit Impact Mapping Summary... 61
Figure 14(b): Benefit Impact Mapping Framework ... 62
Figure 15: Model Building Block -Objective... 63
Figure 16: Processes in Recorded Music ... 65
Figure 17: Traditional Music Value Chain... 68
Figure 18: Digital Music Value Chain ... 71
Figure 19: Revenue Plot of Music Industry ... 74
Figure 22: Percentage of companies that named security as top challenge to
implementing Big Data initiatives... 90 Figure 23: Conceptual Framework ... 93
List of Tables
Table 1: Internet of Things Units Installed Base by Category ... 22
T able 2: D ata size exam ples:... 33
Table 3: 3D Printing Benefits Grouping... 45
Table 4: Capability, Benefit & Impact in Intel Case (refer section 3.2.1)... 56
Table 6: Example -Existing Revenue Streams impact... 57
Table 7: Example -Fixed Cost impact... 58
Table 8: Example -Variable Cost impact... 59
Table 8: Number of major Record Labels since 1988 - 2016 ... 75
Table 9: Traditional Vs. Digital Music Industry... 78
Table 10: Music providers and adoption drivers... 79
Chapter 1: Introduction
Industrial Revolution has gone through different phases, starting from transition from hand production methods into machines during the eighteenth century, to modern day digital and Internet technologies. In this chapter, we introduce the Industry 4.0 or the Fourth Industrial Revolution; what Industry 4.0 means to organizations and motivation and objectives behind this research.
1.1: Industrial Revolutions
Industrial Revolutions that have occurred in the past served as major turning points in history; they have impacted almost every industry and affected almost every aspect of their operations and functions.
The First Industrial Revolution occurred in Britain in the period from about 1760 to 18301; during this period there was transformation of manufacturing processes from
manual production methods to machines and mass production.
The Second Industrial Revolution occurred in the latter half of the 1 9th century; it was characterized by expansion of electricity, petroleum, transportation and steel in UK, USA and Germany. The Second Industrial Revolution also witnessed growth in some
industries of huge economies of scale and throughput(Mokyr, 1998).
The Third Industrial Revolution, also known as Digital Revolution, started in the latter part of 2 0 th century marking the application of digital computers and computing power.
The main players in the beginning of this phase are the US based IT and Internet companies.
Although all the three Industrial Revolutions occurred in different times in the history, some of the impacts in the manufacturing industry were similar - they led to increase in production volume, production and operational process change, reduction in production times, automation, reduced growth rates of labor income, lower cost of manufacturing among others. We are now at an age of the Fourth Industrial revolution or the Industry 4.0, which marks the next phase of digitization of manufacturing and operations.
1.2: Defining Industry 4.0
Definition: The term Industry 4.0 stands for the fourth industrial revolution. Best
understood as a new level of organization and control over the entire value chain of the life cycle of products, it is geared towards increasingly individualized customer
requirements. This cycle begins at the product idea, covers the order placement and extends through to development and manufacturing, all the way to the product delivery for the end customer, and concludes with recycling, encompassing all resultant services.
First assembly line 1870 Frst programmable logic control system 1969 3rd d ial reoluton Through applicaion of electronKcs and IT to further automate production 4th industrial revolution On the basis of cyber-phys-ical production systems
(CPPS, merging of real
and virtual worlds
Industry 4.0
Industry 3 0
End of 18th century Beginning of 20th century Beginning of 1970s of 20th centurv
Figurel: Industrial Revolutions 2
The basis for the fourth industrial revolution is the availability of all relevant
information in real time by connecting all instances involved in the value chain. The ability to derive the optimal value-added flow at any time from the data is also vital. The connection of people, things and systems create dynamic, self-organizing, real-time optimized value- added connections within and across companies. These can be optimized according to different criteria such as costs, availability and
2 jochen Schlick, Peter Stephan and Detlef Zhike: Produktion 2020. Auf dem Weg zur 4. industriellen Revolution. IM
-Fachzeitschrift fur Information Management und Consulting. August 2012. Retrieved from Deloitte Report -Industry 4.0 Challenges and solutionsfor the digital transformation and use of exponential technologies
E 0
0
consumption of resources (Platform Industry4.0, retrieved from PwC report -Koch, 2014).
1.3 Literature Review
1.3.1: Current state of Industry 4.0
Industry 4.0 involves increasing digitization and interconnection of products, value chains and business models (Koch et al., 2014). The traditional methods of
manufacturing is in the cusp of digital transformation that goes beyond application of IT and automation but creating intelligent networks connecting entities or stakeholders along the entire value chain.
A BCG report names nine pillars of technology advancement in Industry 4.0 viz. Big Data and Analytics, Autonomous Robots, Simulation, Horizontal and Vertical System Integration, The Industrial Internet of Things, Cybersecurity, The Cloud, Additive Manufacturing and Augmented Reality (The Boston Consulting Group, 2015). These technologies will create huge volume and variety of data; it will be critical that there is secure interconnection between systems that would generate these data and information. Some of these technologies have existed for many years but in recent times there has been advancement in their applications and such applications are gradually changing the way several industries operate and functions. Another report released by McKinsey identifies four disruptions that drive Industry 4.0 as below (Safire, 1991):
* The astonishing rise in data volumes, computational power, and connectivity, especially new low-power wide-area networks
" The emergence of analytics and business-intelligence capabilities - New forms of human-machine interaction such as touch interfaces and
augmented-reality systems
- Improvements in transferring digital instructions to the physical world, such as advanced robotics and 3-D printing.
The manufacturing industry is going through transformations. Machine learning and analytics powered manufacturing operations will have the capability of predictive maintenance, mass production, intelligent and customized customer support, automation etc. For example, using 3-D printing complex and intricate designs can be manufactured with precision and speed that was not possible before. Predictive analytics can forecast errors before they even occur and catch them before it stops operations in a factory floor, reducing equipment downtime and improving safety of workers.
INDUSTRY 4.0 WILL RESULT IN BETTER CONNECTED SUPPLY CHAINS SMart I e6 raintenance S 4( & better et safety Ie n Co te/ ZP 00%\s' '3tj 01
Suppliers, manufacturing plants, 3rd party logistics providers like warehouses and transportation and customers will be connected with better visibility across the supply chain
Figure 2: Smart manufacturing and connected supply chains
As Industry 4.0 technologies mature to attain more business readiness for application, their adoption would have the potential to change the global
competitive environment at a massive scale. Accenture's analysis in collaboration with Frontier Economics estimates that it could add US$14.2 trillion to the global economy by 2030(Accenture, 2015). Another study by GE and Accenture states 73% of the companies surveyed said that Big Data analytics comprised of more than 20% of their overall technology budget(Accenture & GE, 2015). One of the key findings of a recent PwC study states Industrial Internet occupies a leading position on the
agenda of directors and managers of industrial companies, it must be a part of the CEO agenda(Koch et al., 2014). According to a recent research by Accenture Strategy "most C-suite executives want to follow the trend rather than lead in the journey to the Industrial Internet". In certain sectors of the industry being a follower may be the favorable strategy but in some companies being late in adopting industrial internet will also put them at risk of losing out to competitors. Industry 4.0 can rapidly disrupt value chains and change business models challenging existing players in the market. Hence, it is critical that executives pay close attention to this phenomenon and evaluate the course of action to adopt the right strategy in the age of fourth industrial revolution.
1.3.2: Three main Classifications
The various outcomes and benefits of application of Industry 4.0 technologies can be classified into three categories (Professor David Simchi-Levi, MIT) - New Business Models, Operational Efficiency and Customized Offerings.
- New Business Models - New technologies can introduce new business models and sometimes also disrupt the value chain. Rolls-Royce implemented
sensors and used big data analytics to provide monitoring capabilities and spot problems before they occur thus improving safety and performance. Customers were offered to monitor their engines and were charged based on
usage time, thus changing from a fixed cost to a variable cost service based model. Rolls-Royce handles repair, maintenance and replacement
responsibilities. As a result service revenue accounted for 70% of the civil-aircraft engine division's annual revenue. Uber, Netflix, Airbnb are examples of disruptions in business models using technology.
Operational Efficiency- New technologies are improving operational efficiency by building capabilities such as predictive maintenance,
automation, dashboards, better supply chain visibility, asset monitoring and helping in faster decision making. Big data analytics enabled Rolls Royce to predict future failures of components between 10 to 15 days before failure would occur. The company could cut cost and downtime by 90 to 99 %
relative to fixing problems after they occur. Airlines, utilities, freight shipping companies are using IoT to improve fuel efficiency and drive down overall fuel costs. Amazon Robotics (formerly Kiva Systems) is another example where use of robots and data analytics helps in operational efficiency.
- Customized offerings - The third category is the capability to offer customized services and experiences to customers. New technologies help companies learn about their customers and receive real time feedback. This helps companies improve marketing efforts and tweak campaigns real time based on behavior of targeted customer. Amazon, Netflix, Spotify offer customized recommendations based on their past behavior.
1.4: Primary Research Objectives
Technology in itself cannot achieve results if not implemented correctly. According to a 2015 report released by McKinsey, only 48% of the 300 manufacturing leaders surveyed consider themselves ready for Industry 4.0. Implementation of Industry 4.0 technologies for majority of organizations would involve an extensive
transformation process that cannot be attained in a short period. Such changes not only involve the company but a lot of times they impact other stakeholders in the value chain. It is a company wide transformation process involving considerable
amount of time and investments and hence it requires top management to understand its importance and have the right strategy in place for its adoption.
It is still early stage for Industry 4.0 technologies and the objectives of this research are two fold. The first objective is to explore the use and application of current Industry 4.0 in various industries such as manufacturing, utilities, automotive, high tech. This analysis will help in deriving key insights about impacts of adoption of the technologies involved. Second objective is to propose a conceptual framework for adoption of Industry 4.0. To attain the objectives mentioned above, we will use insights from interviews with companies conducted by MIT and
Chapter 2: Technologies of Industry 4.0
4l 2.1 Industry 4.0 environment:ROBOTS
BIG DATA
s
D
ENSORS
INTERNET OF THINGS
GREEN TECHNOLOGIESNETFLIX
CLOUD
ANALYTICS
3D PRINTING
Figure 3: Industry 4.0 Environment
I
In an Industrial 4.0 environment, automation, operational efficiency, new business models, predictive maintenance, more efficient supply chains, and better network
21
I
a
visibility will characterize business functions in various industries. More and more products will become connected and intelligent and in turn help add value at different nodes of processes and operations. Following sections explores various technologies of Industry 4.0 and their capabilities.
2.2 Technologies of Industry 4.0
2.2.1 Internet of Things
Definition: Internet of Things can be defined as a global infrastructure for the information society, enabling advanced services by interconnecting (physical and virtual) things based on existing and evolving interoperable information and
communication technologies (International Telecommunication Union, 2012).
The numbers of objects that are connected to the Internet are increasing and the world is moving towards a more connected future. There have been several
predictions about the number of connected devices -Cisco predicted that about 50 billion devices would be connected by 2020, which are twice as many devices predicted by Gartner.
Table 1: Internet of Things Units Installed Base by Category
Automotive 96.0 189.6 372.3 3,511.1 Consumer 1,842.1 2,244.5 2.874.9 13,172.5 Generic 395.2 479.4 623.9 5,158.6 Business Vertical 698.7 836.5 1,009.4 3,164.4 Business Grand Total 3,032.0 3,750.0 4,880.6 25,006.6
Source: Gartner (November 2014)
A report from McKinsey Global Institute report predicts that linking of the physical and digital worlds has the potential to generate $11.1 trillion a year in economic value by the year 2025. To analyze application and impact of IoT in various
industries, we researched industry case studies from leading IoT providers. Some of the case studies and key findings are discussed in detail in the subsequent chapters.
2.2.2 Big Data
Definition: Big data is a broad term for a large volume of data - both structured and unstructured generated on a day-to-day basis in a business. Big data can be
add value to business. Gartner analyst Douglas Laney introduced the 3Vs concept -Volume, Velocity and Variety.
Volume
niOg
Data
Velocity
Variety
Figure 4: Big Data - 3Vs
With the increase of connected objects the amounts of data produced are increasing. Huge volumes of data are created from various sources like sensors in machines (e.g. manufacturing plants, turbines in power plants, tractors used in agriculture), wearable devices (e.g. Fitbit, Jawbone), social media (e.g. Facebook, Twitter),
e-commerce sites (e.g. Amazon, eBay), Video on Demand services (e.g. Hulu, Netflix), music streaming services to name a few. Companies are gaining valuable insights by synthesizing and analyzing these data, which help them add more value to their business in various ways such as improving sales and marketing functions through customer insights, preventive maintenance etc.
2.2.3 Analytics
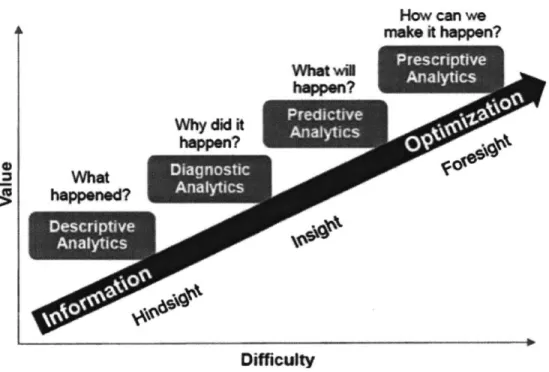
Definition: Analytics can be defined as the method of uncovering and identifying meaningful trends and patterns in data. Analytics involves application of statistical methods, programming and operation research3 and often supported by data visualization to present findings.
How can we make t happen? Why did it happen? What happened?_ Difficulty Source: Gartner
Figure 5: Four stages of Analytics
Descriptive analytics: This is analytics that use data mining techniques on historical data to provide information and insights into what happened in the past.
Descriptive analytics is widely used in various industries in the form of dashboards,
graphs etc. to provide information to different stakeholders. For example, in a warehouse management system application such a dashboard can have historical and real-time inventory data located in different parts of the warehouse as well as the supply chain, combined with other metrics to help decision making for
warehouse operations.
Diagnostic analytics: This is a form of advance analytics, which examines data or content to answer the question "Why did it happen?" and is characterized by techniques such as drill-down, data discovery, data mining and correlations
(Gartner). This type of analytics will be used to determine the root cause of an event. If in the warehouse example, if there is a particular inventory update error
occurring at random occasions, the type of analytics used to determine it the root cause of the error is diagnostic in nature.
Predictive analytics: Predictive analytics is the use of data, statistical algorithms and machine-learning techniques to identify the likelihood of future outcomes based on historical data (SAS). This type of analytics goes beyond descriptive and diagnostic
analytics to provide the best assessment of when an event will occur again. This type of analytics has been applied in manufacturing to predict a failure before it
occurs and fix in advance.
Prescriptive analytics: This is the final phase of analytics that goes beyond
assist in better decision-making. This is characterized by techniques such as graph analysis, simulation, complex event processing, neural networks, recommendation engines, heuristics, and machine learning (SAS). E-commerce sites such as eBay, Rue La la and airline sites use such analytics for dynamic pricing.
Internet of Things, Big Data and Analytics are interconnected. Sensor data from IoT has no value if analytics is not applied to data to derive meaningful insights. Increase in number of connected objects will also drive big data analytics adoption.
INTERNET OF THINGS NEEDS BIG DATA
ANALYTICS
More ways to receive, collect, send tremendous volumes of data
Systematically collect and store massive volume and variety of
structured and unstructured
data
Extract insights to business from the massive volume and variety of data
2.2.4 3D Printing
Definition: 3D printing also known as additive manufacturing refers to the various processes of manufacturing three-dimensional solid objects from a digital file. In additive process an object is built by depositing layers4 of material successively until the entire object is manufactured5.
3D printing can be used to combine parts and also create intricate parts with better quality. This technology is already used in numerous industries such as in
manufacturing healthcare devices, aerospace and defense, dental devices, consumer electronics, jewelries etc. According to Harvard Business Review, 3-D printing application has gone beyond basic prototyping, rapid tooling, toys(D'Aveni, 2015). Business executives should realize the potential impacts this technology can have on their businesses. The cost of 3D printers has decreased dramatically, the machines that used to cost $20,000 in around 2010 now costs less than $1,000(Bilton, 2015). These developments and capabilities of the 3D-Printing technology call for
organizations to evaluate their manufacturing and operations and explore if processes can be optimized through application of this technology.
2.2.5 Robots
Robots have been in use for a long time in various forms. Ever since the first Industrial Revolution factories used industrial robots in the form of machines
capable of performing tasks in production floor without or with little need of human assistance. Today robots, which are far more sophisticated and powered by
software and artificial intelligence, are beginning to replace labor work in various industries such as military, medical and surgery, manufacturing processes like welding, assembly, material handling equipment etc. Amazon's warehouses rely heavily on Kiva System's (now Amazon Robotics) Al powered robots for their operations. As robots will continue to get more sophisticated with new capabilities, their costs will also reduce and will see more applications in future. According to BCG, worldwide spending on robotics is expected to reach 67 billion dollars by 2025.
2.2.6 Augmented Reality
(Note: Virtual Reality is beyond the scope of this research)
Definition: An Augmented Reality system supplements the real world with virtual (computer-generated) objects that appear to coexist in the same space as the real world. It consists of following properties(Wu & Tanphaichitr, 2002):
- Combines real and virtual objects in a real environment; - Runs interactively, and in real time; and
- Registers (aligns) real and virtual objects with each other.
In manufacturing sector, Augmented Reality (AR) has been implemented in warehouse operations for picking operations. Pickers use AR equipped headsets which displays information such inventory locations and other SKU details
necessary to perform picking operation. This increases accuracy and bringing down error rates and it is convenient for pickers to perform operation with both hands free. AR systems also have applications in assembly lines and factory floors.
In the following chapter we explore few of the case studies that we researched which involves above mentioned technologies.
Chapter 3: Industry Case Studies
3.1 Introduction
We researched and analyzed many industry case studies involving technologies of Industry 4.0 environment such as Big Data Analytics, Internet of Things, 3D printing and Robots. Below sections provides summary of few selected case studies with an analysis of their benefits and impact.
3.2 Two Main Outcomes
The objective of this exercise of researching industry case studies is to understand the impact of implementation of these technologies. During our research it emerged that adoption of Industry 4.0 technologies resulted in outcomes that can be grouped into two main categories:
- Growth Impact
e Productivity Impact
Growth Impact - Organizations were able to grow by generating more revenue through introduction of new business models, new customer acquisitions, new revenue streams, better/dynamic pricing etc. They were able to build new
capabilities through adoption of technologies, capabilities that would facilitate such growth.
Productivity Impact - On the other hand organizations could improve productivity by cutting cost and attain better operational efficiencies and asset utilization by achieving automation capabilities, data availability/visibility, predictive
maintenance, higher product yield, waste reduction, improved safety, better forecasting among many others. This results in better utilization of resources and assets thus leading to better productivity.
3.2.1 Case Study 1: Manufacturing at Intel
-
Predictive Maintenance
Source: Intel
Industry: Manufacturing Business Challenge:
This case study is about application of Internet of Things and Big Data Analytics to one of Intel's manufacturing facilities to show how these technologies helped bring operational efficiencies and cost savings to manufacturing processes. Sensors and factory equipment generated huge sets of varied data types
-- Structured data such as manufacturing data stored in relational databases, and data from manufacturing execution systems and enterprise systems.
- Unstructured data such as images, texts, machine log files, human-operator-generated shift reports etc.
Table 2: Data size examples:
DATA TYPE DATA SIZE (per week)
Machine parameters and error logs -5 GB per machine
Machine events -10 GB per machine
Defect images from vision equipment -50MB per unit or 750 GB per lot
Source: Intel
These massive data files limited the ability to store and analyze the data using conventional methods. There lay a big opportunity to extract business value from these large sets of data that was getting generated from Intel's manufacturing plant.
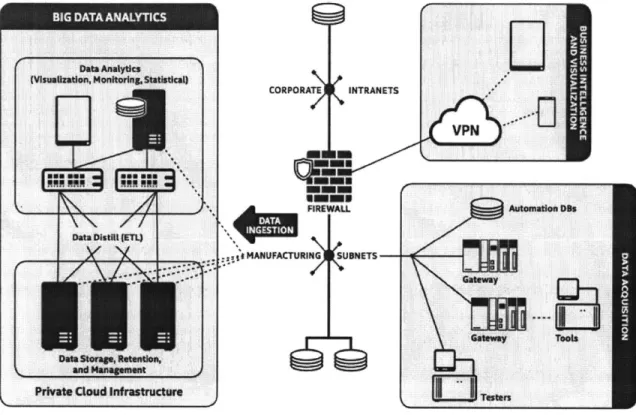
Solution:
Intel implemented IoT and Big Data analytics in its manufacturing facility with industry collaboration from Cloudera, Mitsubishi Electric, Dell and Revolution Analytics. A high-level architecture of building blocks for end-to-end infrastructure enabling manufacturing intelligence from factory floor to data center is shown in Figure 7. With the use of these big data technologies, it was possible to gather and manage huge sets of data from manufacturing shop floor and the manufacturing network. By running analytics on these data sets, Intel was able to gather
meaningful insights and present data using visualization platform to assist in decision-making and operational efficiencies.
Addressing the challenge: loT pilot using big data analytics server and loT gateway in Intel manufacturing
Data Analytics
VisuazatDon, Monitoring, Sttstcal)
CORPORATE INTRANETS
VPN
eams
FIREWA LL Automation OBs
Data Distill (ETL)
MANUFACTURING SUONETS
Gateway
Gateway Toots
Data Storage, Retention, and Management
Private Cloud Infrastructure Testers
Source: Intel
Figure 7: High level Architecture of loT implementation
Benefits:
Predictive maintenance: Analytics capability predicted up to 90% of potential
failures in a particular use case. By replacing machine parts before they fail, Intel was able to reduce non-genuine production yield loss and sudden equipment downtime, which resulted in higher efficiency in production.
Automation: Using image analytics Intel was able to inspect units that were screened as marginal units and segregate the ones that had to be rejected. This method identified defects roughly 10 times faster than manual method.
Impact:
Use of IoT and big data analytics in such use cases, which leads to automation and predictive maintenance as in the above mentioned case, results in cost savings and productivity improvement. In this specific case, Intel was able to improve operational efficiency through predictive maintenance, avoid equipment downtime, reduce manual work and provide remote and easy access to data via visualization tools. This led to cost reduction in their manufacturing facility. According to the report, this IoT big data analytics project was forecasted to save millions of dollars annually
along with additional return on investment business value.
Case Studies 2-5 are referred from Real Time Research & SAP.
3.2.2 Case Study 2: Adobe Systems- Targeted Marketing
Company: Adobe Systems is a publisher of desktop publishing and graphics editing programs and other wide array creativity and marketing software products. Industry: High tech
Business challenge:
Analytics teams and data were fragmented across the company. Different groups produced different numbers and because executives relied on IT to retrieve data,
on-demand analytics and number crunching was not possible as a result slowing down decision making. Aggregating structured and unstructured data from multiple sources was a challenge. Access to real-time data to respond to customer activity was another challenge. Time delay can be a huge disadvantage for a cloud-based business with subscription based model where access to customer's second-by-second activity can provide valuable insights.
Solution:
Adobe implemented fully integrated and real-time customer profiles across channels. Adobe implemented predictive analytics and data visualization tools to anticipate customer needs and develop more personalized programs.
Benefits:
* Faster decision making- Adobe was able quickly analyze customer acquisition and usage patterns to tweak promotions immediately to improve results. - Customized offering - By having faster access to aggregated customer data
from multiple sources, Adobe was able to provide more personalized customer interactions as opposed to a generic interaction.
Offering personalized customer interactions and tweaking promotions when needed can improve customer retention and customer acquisition. This will in turn impact revenue, we categorize this impact as growth.
3.2.3 Case Study 3: Alliander (2013)
-
Predicting fluctuating energy
demand
Company: Alliander is a regional grid operator for gas and electricity in Netherlands.
Industry: Power and Utilities Business Challenge:
With the increase in the number of energy hungry devices such as plug-in electric vehicles (PEVs) every year, it became critical for Alliander to be able to forecast peak load and unusual demand quickly and accurately. Inability to do so could lead to customer demand not being met on time, which could result in higher operating
costs and network outages that would leave customers angry and dissatisfied.
Solution:
Alliander expanded network to 22,000 sensors spread across 400
substations and set up wireless mobile telecommunications network. The company used analytics capabilities to draw insights from massive amounts of data that was generated and make data driven decisions.
" Improved customer relationships
- More accurate forecast of energy demand * Automation of manual tasks
e Improved auditing and reduced energy costs for customers
Impact:
Benefits listed above would result in cost savings through better operational efficiency. Better customer relationships would lead to customer retention and hence help grow revenue. This will result in both improved productivity and growth.
3.2.4 Case Study 4: ARI
-
Improving operational efficiency
Company: A fleet management services company Industry: Automotive
Business Challenge:
ARI's data volumes were doubling every 14 months, every vehicle collected 14,000 data points. This increase in data volume also increased the time it took to run reports and queries. Managers needed real-time data to make faster decision and improve efficiency.
ARI used big data and analytics to integrate data from disparate systems and provide faster access to data so that insights can be drawn for faster decision making. Faster access to data and reports helped better customer service. In the future ARI planned to use big data analytics for predictive maintenance i.e.
recommend a repair before failure occurs, discover hidden trends, for eg: discover link between fueling locations and accidents.
Benefits:
- Automation- when customers needed more granular data, it involved a lot of manual work, after technology implementation they were able to reduce manual work and also improve transaction time by a little more than five percent
- Trend spotting- Real time access to data helped to draw correlations and spot trends better
* Customer Service- A majority of ARI's employees use the system daily, which helped them make faster decision making. Select customers run their own queries using the customer portal empowering them to make better decisions.
The impact of technology adoption in ARI's case clearly falls under productivity improvement through automation and easier access to data.
3.2.5 Case Study
5:
ConAgra- Better pricing and supplier
relationships
Company: ConAgra is an American packaged food company. The company makes and sells food6 under various brand names such as Healthy Choice, Marie
Callender's, among others. Industry: Food processing
Business Challenge:
The challenge that ConAgra was facing was to figure out the optimal pricing for its products in an environment where consumers are hypersensitive, while coping with the ever- fluctuating costs for 4,000 raw materials used in some 20,000 products. ConAgra needed access to variety of data and analytics capabilities to gain
meaningful insights into customers and make faster decision-making.
Solution:
ConAgra implemented big data analytics to speed data analysis, gather new sources of data about customer behavior and share data driven insights with retailers.
Benefits:
* Faster decision making through real time data - ConAgra was able to speed collection of data related to commodities purchases from 9 hrs to 20 minutes and to reduce its month-end forecasting process by three days.
* Insights
from
new sources of data, respond to consumer needs and stronger ties with retailers- The company uses more types of data than it did before; it gathered shopper specific data that it gets directly from retailers. Insights from such customer data helped better product merchandizing. For example, people who bought one type of single-serving frozen food tended to buy several other single-serving varieties at the same time. As a result of this insight, ConAgra suggested that retailers group the packages with smaller portions together, instead of stocking single-serve pizzas with family-size pizzas. This in turn also strengthened ties with its retailers by making recommendations that would improve their operations.* Pricing decisions and better merchandizing- Using external data, such as consumer data provided by retailers, delivers real-time insight into how to merchandize products more effectively and increase margins.
ImpactAnalysis: All of the benefits listed above will have impact on revenue and hence growth.
3.2.6 Case Study 6: Israel Electric Corporation-Improving Safety
Source: IBM, 2013
Company: Israel Electric Corporation (IEC) generates 95 percent of Israel's electricity.
Industry: Utility
Business Challenge:
IEC had to meet the needs of 2.5 million consumers in an era when Israel's demand for electricity was growing at more than three percent per year. It was needed that
IEC keep its 17 power stations online and operating efficiently at all times.
Solution:
The company used big data and analytics to gain meaningful insights from data collected from sensors located in their complex machines. These sensors collected huge amounts of data - in one case their control system collected 500 data-points from analog sensors, and another 700 from digital sensors. Such data was mined to perform predictive maintenance.
* Cost savings- The need to restart turbines after an outage was an expensive process. By predicting and fixing a problem before an outage occurred avoided the need of such restarting of turbines. By doing this IEC estimated to reduce costs by up to 20 percent. IEC also saved approximately USD 75,000 in fuel costs per turbine by identifying inefficient fuel usage.
" Efficiency- IEC increased the efficiency of maintenance schedules, costs and resources, resulting in fewer outages and higher customer satisfaction.
" Preventive maintenance -Provides early warning of certain types of failure up to 30 hours before they occur, instead of 30 minutes.
" Improved safety- Since IEC was able to predict a major failure 30 hours in advance instead of 30 minutes, they had much more time to intervene and make sure that all their employees were out of harm's way.
ImpactAnalysis: The benefits mentioned above would result in improved productivity.
3.2.7 Case study 7: JCB India-New Business Model
Company: JCB India is a leader in earthmoving and construction equipment manufacturing in India.
Business Challenge:
JCB had a requirement to keep its customers informed of status of their machines at all times. JCB needed to gather vital parameters of machine performance and its
exact location at all times.
Solution:
JCB India implemented IoT as an end-to-end application by involving several vendors to take care of different functions such as communications, map services, cloud based platform among others. Customers we able to monitor equipment usage, status and health, fuel consumption and idle time. Customers would receive alerts if machine went outside the defined boundary of operation.
Benefits:
- Enhanced customer experience- At the beginning of 2015, the platform handled 60,000 transactions per day for a fleet of 1,300 machines, with plans to add 2,000 new machines each month. The Company was able to provide
prompt service to its customers - to ensure all issues be resolved within 72 hours of reporting.
- New business model - They launched IoT program known as "LiveLink" as a value-added-service along with the machine. They could implement product-as-a-service model with no revenue leakage.
Impact:
JCB India was able to introduce new business models by allowing customers to remotely monitor their machines. This avoided any revenue leakage. We categorize this impact as growth.
3.2.8 Case Studies- 3D Printing
Several case studies from leading 3D Printing companies such as Stratasys Ltd., Materialise NV, ExOne etc. were analyzed. In the table below we grouped the benefits that were mentioned in the case studies we researched. It is evident from the benefits mentioned in the table that their resulting impacts fall under the same two categories mentioned earlier in this chapter, growth and productivity.
Table 3: 3D Printing Benefits Grouping
Common Benefits How benefits were realized
Flexibility-design & Dramatic time and cost savings allow more flexibility to manufacturing process make fast adjustments throughout design cycles
unachievable through conventional methods
Parts manufactured in house instead of service bureaus Removes human error
Less tools required/ Tool less Saves time Reduced product design cycle time
Reduced testing time
Automated- printer can work unattended Inhouse Vs outside supplier
Frees up other machines (CNC m/c) that would otherwise be doing the job for longer
Reduced lead time
Saves Cost Reduced prototyping cost
In house Vs outside supplier Reduced scrap rate
Cuts tooling cost
Quality Intricate shapes can be obtained
Fine details and high accuracy can be achieved
Cost effective and high quality prototype in early stages of design cycle
Can be printed for added strength that is not achievable by traditional manufacturing Time to market Shorter concept and proof of concept phases
Streamline prototyping process
Reduced testing time and others mentioned under "time"
Customer communication Prototypes easier to understand by customers-enables customer and company to agree more quickly on design changes avoiding any misunderstandings
Chapter 4: Mapping Technology Benefits &
Impact
I
4.1 Introduction:
In order to gain a better understanding of benefits of Industry 4.0 technologies and how these benefits impacted organizations, several case studies involving these technologies such as IoT, Big Data Analytics, 3D printing among others were
researched. It was observed that irrespective of the technologies deployed, benefits and impact could be grouped into few common categories.
4.2 Methodology
Methodology
1. Industry Case Study Research
2: Impact Analysis
3: Grouping of Capabilities, Benefits & Impacts
4: Mapping Capabilities, Benefits & Impacts
4.3 Two Main Impacts - Growth & Productivity
To develop our impact mapping framework we consider the final objective of adoption of technologies in Industry 4.0 environment as increasing shareholder value. Shareholder value can be maximized in various ways. In this context we consider Growth and Productivity as two factors among many that creates shareholder value.
Figure below represents the basic building block of our mapping framework.
INCREASE SHAREHOLDER VALUE
GROWTH
PRODUCTIVITY
Figure 9: Growth & Productivity approach
49
Productivity: We define productivity as improvement of performance in any function that involves cost cutting achieved through operational efficiency and asset
monitoring.
Growth: By growth we refer to growth achieved through increase in revenue.
Revenue: We categorize revenue into revenue generated from existing streams and revenue generated from new streams, for example introduction of new business models and products.
Cost: We categorize costs into fixed and variable.
Fixed costs are those costs that do not fluctuate with changes in production volume or sales and services; for example- rent, insurance, salary, equipment etc.
Variable costs involve costs that change when there is a change in production output or sales and services. Variable costs may involve hourly wages, raw materials etc.
4.4 Step 1: Industry Case Study Research
Methodology
1 ndustry Case Study Research
2: Impact Analysis
3: Grouping of Capabilities, Benefits & Impacts
4: Mapping Capabilities, Benefits & Impacts
Figure 10: Step 1 - Industry Case Study Research
Researching case studies involving Industry 4.0 environment was our first step. Our objective was to understand how and why various technologies were adopted and their many benefits. Results of this research have been covered in detail in chapter 3. In our research we saw that in the various case studies, although the technologies used were different, the benefits and outcomes were similar. For example,
implementing 3D printing and loT in two different scenarios led to reducing time to market, similarly robots and IoT coupled with Big Data Analytics led to automation and operational efficiency. And finally impact of the benefits achieved through adoption of technologies could be categorized into two categories -growth impact and productivity impact.
4.5 Step 2: Impact Analysis
Methodology
1.InusryCase Stud Research
2: Impact Analysis
3: Grouping of Capabilities, Benefits & Impacts
4: Mapping Capabilities, Benefits & Impacts
Figure 11: Step 2 - Impact Analysis
During our research we saw that revenue can be generated in various ways as a result of adoption of technologies. Examples of these include creation of new business models, offering customized service/experience to customers, improving targeted marketing that would impact sales and retention of existing customers. We categorize revenue impact into two categories
- Existing Revenue Streams - We define this as the impact on revenue streams that already exist in the organization. For example, in a supermarket or an online store data analytics can be used to gain better understanding of customer behavior and based on insights, actions such as changing layout of items, better pricing and recommendations, can be taken to improve sales.
e New Revenue Streams - This is the revenue generated from new revenue
streams introduced as a result of technology adoption. For example, offering subscription model or pay-as-you-go model instead of one time lump sum payment to attract different segment of customers.
From our research on industry case studies we found that Cost can be reduced in various functions. We categorized them into fixed and variable
costs-- Fixed Cost - Examples of this type include cost reduction due to improvement in asset utilization as a result of asset monitoring
capabilities, safety improvement as we saw in the case study about Israel Electric Corporation, better space utilization, workforce monitoring and employee utilization etc.
- Variable Cost - Examples of this are cost savings as a result of building capabilities like predictive maintenance which would help in reducing
yield loss, equipment downtime in a manufacturing plant, fixing of customer issues remotely which will reduce travel cost, automation and reduction of testing times and other operational efficiencies achieved through technology adoption.
4.6 Step 3: Grouping of Capabilities, Benefits and Impacts
Methodology
1. Industry Case Study Research
2: Impact Analysis
3: Grouping of Capabilities, Benefits & mpacts
4: Mapping Capabilities, Benefits & Impacts
Before grouping the benefits and impacts of adoption of Industry 4.0 technologies, we define the three terminologies used -capability, benefit and impact. We will refer
to the Intel Case that was mentioned in the previous chapter under section 3.2.1 while defining these terms.
Capability: We define capability as a feature that is added to a system or a process as a result of which particular function or task can be performed in a new improved fashion.
Example: In the Intel Case, few of the capabilities that were built through implementation of IoT and Big Data Analytics technologies are Preventive Maintenance and Automation.
Benefit: In this context, we define benefit as a desirable outcome of the capability that is built through technology adoption.
Example: In the Intel Case, the benefits that were achieved because of capabilities that were built. Capability "Preventive Maintenance" led predicting failure before it actually occurred and taking corrective measures in advance. This led to the
"benefit" of reducing yield loss or sudden equipment downtime. Similarly by building "Automation" capabilities Intel was able to achieve the benefit of reducing testing time by 10x.
Impact: In this context, we define Impact as the effect on growth and productivity as a result of technology adoption. Growth is related to revenue impact and
Example: In the Intel Case, adoption of IoT and Big Data Analytics mainly resulted in improvement in operational efficiency. The impact here is cost as a result of cost savings through reduction of yield loss and reduced testing times.
Table 4: Capability, Benefit & Impact in Intel Case (refer section 3.2.1)
CAPABILITY
Preventive Maintenance Automation
BENEFIT
Reduced yield loss Avoid sudden equipment downtime Reduced testing times
IMPACT
Cost savingsSimilarly capabilities, benefits and impacts in numerous case studies were analyzed. Figures below show examples of some common capabilities and benefits that were achieved through technology adoption and their
corresponding impact of revenue and cost.
=Mh
Table 5: Example - New Revenue Streams impact
CAPABILITY
Remote process monitoring Remote access to machine data Real time updates Remote customer supportBENEFIT
New business model innovation New products/ services New market/geo
IMPACT
New revenue streamsTable 6: Example - Existing Revenue Streams impact
CAPABILITY
Dynamic pricing Targeted and customized marketing Automated customer assistanceBENEFIT
Competitive pricing Empower sales and customer support Better sales Customized product/service Time to marketIMPACT
More revenue from existing revenue streams
=*A
Table 7: Example - Fixed Cost impact
CAPABILITY
Asset monitoring Workforce utilization automation Prototyping of intricate designs Preventive maintenance AutomationBENEFIT
Improved asset utilization Improved workforce utilization Utilities SafetyReduced design cycle time Quality/Accuracy Operational efficiency Prototyping cost
IMPACT
Fixed cost reduction -00% 4 -ATable 8: Example -Variable Cost impact
CAPABILITY
Preventive maintenance Automation Remote customer support Automated logistics planning AutomationBENEFIT
Faster decision making Time to market Efficiency Quality Flexibility Visibility Reduced testing times Avoid equipment downtimeIMPACT
Variable cost reduction mmv =No,D>
4.7 Step 4: Mapping Capabilities, Benefits & Impacts
Methodology
1. Industry Case Study Research
2: Impact Analysis
3: Grouping of Capabilities, Benefits & Impacts
4: Mapping Capabilities, Benefits & Impacts
Figure 13: Step 4: Mapping Capabilities, Benefits & Impacts
In our final step of building a framework, we analyzed of capabilities, benefits and impacts described in the previous sections. The impact of the benefits are grouped into Growth and Productivity, which in turn helps in increasing shareholder value. Figures 14(a) represents a summary of the results of our research of industry case studies.
INCREASE SHAREHOLDER VALUE
T
New revenue streams
New Products/Services New Business model innovation
New customer segment New Market/Geo
Remote access to machine data
Remote process monitoring Customer insights Real-time updates Remote customer support
Existing revenue streams
Targeted Marketing Competitive Pricing Customer Service Time to market Empower sales, customer support Customer Insights Customized product/service Dynamic Pricing Productivity
Fixed Cost Variable Cost
Asset utilization Speed Insurance Accuracy
Employee Efficiency
Utilities Visibility
Safety
Asset Monitoring Predictive Maintenance Fuel usage prediction/ Travel cost-remote monitoring support
Workforce utilization Faster Decision Making Automation Reduced testing times Smart grid Equipment downtime
Logistics planning
26
lOT, BIG DATA, ANALYTICS, CLOUD, SENSORS, ROBOTS, 3D PRINTING....
Figure 14(a): Benefit Impact Mapping Summary
61
I
-J U CD ZLW
z
[GrowthSHAREHOLDER VALUE
IMPACT
PRODUCTIVITY
GROWTH
*Fixed cost 9 New revenue streams Variable cost 0 Exisdng revenue streams
CAPABILITY
I
BENEFIT
T
TECHNOLOGY
Figure 14(b): Benefit Impact Mapping Framework
4.8 Benefit Impact Mapping Framework & Model Building Block
The objective of this exercise is to understand how technologies can add value to the various business operations and functions in an organization. Figure 14(b)
represents the final summary of our Benefit-Impact Mapping Framework.
Technology is just a tool or instrument to achieve larger goals and objectives. Organizations need to first decide what these objectives are. From discussions in this chapter we identified two such objectives that can be achieved through
technology - growth and productivity. This is the first building block of our final model.
OBJECTIVE
GROWTH PRODUCTIVITY
Figure 15: Model Building Block - Objective
63
Chapter 5: Technology and Value Chain
Disruption
5.1 Introduction
Technologies in the digital age have impacted various industries massively sometimes even disrupting an entire value chain. Some of the recent examples of such disruptions are Uber disrupting the taxi industry, Airbnb challenging the Hotel industry and Netflix taking away business from cable companies. No other industry has been as frequently disrupted by new technologies as the Music Industry. In this chapter we will explore how the music industry has been transformed in the past few decades.
5.2 Value Chain Disruption Example
-
Music Industry
Technology has impacted every aspect of music starting from the way music is created to the way music is consumed. Internet technologies triggered the disruption in the Music Industry. With advancement of recording technologies musicians were able to record music at a much lower cost and sometimes even in their basement. Through digital platforms, musicians who are not backed by a
record label, can now market their music at almost zero cost and reach an audience directly. The way consumers listen to music changed over the years from Vinyl Records, CDs and Albums to file sharing & download and to present day streaming and subscription services. This has hugely impacted revenue generated from recorded music and licensing. Because of the massive transformation the music industry has gone through due to the impacts of rapidly changing technologies, we picked this industry for our study.
5.2.1 Stakeholders in Music Industry
Distribution
Recording & Marketing & tail
Manufacturing Promotion
aChanel
Source: Adapted from (Prof Bruno Cassiman and Pablo F. Salvador, 2007)
Figure 16: Processes in Recorded Music
The figure above is a simplified representation of processes involved in creation to consumption of recorded music in the traditional music industry before digitization. There are many stakeholders involved in the processes that are involved in music creation and distribution. They are7:
7Stakeholders were identified from PwC paper by Prof Bruno Cassiman and Pablo F. Salvador, 2007 and the book All You Need to
e Artists - Artists compromise of those who create music -songwriters,
singers, instrumentalists etc.
- Authors - These are the people who create music without performing them. - Personal Managers - These are the people who help the artist to expand
his/her career and looks after almost every aspect artist management from music creation to business decisions.
- Business Managers -The business manager is the person who handles all the finances of the artist.
e Attorneys - They are the ones who structures deals, look over contracts,
advise clients about the law and helps shaping artist's business lives.
e Agents - Music agents are the ones who book live personal appearances,
concerts, commercials and other areas.
e Musical ensembles - They are the groups of musicians that meet to perform
music.
- Music Publisher or publishing houses - They manage and administer author's copyright and promote the work of musicians.
* Writers' copyright collectives and performance rights organizations - they are responsible for collecting royalty payments.
- Tour promoters- Those who publicize and promotes tours
- Music producers - They are the talent scouts (A&R) who invests in artists.
e Recording studios - This is the facility equipped with everything necessary to