HAL Id: hal-01730162
https://hal-amu.archives-ouvertes.fr/hal-01730162
Submitted on 8 Jan 2019
HAL is a multi-disciplinary open access
archive for the deposit and dissemination of
sci-entific research documents, whether they are
pub-lished or not. The documents may come from
teaching and research institutions in France or
abroad, or from public or private research centers.
L’archive ouverte pluridisciplinaire HAL, est
destinée au dépôt et à la diffusion de documents
scientifiques de niveau recherche, publiés ou non,
émanant des établissements d’enseignement et de
recherche français ou étrangers, des laboratoires
publics ou privés.
the Horizontal Plane: A Comparison of VBAP and
Basic-Decoded HOA
Lennie Gandemer, Gaétan Parseihian, Christophe Bourdin, Richard
Kronland-Martinet
To cite this version:
Lennie Gandemer, Gaétan Parseihian, Christophe Bourdin, Richard Kronland-Martinet. Perception
of Surrounding Sound Source Trajectories in the Horizontal Plane: A Comparison of VBAP and
Basic-Decoded HOA. Acta Acustica united with Acustica, Hirzel Verlag, 2018, 104 (2), pp.338 - 350.
�10.3813/AAA.919176�. �hal-01730162�
Perception of Surrounding Sound Source
Trajectories in the Horizontal Plane: A
Comparison of VBAP and Basic-Decoded HOA
Lennie Gandemer1), Gaetan Parseihian1), Christophe Bourdin2), Richard Kronland-Martinet1) 1)Aix Marseille Univ, CNRS, PRISM “Perception Representation Image Sound Music”,
Marseille, France. gandemer@lma.cnrs-mrs.fr 2)Aix Marseille Univ, CNRS, ISM, Marseille, France
Summary
Despite the fundamental role played by sound in multiple virtual reality contexts, few studies have explored the perception of virtual sound source motion in the acoustic space. The goal of this study was to compare the localization of virtual moving sound sources rendered with two different spatialization techniques: Vector Base Amplitude Panning (VBAP) and fifth-order Ambisonics (HOA), both implemented in a soundproofed room and in their most basic form (basic decoding of HOA, VBAP without spread parameter). The perception of virtual sound trajectories surrounding untrained subjects (n=23) was evaluated using a new method based on a drawing-augmented multiple-choice questionnaire. In the spherical loudspeaker array used in this study, VBAP proved to be a robust spatialization technique for sound trajectory rendering in terms of trajectory recognition and height perception. In basic-decoded HOA, subjects exhibited far more disparate trajectory recognition and height perception performances but performed better in perceiving sound source movement homogeneity. PACS no. 43.60.Fg, 43.66.-x, 43.66.Qp
1. Introduction
Virtual reality is increasingly used in ever more applica-tions, from leisure pursuits (e.g. video games) to industrial contexts (from assembly method prototyping [1]) to edu-cation and medicine (e.g. psychotherapy [2]). Sound plays a fundamental role in virtual reality through its capacity to convey information and to reinforce the experience of immersion [3]. Yet sound display has long been neglected compared with video. Numerous techniques can, however, create immersion through sound, using headphones [4] or loudspeakers to spatialize the sound sources [5]. These systems, known as Virtual Auditory Displays (VADs), al-low the synthesis of a virtual acoustic space, creating vir-tual sources that can be moved freely in the acoustic space. Virtual moving sound sources delivered by VAD are al-ready used in various research and musical applications. Thus, the question of the perceptual rendering of these sound source movements is fundamental.
These techniques are not always implemented in an ane-choic environment (e.g. in a concert hall, or a reality ap-paratus such as CAVE), and the room hosting the VAD often impacts the sound field produced [6]. We are inter-ested here in the perceptive rendering of moving sources in what we call an “actual implementation”: a normal room
Received 17 October 2016, accepted 19 January 2018.
whose sound reflections are not perfectly compensated. Since a virtual moving sound source can be reproduced by means of different techniques, it is pertinent to determine which technique is the most reliable for moving sound re-production. In this paper, we choose to focus on moving sound perception in a VAD, comparing two fundamentally different spatialization techniques, both implemented in a normal room: High Order Ambisonics (HOA) and Vector Based Amplitude Panning (VBAP).
The HOA approach aims at reconstructing a 3D sound field using a loudspeaker array [7]. The sound field is first projected on a spherical harmonics basis, which gives an intermediate spatial description of it [8]. Then, the plane-wave-based approximation of this 3D sound field can be reconstructed at one particular point, after a decoding step taking into account the surrounding loudspeaker system [9]. By contrast, VBAP is an extension of stereophony to 3D, which simulates the position of sound sources us-ing perceptual illusions. VBAP distributes the signal onto two or three loudspeakers according to a panning law to create phantom sources (a source which is perceived in-between loudspeakers). Although some authors consider VBAP and HOA as respectively related to a perceptual and a physical approach [10], we will here refer to global vs local panning. The HOA approach (global panning) uses the whole loudspeaker array to reconstruct the sound field, whereas with VBAP (local panning), only a subset of loudspeakers is used.
In the present study, we compare VBAP and HOA in terms of perception of sound source trajectories surround-ing the subjects. This issue of perception of sound tra-jectories was raised by a previous study in which we ad-dressed the influence of a rotating auditory stimulus on the postural regulation of standing subjects [11]. In that study, the postural sway of subjects was measured while they were exposed to various rotating stimuli. The rotat-ing sound sources were travelrotat-ing along a virtual circle surrounding the subjects at ear level, and rendered using third-order HOA. At the end of the experiment, the sub-jects were informally questioned about their perception of sound trajectories. Trajectory perception appeared to vary widely among subjects. Moreover, the trajectories reported by the subjects were often quite different from the trajecto-ries presented (for example, an arc of a circle, or a straight line instead of a circle). This variability could have been introduced by the sound spatialization method used in this experiment, which is why we consider it vital to determine the impact of the sound reproduction approach on dynamic auditory localization performances.
2. Background: perception of moving
sound sources
There have been few investigations into localization of moving sound sources in the acoustic space. Yet, percep-tion of moving sound has been extensively studied through a wide variety of paradigms (see Carlile and Leung [12] for a global overview of the topic).
Most studies on moving sound perception focused on determining different kinds of motion perception thresh-olds. They usually investigated the Minimum Auditory Moving Angle (MAMA), defined as the smallest angle a sound must travel before its direction is correctly discrim-inated. Extensive work in this field was originally carried out by Grantham [13] and Perrott [14], and investigations on MAMA continued thereafter (see for example a recent paper by Lewald [15]). These studies helped to charac-terize auditory mot ion perception resolution, showing for example that this resolution decreases (greater MAMA) when sound source velocity increases, or is poorer in the vertical plane than in the horizontal plane. Other studies focused on velocity perception: the velocity discrimina-tion threshold [16] or the weight of acoustic cues used in velocity perception [17]. Similarly, Lufti and Wang inves-tigated the weight of different acoustic cues in the discrim-ination of sound source displacement, velocity and accel-eration [18]. More generally, the motion perception thresh-old was addressed via other paradigms. A study conducted by Feron et al. [19] investigated the upper limits of audi-tory motion perception by determining the point at which a sound rotating around the listener is no longer resolvable as such. They found that beyond a speed of 3 rotations per second, subjects are no longer able to hear a rotating sound. In another study by Yost et al. [20], subjects were asked whether or not they perceived sound source motion in various conditions in which the listeners (eyes open or
closed) and/or the source were rotated. As variations in acoustic cues used for sound localization can be caused either by source motion or self-motion, this study aimed at investigating which additional sensory cues the listener uses to identify the cause of the variations in acoustic cues. In addition, some studies explored the motion extrapola-tion of auditory trajectories, through “predicting moextrapola-tion” tasks. In these experiments, listeners are presented with a looming sound source (i.e., an approaching sound stim-ulus) that stops playing on the way; they are then asked to judge when the source would have reached them if it had continued to move toward them at the same speed [21]. While the first studies were unimodal (with auditory stimuli), later studies involved bimodal stimuli (auditory-visual targets) to determine the weight of each input in the motion extrapolation [22, 23].
Other research directions explored perceptual illusions induced by sound source displacement: auditory motion after-effect (a bias in static sound source localization that occurs after repeated presentation of a moving sound source [24]), or auditorily-induced illusory self-motion (also called vection - see Valjamae [25] for a review).
There have been only a few brief investigations of per-ception of the trajectories themselves, rarely leading to publications. The earliest contribution we found in the lit-erature is an informal test conducted by Blauert [26] (page 272), in which a rotating trajectory on a 6-loudspeaker ring in the azimutal plane was simulated around the lis-tener, using amplitude and phase modulations of a sinu-soidal signal. According to the delay of the phase modu-lation, Blauert reported the perception of either an ellipse at a positive elevation or the intended circular trajectory. Then, in a study conducted in a Virtual Auditory Display using VBAP, authors investigated the perception of various trajectories in the frontal plane. They showed that changes in azimuth were better perceived than changes in elevation, which were perceived stepwise, and that measured trajec-tories had a tendency to bend towards the loudspeaker po-sitions [27]. In another study comparing binaural render-ing and VBAP renderrender-ing with 8 or 24 loudspeakers, the authors synthesized a complex trajectory that “seemed like a fly moving in and out all around the listener” [28]. The study was only conducted on 4 subjects, and the meth-ods and results analysis lack clarity; however, their results suggest that a larger configuration of speakers can sup-port a more accurate perception of complex auditory mo-tion. Another study conducted by Dunai et al. [29] using binaural rendering of impulse train sounds addressed the influence of the inter-click interval on sound localization accuracy. Trajectories were pseudo-random variable dis-tance displacements rendered in the frontal plane. The au-thors demonstrated that the best localization results were achieved for an inter-click interval of 150 ms; moreover, better localization accuracy was ob tained in azimuth than in distance. Another study conducted by Caro Moreno [30] compared the localization and the sound coloration of circle and square trajectories, spatialized using VBAP on different loudspeaker rings (14, 28 or 56
loudspeak-ers). Their results showed that increasing the number of loudspeakers improved the trajectory localization but in-duced a detrimental sound coloration. Finally, Marentakis and McAdams also investigated trajectory perception on a VAD but pursuing a different goal: the perceptual impact of gesture control of spatialization [31]. Their experiment compared trajectory recognition by subjects exposed to 1 - a unimodal condition (auditory stimulus alone rendered in VBAP) and 2 - a bimodal condition in which a “per-former” made gestures congruent or incongruent with the sound trajectory. The congruent gestur es were found to enhance trajectory recognition whereas incongruent ges-tures impeded it, as the listener’s attention was shifted to incongruent visual cues.
This review of the literature on moving sound percep-tion shows that the few studies addressing trajectory recog-nition used VBAP or binaural techniques, but none used HOA. Moreover, to date these different techniques have not been directly compared. To fill this gap, we systemat-ically address the issue of the perception of sound source trajectories rendered by Virtual Auditory Displays (VAD) using both VBAP and HOA techniques. As a preamble to this study, we decided to compare the precision of static sound source localization in VBAP and HOA. We found that VBAP was more precise than HOA, especially in el-evation perception and in front-back confusion rate [32]. In the present paper, our objective is to determine whether these trends persist when moving sound sources are used.
3. Methods
Our study investigated the perception of sound source tra-jectories in the horizontal plane, using two different sound spatialization systems: Vector Base Amplitude Panning (VBAP) and High Order Ambisonics (HOA). This re-quired sound trajectories to be rendered with a 3D sound spatialization system and a new response interface to be designed.
3.1. Subjects
The study group consisted of 23 subjects (9 women and 14 men) aged between 20 and 59 (mean±std: 30.4±9.5 years). Subjects were students or researchers from acous-tics or microbiology laboratories. A few subjects had pre-vious experience in psychoacoustic experiments but none of them could be considered experts in sound localization. None of the subjects reported auditory loss. All of them participated on a volunteer basis and signed an informed consent form prior to testing. This study was performed in accordance with the ethical standards of the Declaration of Helsinki (revised Edinburgh, 2000).
3.2. Experimental set-up: spherical loudspeaker ar-ray
The experimental set-up consisted of a sound spatializa-tion system making it possible to immerse subjects in an acoustic field. Forty-two loudspeakers were equally
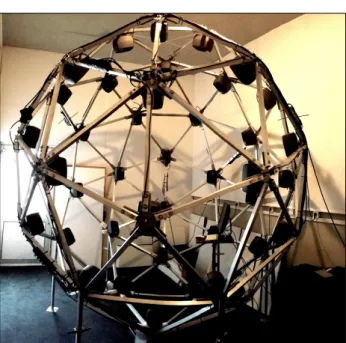
Figure 1. The spherical loudspeaker array.
Table I. Loudspeaker positions in spherical coordinates (azimuth and elevation) in degrees. Coordinates in bold stand for the sub-set of 18 loudspeakers used to simulate horizontal trajectories in VBAP (in HOA, the 42 loudspeakers were active).
az el az el az el az el -60 -69 158 -35 -150 0 98 35 60 -69 0 -21 150 0 -142 35 180 -69 -120 -21 0 11 142 35 0 -53 120 -21 -120 11 -60 53 -120 -53 60 -11 120 11 60 53 120 -53 -60 -11 -60 21 180 53 -38 -35 180 -11 60 21 0 69 38 -35 -30 0 180 21 -120 69 -82 -35 30 0 -22 35 120 69 82 -35 -90 0 22 35 -158 -35 90 0 -98 35
distributed on the vertices of a metallic geodesic sphere (see Figure 1). A geodesic sphere is a discretized sphere formed by a complex network of triangles. Here, the F2 frequency geodesic sphere contained 42 vertices and 120 bars. The bars were simply screwed onto the junctions and separated by rubber slivers to limit the transmission of vi-brations. Thus the loudspeakers screwed onto the junc-tions were acoustically de-coupled from the metal struc-ture. The diameter of the metal structure was 3m20, mean-ing that the 42 loudspeakers were positioned on an imagi-nary sphere approximately 3 meters in diameter. This dis-tance is sufficient for the loudspeakers to be considered to deliver plane waves. The precise position of the loud-speakers on the sphere is given in Table I. The angular gap between two adjacent lo udspeakers was either 31.7◦ or 36◦. Due to the nature of the spatialization techniques compared in this study, the two algorithms did not use the same number of loudspeakers: in VBAP, only the 18 loud-speakers closest to the azimuthal plane were excited (see
Table I), whereas in HOA, all the 42 loudspeakers were active.
The loudspeakers were Genelec 8020C two-channel active monitoring systems (frequency response: 65 Hz – 21 kHz). The room hosting the structure measured approx-imately 5 x 4 x 4 m and was not perfectly rectangular. Effective soundproofing was provided by rockwool lining the walls and carpet on the floor, so that the reverbera-tion time was between RT60 =538 ms at f = 125Hz and
RT60 =155 ms at f = 8000 Hz (further details in the Ap-pendix). The overall background noise level was 24 dBA.
The subjects were positioned inside the loudspeaker structure, with their heads in the very center of the sphere. A fuller description of the system as well as the results of a static sound source localization test conducted in the system can be found in [32].
3.3. Stimuli
As stated in the introduction, this work is motivated by the results of a previous study in which we addressed the influ-ence of a rotating auditory stimulus on the postural regula-tion of standing subjects [11]. In that study, where we used a pink noise sound source rotating at various speeds on a circular trajectory centered on the subject, perception of sound trajectories was observed to vary widely among sub-jects. Here, the sound stimuli (sound source nature, speed and trajectories) were chosen principally so as to repro-duce the sound stimulation used in that previous study.
Thus, the dynamic sound source was a pink noise ro-tating at an angular speed of 180◦/s (the speed which had resulted in the strongest postural effects in our previous study), far below the upper limits of auditory rotational motion perception [19]. This source traveled along five different trajectories around the subject: three circles (cen-tered on the subject, shifted 0.5 m forward, shifted 0.5 m to the right), and two ellipses (front-back or left-right di-rection)(see Figure 2). The radius of the circle trajecto-ries was set at r = 2 m, in accordance with the size of the spatialization system: the radius of the system was 1.5 m, and ambisonic synthesis without NFC1 does not allow sound sources to be positioned inside the sphere of loudspeakers. Therefore for circles with a 2 m radius, the sound source was traveling outside the sphere, both when centered and when shifted. For the ellipse trajec-tories, we set the semi-major axis at a = 3 m and the semi-minor axis at b = 1.5 m. Thus, the eccentricity e was
e = pa2+b2/a = 0.86, which is close to 0.9, a value known to match the perceptive prototypical ellipse geom-etry [34].
All these trajectories were set on the horizontal plane at ear level. Both the direction of the rotation (clockwise or anti-clockwise) and the beginning of the trajectory were chosen randomly.
The trajectories were rendered using two different spatialization techniques: VBAP and HOA (at fifth or-der). Sound spatialization was produced using Ircam 1The Near Field Compensation developed by Daniel [33].
Figure 2. Top view of the five trajectories presented to the sub-jects in the experiment (trajectories were randomized in direc-tion.
SPAT software (www.forum.ircam.com) in a Max/MSP (www.cycling74.com) environment2. Each spatialization technique was used in its most basic form. For HOA,
ba-sicdecoding was used, no optimization such as maxRe or inP hase was applied, and encoding was done without NFC3. Similarly, for VBAP, the spread parameter of the multiple-direction VBAP algorithm was not used. These processes of technique optimization and hybridization will be further discussed in the discussion section.
At the center of the system, where the listener was po-sitioned, the sound amplitude was 50.5 dBAin VBAP and 54 dBAin HOA for the centered circular trajectory (for the other trajectories it was not possible to measure sound am-plitudes, as the distance between the source and the center kept varying). Rather than setting the same sound ampli-tude for both spatialization techniques, we equalized it rel-ative to the perceived loudness. HOA involves more chan-nels than VBAP, thereby producing higher amplitudes of sound for the same loudness.
For both spatialization techniques, two sound source morphology features were used to better simulate dis-placement. First, SPAT integrated sound amplitude dimin-ishing with distance from the listener (“drop” parameter set at 6, meaning that the energy of the source is reduced by 6 dB each time the distance doubles [35]). Then, we added a Doppler effect producing changes in the sound amplitude and the frequency content of the sound source (this latter effect did not modify the source dramatically). These tools, especially amplitude variation [36], make it possible to simulate variation in distance, which is in-cluded in neither VBAP nor HOA (as implemented here, without NFC) theory. However, we chose the size of the trajectories, i.e. the radii of the circles and ellipses, such that the distance between the listener and the sound source did not vary substantially, which prevented the content of the sound from being affected by sharp morphologi-cal changes [37]. It should be noted that the aim of this study was not to examine how the morphological attributes of sound impact the perception of sound source displace-ment, but rather to explore the precision of the spatial re-production achieved using HOA and VBAP techniques.
3.4. User response interface
This experiment required us to develop a specific inter-face for the subjects to report their responses. In static 2More details on the Max/MSP settings are given in the Appendix. 3More details on the HOA parameters are given in the Appendix.
sound localization studies, pointing (hand or head point-ing [38], eye pointpoint-ing, etc.) is generally used to report subjects’ answers. However pointing tasks are difficult to adapt to dynamic studies, especially if the trajectories are not rendered solely in the frontal plane, as in our experi-ment. Some static localization studies also used the God’s Eye Localization Pointing (GELP) technique, a technique in which the subjects indicate the per ceived direction of the sound by pointing at a scale model sphere [39]. This could be adapted to dynamic localization, by asking the subjects to draw the perceived trajectory around a scale model sphere representing their head. However the tech-nique is known to induce a significant bias due to the rep-resentation of space [40], and subjects training would be required to ensure reliable results.
The few dynamic sound localization studies we men-tioned in the introduction used either a Multiple-Choice Questionnaire (MCQ) allowing allowing the subjects to choose between various fixed trajectories [31], or free 2D drawing of the trajectories [29, 28]. While MCQ results are easy to analyze, this method may be too restrictive and may influence subject choices. On the other hand, draw-ings can be complex to post-treat and may raise tricky questions like how to compare an ellipse and a more com-plex shape such as an eight loop.
We therefore decided to implement a new method combining MCQ and 2D drawings to obtain an “aug-mented MCQ”. A graphical user interface was designed in Max/MSP and included various questions together with a drawing option. This interface was then put on a tablet us-ing FantaStick (pinktwins.com/fantastick), an application enabling communication via WiFi between Max/MSP and a tablet in front of the subject (cf Figure 3). For each trial, the subject had to answer questions concerning the per-ceived trajectory. The questions (below) ranged from the more general, to avoid influencing their judgment, to the more detailed depending on their previous answers: • Did you perceive the trajectory around you, in front of
you or behind you?
• Which kind of trajectory did you perceive? Here, the choice offered depended on the previous answer: “cir-cle” or “ellipse” if the subject’s previous answer was “around”; “straight line” or “arc of a circle” if their pre-vious answer was “behind” or “in front”.
• On the basis of the first two answers, the described tra-jectory was graphically represented on the user inter-face. Subjects were then given the opportunity to intu-itively shift (with one finger) or rotate (with two fin-gers) the represented trajectory so as to position it ac-cording to their perception.
• At this stage, if subjects were not satisfied with the screen representation, they were given the option of freely drawing the trajectory.
• Finally, the subjects had to evaluate three attributes of the perceived trajectory, moving a slider (without unit feedback):
Figure 3. Configuration of the experiment inside the spherical loudspeaker array.
– the perceived height of the trajectory (set at 0 by de-fault for listener head height; minimum and maxi-mum were set at sphere diameter ±1.5},m),
– the inclination of the trajectory plane (set at 0 by de-fault; minimum and maximum were set at ±90◦),
– the fluidity of the sound source displacement, de-scribed to subjects as the smoothness and the homo-geneity of the displacement they perceived.
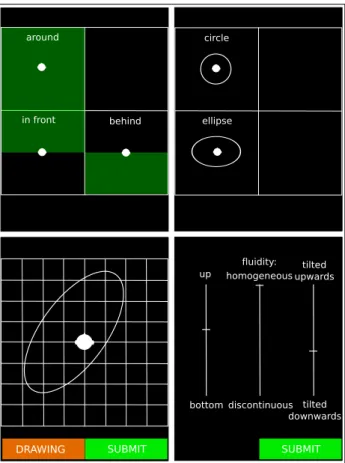
An overview of the interface through 4 screenshots is given in Figure 4. This new interface allowed subjects to report quickly and precisely the trajectory they heard. It also has the advantage of providing various levels of an-swer: general answers that are easy to process (e.g. sur-rounding trajectory or not) and more detailed answers (e.g. drawings).
3.5. Procedure
Subjects stood with their head placed at the center of the rendering system and maintained in a fixed position with a chinstrap (see Figure 3). The height of the platform was adjusted to allow for the different heights of the subjects. They were asked to close their eyes during the presentation of the sound trajectory and were told to trigger the stimulus themselves when they felt ready.
The sound trajectory was presented for 15 seconds (7.5 rotations around the listener); then, subjects could follow the procedure on the interface as described in the previous section, submit their response and trigger the next stimu-lus. Response time was not limited.
The only information that the subjects were given about the nature of the trajectories they were listening to was that the sound source was moving on a plane. Subjects were not informed that all the trajectories were surrounding them and moving on the horizontal plane alone. Subjects were not trained in sound localization or on the user interface usage before starting the experiment.
The experiment contained a total of 50 stimuli: 2 spa-tialization techniques x 5 trajectories x 5 repetitions. The order of presentation of stimuli and spatialization tech-niques was randomized into 5 blocks of 10 trials. The
in front behind around circle ellipse tilted upwards tilted downwards bottom up fluidity: discontinuous homogeneous
DRAWING SUBMIT SUBMIT
Figure 4. Screen shots of the graphical user interface displayed on the tablet.
whole experiment lasted between 30 and 45 minutes, de-pending on subject speed.
3.6. Data analysis
We first analyzed the data from the drawings, fitting an el-lipse automatically on each drawing using a least-square criterion method. Each fit was then checked: if the fit matched the trajectory drawn, the drawing was replaced by this ellipse in individual subjects’ data. If not, the draw-ing was kept unmodified and the answer was considered as “other”.
The user response interface designed for this experi-ment made it possible to obtain different levels of re-sponse. Some responses were categorical: place were the trajectory was perceived (around, in front, behind) and the type of trajectory perceived (circle, ellipse, arc of a cir-cle, straight line, other). Others yielded continuous param-eters, such as perceived height, fluidity, inclination and po-sition of the center of the trajectory.
First, the “surrounding” nature of the trajectory was an-alyzed, to investigate whether it was perceived to be sur-rounding or not. A binomial set of data (1 if the trajectory was perceived to surround subjects/ 0 if not) was analyzed here using a mixed effects logistic regression.
Then, the relevant continuous parameters were analyzed via a linear mixed effects analysis followed by a Tukey’s post hoc test.
All the statistical analyses were conducted using R [41] with lme4 package [42]. For all the results presented in
the next section, visual inspection of residual plots did not reveal any obvious deviations from homoscedasticity or normality. P-values were obtained by likelihood ratio tests testing the full model with the effect in question against the model without the effect in question. Then, planned comparisons were performed when necessary.
4. Results
Given that the response interface was custom designed for this experiment and previously untried, the subjects were questioned informally at the end of the experiment about their experience with the interface. Overall, they were sat-isfied with the interface (for most of the trials, they were able to report the trajectory they perceived and its charac-teristics without difficulty).
To avoid any possible confusion between the use of “tra-jectory” to mean the trajectory presented to the subjects (sound stimulus) and the trajectory they perceived (subject response), we chose in the following to label the former “stimulus trajectory” and the latter “response trajectory”.
4.1. Categorical parameters: recognition of the tra-jectories
The categorical parameters were analyzed using a mixed effect logistic regression. As fixed effects, the spatializa-tion technique, the stimulus trajectory and the repetispatializa-tion were entered into the model. As random effects, there were intercepts for subjects.
1. Surrounding nature of the trajectory and inter-subject variability
The perception percentage for each trajectory according to spatialization technique and stimulus trajectory is pre-sented in Figure 5. With the VBAP technique, subjects were much more likely to report surrounding trajectories (more than 90% circles and ellipses reported for each tra-jectory type) than with the HOA technique (around 60% on average). This difference was found to be significant (χ2(1) = 273.67, p < 0.0001). No significant effect on the perception percentage of surrounding trajectories was re-vealed for stimulus trajectory, nor any interaction between stimulus trajectory and spatialization techniques. Here, it should be noted that sound trajectory recognition was highly subject-dependent, as shown in Figure 6. Some sub-jects were able to hear circles and ellipses in most cases, whereas others reported numerous straight lines, arcs of a circle or even more complex shapes. Moreover, this vari-ability was not equal for the two spatialization techniques. Figure 6 shows that the variability was mainly in HOA perception, with the rate of perception of surrounding tra-jectories varying between 0 and 100%. By contrast, with VBAP the rate of perception of surrounding trajectories varied only between 80 and 100%.
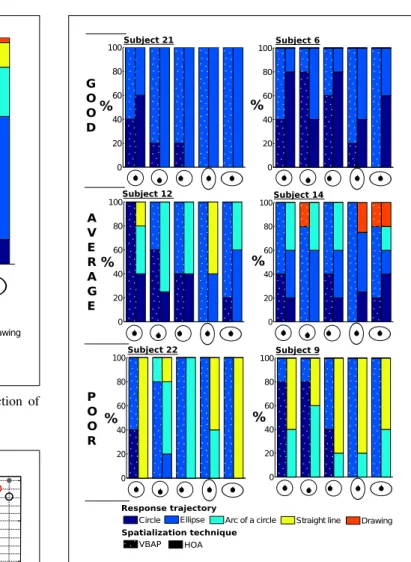
To better characterize this variability, the individual dis-tribution of subjects’ answers was further observed. Fig-ure 7 illustrates the disparity between subjects, with 6 dif-ferent subjects exhibiting various performance levels in
0 10 20 30 40 50 60 70 80 90 100 Circle VBAP HOA
Ellipse Arc of a circle Straight line Drawing
%
Response trajectory
Spatialization technique
Figure 5. Distribution of subjects’ responses as a function of stimulus trajectory and spatialization technique.
0 5 10 15 20 0 20 40 60 80 100 Subject number P er ce nt ag e of su rr ou nd in g tr aj ec to rie s repo rt ed VBAP HOA
Figure 6. Percentage of surrounding trajectories reported by each subject, depending on the spatialization technique. The red dots and circles are for the subjects whose response distribution is represented in Figure 7. Variability is very high in HOA (between 0 and 100%) and low in VBAP (between 80 and 100%).
HOA recognition. The two upper plots are for subjects achieving a good recognition of surrounding trajectories in both spatialization techniques (subjects 6 and 21); the two middle plots represent the results for subjects achiev-ing medium-level recognition of surroundachiev-ing trajectories rendered in HOA (subjects 12 and 14); the lower plots are for subjects achieving poor recognition of surrounding tra-jectories in HOA (subjects 9 and 22).
These plots also show that not all subjects were con-sistent in their responses. For example, whereas subject 6 gave really consistent responses and reported mainly el-lipses even in the circle stimulus conditions, subject 9
re-0 20 40 60 80 100
Circle Ellipse Arc of a circle Straight line Drawing 0 20 40 60 80 100 % 0 20 40 60 80 100 % 0 20 40 60 80 100 0 20 40 60 80 100 0 20 40 60 80 100 % % % % HOA VBAP Subject 21 Subject 6 Subject 14 Subject 12 Subject 9 Subject 22 Response trajectory Spatialization technique P O O R A V E R A G E G O O D
Figure 7. Examples of individual distributions of responses as a function of stimulus trajectory and spatialization technique, for 6 different subjects. Recognition of the surrounding nature of the trajectory was good for all subjects in VBAP, but highly vari-able in HOA. Top: two subjects with good surrounding trajectory recognition under both techniques (100% surrounding trajectory recognition in HOA too). Middle: two subjects with a
medium-leveltrajectory recognition rate in HOA. Bottom: two subjects with a poor trajectory recognition rate in HOA.
ported varying proportion of circles and ellipses in all the conditions.
2. Types of trajectories
Figure 5 shows that circles and ellipses were frequently confused, especially for the circle trajectories. Confusions occurred with both spatialization techniques. Centered cir-cle: VBAP yielded 35% reports of ellipses against 60% of circles, while HOA yielded 15% reports of ellipses against 40% of circles. Shifted circles: VBAB yielded around 50% reports of ellipses against 40% of circles, HOA around 30% reports of ellipses against 30% of circles. Ellipses: there were around 10% reports of circles with both spa-tialization techniques, and reports of ellipses came to 90% for VBAP and 50-60% for HOA. Figure 7 shows that the rate of confusion between circles and ellipses is subject-dependent, but not correlated with recognition that the
tra-jectories were surrounding the subject. For instance Sub-ject 9, whose surrounding traSub-jectory recognition was poor (0% in HOA), had a low rate of confusion between cir-cles and ellipses in VBAP. Conversely, Subject 6 reported 100% of surrounding trajectories in HOA and VBAP, but frequently confused circles and elli pses under both spa-tialization techniques.
4.2. Continuous parameters: trajectory characteris-tics
The continuous parameters were analyzed using a mixed effect linear regression. As fixed effects, the spatialization technique and the stimulus trajectory were entered into the model. As random effects, there were intercepts for sub-jects. Here, the repetition factor was not entered into the model, as the effect of repetition was of no interest and be-cause the continuous parameters could be averaged over the various repetitions, unlike the categorical parameters. 1. Perceived height of the trajectory
The results for perceived height of the trajectory are pre-sented in Figure 8. They clearly show that the trajecto-ries were perceived to be higher under the HOA tech-nique (0.5 meters high on average) than when using VBAP (around 0 meters high). This result is significant (χ2(1) = 185.41, p < 0.0001). No significant effect of stimulus trajectory and no interaction between spatialization tech-nique and stimulus trajectory were found.
2. Fluidity of the sound source displacement
Results for perceived fluidity of the sound source displace-ment are presented in Figure 8. We can see that the trajec-tories were perceived to be more homogeneous under the HOA technique when using VBAP. This result is signifi-cant (χ2(1) = 46.23, p < 0.0001). No significant effect of stimulus trajectory and no interaction between spatializa-tion technique and stimulus trajectory were found. 3. Inclination of the trajectory
No significant effect of spatialization technique or stimu-lus trajectory was found on the inclination of the trajec-tory: the inclination was around zero degrees on average. 4. Center of the trajectory
Results for the position of the center of the perceived tra-jectory, showing whether the subjects were able to per-ceive the shift in the circle, are reported in Figure 9. The linear regression highlighted a significant effect of stimu-lus trajectory on the position of the center of the trajectory in both directions (front-back: χ2(4) = 40.32, p < 0.0001 , left-right: χ2(4) = 45.20, p < 0.0001). For the front-back direction, the Tukey post-hoc test showed that for the second stimulus (circle shifted forward), subjects re-ported one trajectory whose center was positioned signif-icantly differently from that of the other four trajectories (p < 0.001). For the left-right direction, the Tukey post-hoc test showed that for the third stimulus (circle shifted to the right), subjects reported one trajectory whose cen-ter was positioned significantly differently from that of the
VBAP HOA −1. 5 1 .0 −0. 5 0 0. 5 1 .0 1 .5 Spatialization technique Per cei ved h ei gh t ( m) VBAP HOA 0 10 0 20 0 3 00 40 0 50 0 Spatialization technique Fl u idi ty ( a. u .)
Figure 8. Left: Boxplot representing the perceived height of the trajectory for the two spatialization techniques. Right: Boxplot representing the perceived fluidity (arbitrary unit) of the sound source displacement trajectory for the two spatialization tech-niques. Red dots represent the mean.
1 2 3 4 5 -1 .5 Sound stimulus Sh if t ( a. u .) -1 .0 -0 .5 1.0 0.5 0 1 2 3 4 5 -1 .5 Sound stimulus Sh if t ( a. u .) -1 .0 -0 .5 0 0.5 1.0
Figure 9. Boxplot representing the position of the center of the trajectory (arbitrary unit) perceived by subjects as a function of the five stimulus trajectories. Red dots represent the mean. Left: Position along the antero-posterior axis (front-back). Right: Po-sition along the medio-lateral axis (left-right).
other four (p < 0.01). There was no effect of the ization technique and no interaction between the spatial-ization technique and the stimulus trajectory. These results show that the subjects were able to perceive the shift of the circle with both spatialization techniques.
5. Discussion
This experiment aimed at comparing the perception of sur-rounding sound source trajectories rendered using two dif-ferent sound spatialization techniques: Vector Base Am-plitude Panning (VBAP) versus fifth-order Ambisonics with basic decoding (HOA). The experiment was con-ducted on untrained subjects of various ages without re-ported hearing loss. All the stimulus trajectories presented to the subjects used pink noise traveling on a circle or an ellipse around the subjects (five different trajectories), on the horizontal plane at ear level. Thanks to a specially de-signed graphical user interface, subjects could report their perceptions of the different trajectories (choosing from
cir-cles, ellipses, straight lines, arcs of a circle or free draw-ings).
In the results section, we showed that trajectory recog-nition varied widely among subjects, mainly when HOA was used. We will first discuss the general results for the whole group and then the inter-subject variability.
5.1. General results
The main differences found between VBAP and HOA con-cerned 1- the degree to which subjects felt surrounded by the trajectories, 2- the height and 3- the fluidity of the tra-jectories.
5.1.1. Subjects felt more surrounded by the VBAP tra-jectories
Firstly, subjects exhibited a significantly higher trajectory recognition rate with VBAP than with HOA. The first de-scriptor investigated here was the surrounding nature of the trajectory. Subjects reported surrounding trajectories far more with VBAP (around 90-95%) than with HOA (around 60%), for which they reported a lot of arcs of a circle or straight lines. Even though the subjects were not trained in sound spatialization and localization tasks, the VBAP technique here allowed more robust reproduction of sound trajectories. This is in line with results previously obtained with static sources [32].
This difference between perceptions in HOA and VBAP could be explained by the nature of these techniques. VBAP distributes the input signal over various loudspeak-ers, which distorts Interaural Level Differences (ILD). However it does not impact either low frequency Inter-aural Time Differences (ITD) or high frequency spectral cues, which remain valid [43]. Subjects localizing a virtual source rendered in VBAP can therefore rely on these audi-tory cues. Conversely, HOA recreates an approximation of a 3D sound field using an intermediate spatial representa-tion of the sound field. This spatial descriprepresenta-tion is truncated at a point depending on the order of the HOA system. The truncation limits the reconstruction of the sound field; it induces a cutoff frequency in the HOA system, which de-pends on the area of reconstruction and the order of the system [44]. At fifth order, and for an area including an av-erage head, the cutoff frequency is about 3000 Hz. Above this cutoff frequency, the sound field reconstruction is de-graded.
Moreover, HOA reconstructs a perfect sound field up to 3000 Hz only where there is no obstruction. However, the listener’s head positioned within the area of recon-struction, causes a frequency-dependent obstruction of the loudspeaker contributions, thereby distorting the sound field. Thus, all the acoustic cues are degraded, including the high-frequency spectral cues known to allow the lis-tener to resolve ambiguities in sound source localization [26]. The deterioration of the spectral cues may induce confusions (e.g., front-back confusions which are known to be frequent in untrained subjects [45] and when the sub-ject’s head is fixed). These potential confusions could ex-plain the fact that some subjects perceived arcs of a circle
or even straight lines instead of the circles and ellipses pre-sented to them.
The difference between VBAP and HOA may also be explained by the room effect. VBAP is a local pan-ning method, using only 3 loudspeakers simultaneously, whereas HOA is a global panning method activating the 42 loudspeakers at the same time. With local panning, the sound field produced in the listening room may be less sensitive to the room effect than with global panning. The room effect is crucial when attempting to reproduce pre-cise sound fields with multichannel sound reproduction systems; several techniques have been developed to com-pensate for it (see for example the active room compensa-tion [6]).
A closer precise investigation of the trajectory percep-tion here shows that subjects had difficulty discriminating between circles and ellipses, whatever the sound spatial-ization technique. The confusion rate between circles and ellipses was uniformly high, especially for the three circle stimuli (between 30–50% confusion for both spatializa-tion techniques). This result is probably due to the fact that distance cues were voluntarily not fully implemented (see section 2.3), but were simulated mainly through varying the source intensity. We did not provide fundamental dis-tance cues such as direct-to-reverberant energy ratio (we used no reverberation) or filtering due to air absorption. This may have prevented subjects from reliably assessing source distance variation [36], and thus from discriminat-ing between circles and ellipses, especially since they were not familiar with the sound source.
It should be noted, however, that our aim here was to compare the precision of sound trajectory synthesis ob-tained with different spatialization techniques, not to in-vestigate the absolute human ability to perceive sound tra-jectories. The confusions between circles and ellipses ob-served with both spatialization techniques could be due ei-ther to the subjects’ limited perception skills, or to artifacts in trajectory reproduction related to the sound spatializa-tion techniques. The next step in this research could be to produce a sound source physically rotating around sub-jects and evaluate its perception with the same user inter-face. Then we could compare the results of both experi-ments and assess separately 1) the human ability to per-ceive sound trajectories and 2) the ability of sound spa-tialization techniques (and systems) to reliably synthesize sound trajectories.
5.1.2. Trajectories are perceived too high in HOA Concerning perception of height, the elevation of the tra-jectory was better perceived in VBAP than in HOA: on average, trajectories in VBAP were perceived at ear level, while in ambisonics they were generally perceived too high. An obvious explanation for this tendency is the way sound source trajectories are rendered in ambisonics. In HOA, the 42 loudspeakers of our system always had to be active to reconstruct the 3D sound field. However, our am-bisonic system was calibrated without any subject inside. The presence of a subject inside the sphere undoubtedly
caused absorption of the downward loudspeaker contribu-tion, thereby deforming the sound field rendered by the system and resulting in distorted monoral cues. This sound field distortion may explain the differences in height per-ception, although further experiments will be required for confirmation.
5.1.3. HOA: more fluidity of displacements
In contrast, the HOA technique scored higher than VBAP on the fluidity of the sound source displacement. When the sound source approaches one loudspeaker, VBAP is known to perceptually provoke a ‘magnetization’ of the sound source on this loudspeaker, i.e. the virtual source is perceived as closer to the loudspeaker than it should be [46]. Here, we chose to investigate trajectory fluidity because with VBAP we were expecting a magnetization effect on loudspeakers close to the horizontal plane. This magnetization should cause the trajectory to be perceived as less smooth and more disturbed, which appears to be borne out here.
5.1.4. Hybridization of spatialization techniques On the whole, the HOA technique was found here to be less efficient than VBAP in reproducing dynamic tra-jectories with precision, causing the subjects to report many more wrong trajectories, and to perceive the trajec-tories too high. However, VBAP suffers from poor fluid-ity and homogenefluid-ity of the sound source displacement. To overcome the mutual limitations of these techniques, other techniques and optimizations have been developed as compromises between local and global panning ap-proaches. For example, HOA decoding has been optimized for better perceptual results: maxRe optimization of HOA maximizes the energetic contributions of the loudspeakers closest to the virtual sound source [47], whereas inP hase optimization deletes the contributions of the loudspeak-ers opposite the sound sources [48]. These optimizations were first designed to better cope with imperfect set-up situations (i.e. when the listener is not placed at the cen-ter of the system). maxRe optimization has been shown to improve static localization performances as compared to basic decoding in HOA [49]. More recently, another HOA decoding technique directly based on VBAP pan-ning techniques was developed [50]. Zotter et al. [51] also developed a reverse hybridization of VBAP and HOA, with VBAP-based HOA decoding, designed for irregular loudspeaker arrangements. Thus, despite of the scarcity of studies addressing perceptual differences between spa-tialization techniques, these HOA optimizations suggest a growing awareness that better perceptual results are ob-tained using local panning approaches such as VBAP. The present study offers quantitative results to support this view. They highlight the gap between the approxima-tions of a soundfield reproduced with basic-decoded HOA, based on an ideal scenario, and the reality of human per-ception.
There is also evidence that VBAP’s limitations that can be overcome using principles inspired from the am-bisonic approach. For example, Pulkki [52] implemented
a multiple-direction VBAP algorithm to better control the spread of a sound source and avoid changes in spread when the source is moved (when a virtual signal seems to come from the direction of a loudspeaker, the virtual source is consistently localized on this loudspeaker, whereas when it is panned between loudspeakers, it appears spread). This approach uses more loudspeakers than the original triplet to better control sound source spreading and to limit mag-netization of the source on the loudspeaker, thereby ob-taining a more faithful rendering than original VBAP. A similar approach by Borss [53] uses N-wise panning with polygons instead of triplets of loudspeakers.
5.2. High variability in HOA perception
The difference in trajectory recognition between VBAP and HOA varied widely among subjects. At first glance, this high inter-subject variability in response to the two techniques is surprising. However, it can be explained by the unusual nature of the task (tracking a sound source and imagining its trajectory), the subjects’ lack of familiarity with the stimulus (pink noise is an abstract source), the fact that subjects had their head fixed and, above all, the fact that subjects were not trained in sound spatialization perception. Closer investigation of individual responses showed, however, that this variability mainly stems from subjects’ widely differing HOA perception: subjects had a uniformly good trajectory recognition rate in VBAP. This observation confirms that the variability did not come from the response interface. All the subjects were satisfactorily enabled to report their perceptions, a confirmation rein-forced by informal feedback from the subjects after the test. Moreover, it proves that the variability of the results is not due to some subjects’ hearing problems.
Some subjects’ trajectory recognition performances were good under both sound spatialization techniques. They reported only a few non-surrounding trajectories and showed few differences in performance between spatial-ization techniques (see the upper plots of Figure 7). Other subjects exhibited huge differences between techniques, reporting in HOA many (or solely) arcs of a circle and straight lines (see the bottom plots of Figure 7). Some subjects fell between these two extremes, with medium-level performances in HOA (middle plots in Figure 7). Nu-merous subjects thus seemed to have difficulties using the complex signals produced in HOA to accurately perceive the displacement of a sound source along its trajectory. These subjects may have been more sensitive to the errors of approximation inherent in the HOA rendering, resulting in biased spatial perception of the trajectories rendered in HOA. It would be interesting to determine, using a larger subject sample, if these results reflect a continuum of per-ceptual judgments, or whether the subjects can be grouped according to their ability to perceive sound spatialized in HOA.
The causes of such variability in perception of the au-ditory environment are also worth exploring. At the be-ginning of the experiment, we collected some informa-tion on each subject: sex, age, left- or right-handedness,
and expertise in music and sound perception (the latter via two closed-ended questions: “Are you a musician?” and “Are you used to auditory perception tests?”). None of these factors was able to predict the subjects’ perfor-mances in HOA perception, with the two extremes - i.e. good and poor recognition of surrounding trajectories -containing both young and old subjects, musicians and non-musicians, men and women, etc.
A parallel can be drawn wwith stereoscopic visualiza-tion on digital displays. Stereoscopy is a visual illusion of depth created by means of two images showing different views of a scene. A proportion of the population has diffi-culty properly combining the horizontal binocular dispari-ties of the two images and perceiving depth: they are said to be “stereoblind”. Stereoblindness has been consistently reported to affect 14% of the population [54]. Optometric vision training allows stereopsis recovery [55]. Similarly, in spatial audio perception, some people seem to have more difficulty perceiving complex 3D sound fields gen-erated in ambisonics. Perhaps training, already known to improve static localization performances [56], could help them achieve better results.
6. Conclusion
To our knowledge, this study is the first to compare the perception of VBAP and HOA methods in a Virtual Au-ditory Display using surrounding trajectories. Overall, in our system and under our protocol conditions (basic de-coding of HOA, untrained subjects), VBAP provided bet-ter scores on trajectory recognition and height perception, whereas HOA provided better scores on sound source dis-placement fluidity. With both techniques, subjects had dif-ficulties discriminating between circles and ellipses, sug-gesting either insufficient precision in the reproduction of trajectory and distance cues or the inadequate perceptual skills of untrained subjects.
Moreover, a high inter-subject variability clearly emerged from our results: whereas some subjects’ trajec-tory recognition performances were good in both spatial-ization techniques, others were good in VBAP but poor in HOA. The reason for this variability remains an open ques-tion and an exciting challenge for the auditory percepques-tion field.
This study’s finding highlight the importance of choos-ing the sound spatialization technique to be used in a vir-tual reality context according to the sound scenario in-tended. Recent theoretical developments of methods hy-bridizing local and global panning techniques to overcome their mutual limitations are promising, although the per-ceptual evaluation of such technologies requires further in-vestigation.
Acknowledgement
This work was funded by the French National Research Agency (ANR) under the SoniMove: Inform, Guide and Learn Actions by Sounds project
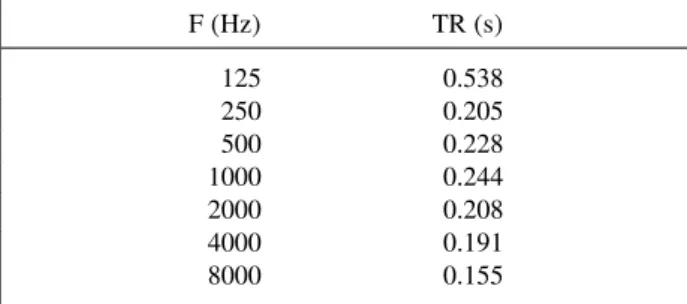
(ANR-14-CE24-0018-Table II. Mean reverberation time in the experimental room as a function of the frequency.
F (Hz) TR (s) 125 0.538 250 0.205 500 0.228 1000 0.244 2000 0.208 4000 0.191 8000 0.155
01). The authors would like to thank Clement Ruffini who took part in the setting up and the operation of the local-ization test.
Appendix
Reverberation Time
For a room hosting a multichannel sound reproduction sys-tem, BS.1116 standard recommends a mean reverberation time of Tm=230 ms ± 0.05 s between 200 Hz and 4000 Hz; Tm=230 ms ± 0.01 s between 4000 Hz and 8000 Hz. The mean reverberation times measured in the various octave bands are presented in Table II.
Max/MSP characteristics Sampling Frequency: 48000 Hz Signal Vector Size: 512 I/O Vector Size: 512
A new panning position was calculated every 10.7 ms. HOA Decoding parameters
Order: 5
Decoding method: energy preserving [10] Decoding type: basic
Decoding norm: SN3D
References
[1] A. Seth, J. M. Vance, J. H. Oliver: Virtual reality for as-sembly methods prototyping: a review. Virtual reality 15 (2011) 5–20.
[2] G. Riva: Virtual reality in psychotherapy: review. Cy-berpsychology & behavior 8 (2005) 220–230.
[3] D. Rojas, B. Cowan, B. Kapralos, K. Colllins, A. Dubrowski: The effect of sound on visual realism percep-tion and task complepercep-tion time in a cel-shaded serious gam-ing virtual environment. Quality of Multimedia Experience (QoMEX), 2015 Seventh International Workshop on, 2015, IEEE, 1–6.
[4] F. L. Wightman, D. J. Kistler: Headphone simulation of free-field listening. ii: Psychophysical validation. The Jour-nal of the Acoustical Society of America 85 (1989) 868– 878.
[5] D. R. Begault, L. J. Trejo: 3-d sound for virtual reality and multimedia. 2000.
[6] S. Spors, H. Buchner, R. Rabenstein, W. Herbordt: Ac-tive listening room compensation for massive multichannel sound reproduction systems using wave-domain adaptive filtering. The Journal of the Acoustical Society of America
122(2007) 354–369.
[7] M. A. Gerzon: Ambisonics in multichannel broadcasting and video. Journal of the Audio Engineering Society 33 (1985) 859–871.
[8] J. Daniel, S. Moreau, R. Nicol: Further investigations of high-order ambisonics and wavefield synthesis for holo-phonic sound imaging. Audio Engineering Society Con-vention 114, 2003, Audio Engineering Society.
[9] J. Daniel, S. Moreau: Further study of sound field coding with higher order ambisonics. Audio Engineering Society Convention 116, 2004, Audio Engineering Society. [10] F. Zotter, H. Pomberger, M. Noisternig: Energy-preserving
ambisonic decoding. Acta Acustica united with Acustica
98(2012) 37–47.
[11] L. Gandemer, G. Parseihian, R. Kronland-Martinet, C. Bourdin: The influence of horizontally rotating sound on standing balance. Experimental brain research 232 (2014) 3813–3820.
[12] S. Carlile, J. Leung: The perception of auditory motion. Trends in hearing 20 (2016) 2331216516644254.
[13] D. W. Grantham: Detection and discrimination of simulated motion of auditory targets in the horizontal plane. The Jour-nal of the Acoustical Society of America 79 (1986) 1939– 1949.
[14] D. R. Perrott, A. Musicant: Minimum auditory movement angle: Binaural localization of moving sound sources. The Journal of the Acoustical Society of America 62 (1977) 1463–1466.
[15] J. Lewald: Exceptional ability of blind humans to hear sound motion: implications for the emergence of auditory space. Neuropsychologia 51 (2013) 181–186.
[16] S. Carlile, V. Best: Discrimination of sound source velocity in human listeners. The Journal of the Acoustical Society of America 111 (2002) 1026–1035.
[17] T. Kaczmarek: Auditory perception of sound source veloc-ity. The Journal of the Acoustical Society of America 117 (2005) 3149–3156.
[18] R. A. Lutfi, W. Wang: Correlational analysis of acoustic cues for the discrimination of auditory motion. The Journal of the Acoustical Society of America 106 (1999) 919–928. [19] F.-X. Féron, I. Frissen, J. Boissinot, C. Guastavino: Upper limits of auditory rotational motion perception. The Journal of the Acoustical Society of America 128 (2010) 3703– 3714.
[20] W. A. Yost, X. Zhong, A. Najam: Judging sound rotation when listeners and sounds rotate: Sound source localization is a multisystem process. The Journal of the Acoustical Society of America 138 (2015) 3293–3310.
[21] L. D. Rosenblum, M. S. Gordon, A. P. Wuestefeld: Effects of performance feedback and feedback withdrawal on audi-tory looming perception. Ecological Psychology 12 (2000) 273–291.
[22] S. Wuerger, G. Meyer, M. Hofbauer, C. Zetzsche, K. Schill: Motion extrapolation of auditory–visual targets. Informa-tion fusion 11 (2010) 45–50.
[23] S. L. Prime, L. R. Harris: Predicting the position of mov-ing audiovisual stimuli. Experimental brain research 203 (2010) 249–260.
[24] M. F. Neelon, R. L. Jenison: The effect of trajectory on the auditory motion aftereffect. Hearing Research 180 (2003) 57 – 66.
[25] A. Väljamäe: Auditorily-induced illusory self-motion: A review. Brain research reviews 61 (2009) 240–255. [26] J. Blauert: Spatial hearing: the psychophysics of human
sound localization. MIT press, 1997.
[27] M. Grohn, T. Lokki, T. Takala: Static and dynamic sound source localization in a virtual room. Audio Engineering Society Conference: 22nd International Conference: Vir-tual, Synthetic, and Entertainment Audio, 2002, Audio En-gineering Society.
[28] J. A. Ballas, D. Brock, J. Stroup, H. Fouad: The effect of auditory rendering on perceived movement: Loudspeaker density and hrtf. Proceedings of the 7th International Con-ference on Auditory Display (ICAD 2001), 2001, Interna-tional Conference on Auditory Display.
[29] L. Dunai, B. Defez, G. Peris-Fajarnés, T. Magal-Royo, V. S. Praderas: Virtual moving sound source localization through headphones. INTECH Open Access Publisher, 2011. [30] D. Caro Moreno: Spatial sound design and perceptual
eval-uation of moving sound sources in amplitude panning (2015).
[31] G. Marentakis, S. McAdams: Perceptual impact of gesture control of spatialization. ACM Transactions on Applied Perception (TAP) 10 (2013) 22.
[32] G. Parseihian, L. Gandemer, C. Bourdin, K.-M. Richard: Design and perceptual evaluation of a fully immersive three-dimensional sound spatialization system. tional Conference on Spatial Audio (ICSA) : 3rd Interna-tional Conference, 2015.
[33] J. Daniel: Spatial sound encoding including near field ef-fect: Introducing distance coding filters and a viable, new ambisonic format. Audio Engineering Society Conference: 23rd International Conference: Signal Processing in Audio Recording and Reproduction, 2003, Audio Engineering So-ciety.
[34] E. Thoret, S. Conan, M. Aramaki, L. Bringoux, C. Gondre, J.-L. Velay, S. Ystad, R. Kronland-Martinet: When hear-ing biological movements reveals embodied motor proper-ties: a new paradigm to study relations between gestures and sounds. The Sensorimotor Theory of Perception and Consciousness: Developments and Open Questions–ASSC Satellite Workshop, 2015.
[35] T. Carpentier: Récents dévelopements du spatialisateur. JIM, 2015.
[36] P. Zahorik: Assessing auditory distance perception using virtual acoustics. The Journal of the Acoustical Society of America 111 (2002) 1832–1846.
[37] J. M. Chowning: The simulation of moving sound sources. Journal of the Audio Engineering Society 19 (1971) 2–6. [38] H. Bahu, T. Carpentier, M. Noisternig, O. Warusfel:
Com-parison of different egocentric pointing methods for 3d sound localization experiments. Acta Acustica united with Acustica 102 (2016) 107–118.
[39] R. H. Gilkey, M. D. Good, M. A. Ericson, J. Brinkman, J. M. Stewart: A pointing technique for rapidly collecting localization responses in auditory research. Behavior Re-search Methods, Instruments, & Computers 27 (1995) 1– 11.
[40] T. Djelani, C. Pörschmann, J. Sahrhage, J. Blauert: An in-teractive virtual-environment generator for psychoacoustic research ii: Collection of head-related impulse responses and evaluation of auditory localization. Acta Acustica united with Acustica 86 (2000) 1046–1053.
[41] R. C. Team: R: A language and environment for statistical computing. r foundation for statistical computing, vienna, austria, 2012. 2014.
[42] D. Bates, M. Maechler, B. Bolker: lme4: Linear mixed-effects models using s4 classes (2012).
[43] V. Pulkki: Localization of amplitude-panned virtual sources ii: Two-and three-dimensional panning. Journal of the Au-dio Engineering Society 49 (2001) 753–767.
[44] C. Oreinos, J. M. Buchholz: Objective analysis of ambison-ics for hearing aid applications: Effect of listener’s head, room reverberation, and directional microphones. The Journal of the Acoustical Society of America 137 (2015) 3447–3465.
[45] A. W. Bronkhorst: Localization of real and virtual sound sources. The Journal of the Acoustical Society of America
98(1995) 2542–2553.
[46] H. Wittek, G. Theile: The recording angle-based on locali-sation curves. Audio Engineering Society Convention 112, 2002, Audio Engineering Society.
[47] M. A. Gerzon: General metatheory of auditory localisation. Audio Engineering Society Convention 92, 1992, Audio Engineering Society.
[48] D. G. Malham: Experience with a large area 3d ambisonic sound systems. Proceedings-Institute of Acoustics 14 (1992) 209–209.
[49] M. Frank, F. Zotter, A. Sontacchi: Localization experiments using different 2d ambisonics decoders. 25. Tonmeisterta-gung (2008).
[50] J.-M. Batke, F. Keiler: Using vbap-derived panning func-tions for 3d ambisonics decoding. 2nd Ambisonics Sym-posium, Paris, 2010.
[51] F. Zotter, M. Frank, A. Sontacchi: The virtual t-design ambisonics-rig using vbap. Proceedings of the 1st EAA-EuroRegio (2010).
[52] V. Pulkki: Generic panning tools for max/msp. Proceedings of International Computer Music Conference, 2000, 304– 307.
[53] C. Borß: A polygon-based panning method for 3d loud-speaker setups. Audio Engineering Society Convention 137, 2014, Audio Engineering Society.
[54] D. Gadia, G. Garipoli, C. Bonanomi, L. Albani, A. Rizzi: Assessing stereo blindness and stereo acuity on digital dis-plays. Displays 35 (2014) 206–212.
[55] D. P. Spiegel, J. Li, R. F. Hess, W. D. Byblow, D. Deng, M. Yu, B. Thompson: Transcranial direct current stimulation enhances recovery of stereopsis in adults with amblyopia. Neurotherapeutics 10 (2013) 831–839.
[56] P. Zahorik, P. Bangayan, V. Sundareswaran, K. Wang, C. Tam: Perceptual recalibration in human sound localization: Learning to remediate front-back reversals. The Journal of the Acoustical Society of America 120 (2006) 343–359.