DISTURBANCES IN THE TROPICAL UPPER TROPOSPHERE
by
Frederick Stewart Zbar
B.S., The City University of New York (The City College of New York)
(1966)
SUBMITTED IN PARTIAL FULFILLMENT OF THE REQUIREMENTS FOR THE DEGREE OF MASTER OF SCIENCE
at the
MASSACHUSETTS INSTITUTE OF TECHNOLOGY January, 1970
Signature of Author ... ... .. ... .J.n.u.r. . . 7. Department of Meteorology', January
2,1970
Certified by
Thesis Supervisor
Accepted by ...
V...
.
.7-...
Chairman, Departmental Committee on Graduate Students
w1THDRAW
\
DISTURBANCES IN THE TROPICAL UPPER TROPOSPHERE
Frederick Stewart Zbar
Submitted to the Department of Meteorology on January 15, 1969 in partial fulfillment of the requirements for the degree of Master of Science.
ABSTRACT
The study consists of a detailed investigation of wave disturbances in the upper tropical troposphere of the western Pacific Ocean using data for a four month period. Cross sections for individual stations of wind and temperature and synoptic analyses are used to establish time and space scales of the disturbances during their active periods. Examination of corresponding mid-latitude events were undertaken to establish possible interactions.
Short period disturbances of four to six days in period are noted in the upper tropical troposphere, the horizontal wavelength of which, is estimated to be approximately 4500 km.
The motions observed appear to be highly latitudinally
dependent, being confined to within ten or twelve degrees of the equator. The vertical depth through which the disturbances extend is approximately 150 mb with their peak intensity found at 200 nb.
An examination of mid-latitude events during the active periods indicated no definite relationship between the tropical eddies
and the mid-latitude trough-ridge pattern.
Thesis Supervisor: Reginald E. Newell Title: Professor of Meteorology
DEDICATION
ACKNOWLEDGEMENTS
The author wishes to express his gratitude to
Professor Reginald Newell whose enthusiasm was a constant source of encouragement and whose discussions gave new perspective to difficult problems.
He also wishes to thank Dr. John W. Kidson who provided invaluable assistance and suggestions in coping with
programming difficulties.
Miss Isabele Cole did excellent work drafting the figures and Miss Diane Lippincott did the typing.
The computing was performed at the M.I.T. Computation Center.
TABLE OF CONTENTS
INTRODUCTION ...
OBSERVATIONAL EVIDENCE OF UPPER TROPOSPHERIC DISTURBANCES IN THE TROPICS ...
THEORETICAL WAVE STUDIES OF THE TROPICAL TROPOSPHERE ...
RESULTS OF THE PRESENT STUDY
4.1 EDDY FLUXES ... . .. ... 4.2 SYNOPTIC ANALYSIS ... 4.3 SOURCES OF KINETIC ENERGY FOR THE
DISTURBANCES ...
SUIMARY AND CONCLUSIONS ...
BIBLIOGRAPHY ... CHAPTER 1 CHAPTER 2 CHAPTER 3 CHAPTER 4 CHAPTER 5
Chapter 1. Introduction
While wavelike disturbances have been recognized in the
trop-ical troposphere since World War II it is only recently that renewed
interest has set in motion an effort toward their systematic
classifi-cation. Several theoretical and numerical studies have also been
undertaken to attempt an adaquate dynamical explanation of these
disturbances in a region where observations are rather scarce.
In response to the data paucity problem several techniques
have emerged which have proved fruitful in both analyzing available
data and providing additional coverage. One technique has been the
use of spectral and cross-spectral analysis of time series to
ascer-tain the periodicities exhibited by the motions. Phase shifts of the
spectra with height and coherence between adjacent levels have also
been used to arrive at the vertical dependence of the motions and
phase velocities of the wave motions have been deduced from the
resulting horizontal wavelengths and time scales. It must be noted
that spectral techniques may only provide meaningful results if the
time series analyzed provide sufficient time resolution.
Understand-ably this point is critical when such techniques are employed for the
detection of short period oscillations. The application of spectral
filters, a necessary procedure to remove longer period contributions
to the spectra, must be considered carefully for the consequences of
indiscriminate use often result in spectral peaks of a ghostly origin.
Another recent development has been the use of satellite cloud
photographs to deduce the velocity field of the atmosphere from cloud
element displacements in order to improve the spacial coverage in
the data poor tropics. Several difficulties still exist, such as
justifi-cation that the cloud elements translate with the basic flow and
deter-mination of the level at which the cloud movement is observed,
how-ever, solution of these problems will undoubtably provide a powerful
tool for future investigations.
There are several periods for which fairly detailed
observa-tions exist for the tropical troposphere in the Western Pacific, and
it is with one of these periods that the relationship between
mid-lati-tudes and the tropics is examined with respect to their synoptic
features.
In addition to observational studies several theoretical
analy-ses and numerical experiments have also been performed in an
at-tempt to understand and model the dynamics of tropical motions.
The results of such studies are useful in attempting to evaluate the
driving force for the observed tropical motions, which has not as yet
been established beyond doubt.
CHAPTER 2
OBSERVATIONAL EVIDENCE OF WAVE DISTURBANCES IN THE TROPICS
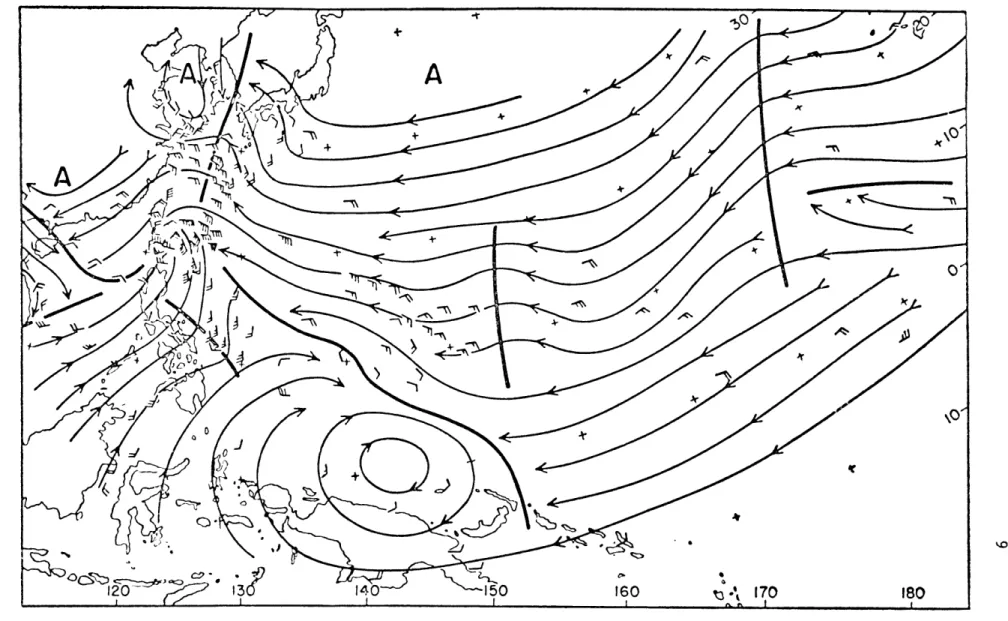
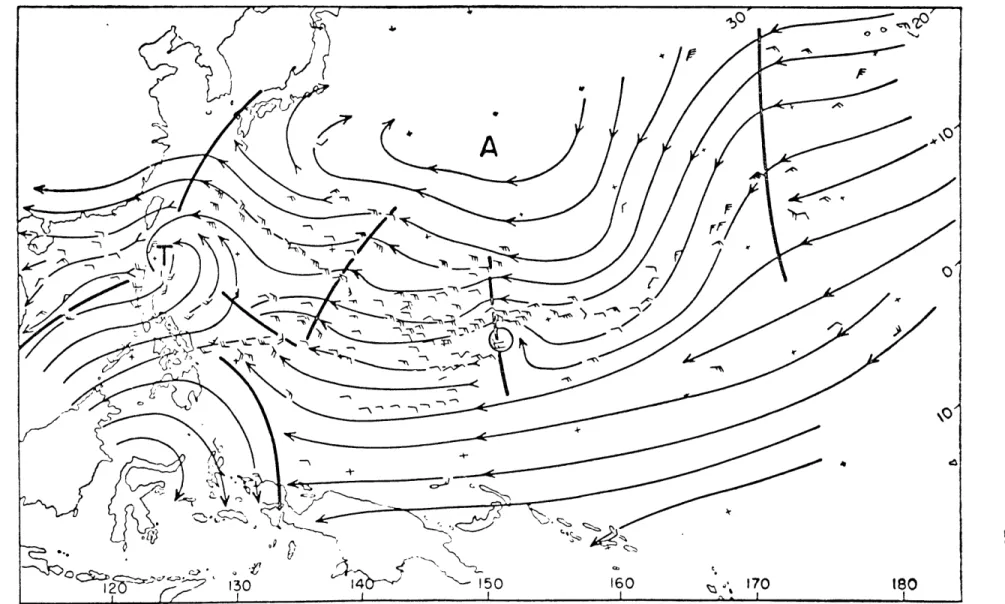
In several studies shortly after the close of World War II Riehl (1945, 1948, 1954) described two sets of systems present in the tro-pical troposphere using data covering the Marshall, Admiralty,
Marianas, Philippine, and Hawaiian Islands. In the lower troposphere shear lines were found at 1,000 and 10,000 feet (Figures 1 & 2). They propagated westward at about the speed of the easterlies, had a hori-zontal wavelength of approximately 2000 km, and a period of about 3 to 4 days. Yanai (1963) also observed these disturbances and found them to be cold cored and to exhibit an eastward tilt of its axis with height. This type of wave is called the 'easterly wave'. A more
re-cent study by Wallace and Chang (1969) using cross spectrum analysis indicated waves of four to five days in period, horizontal waxelengths of about 3000 km, and no tilt with height.
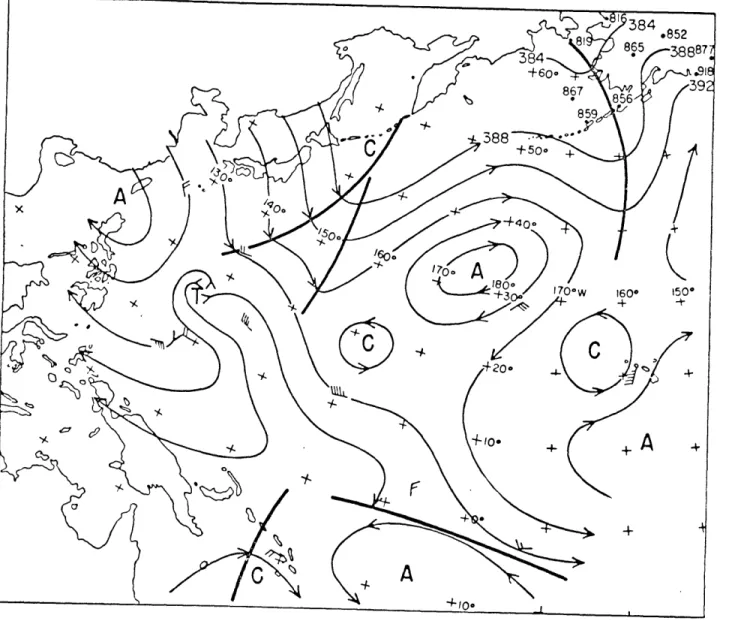
Upper tropospheric disturbances were also identified by Riehl (1948, 1954) at the 200 mb level over the western Pacific (Figures 3 & 4). These waves exhibit periods on the order of a week, propagate westwards with a velocity approximating that of the lower easterlies,
and have a horizontal wavelength of approximately 500 km.
Yanai et al. (1968) computed spectra for a number of equatorial stations in the western Pacific and found a large spectral density in the v component of wind of 4 to 5 days at upper tropospheric levels, the spectral maximum occurring at 17 km, near the tropopause level.
170
01+ 0
A
- + + + +20 +-27-10 - + + + + 0+ 40 + + + + + +Computations of coherence and phase difference have suggested wave-lengths of about 6000 km and phase velocities of approximately 23 m/sec westward, and -these waves, transport wave energy upward. The wavelengths estimated from this study appear to be somewhat larger than those estimated by Riehl (1948). It has been suggested that the variations in wave size may be a function of season or longitude; these hypotheses have not been supported by conclusive studies.
It is found that the two tropospheric systems appear to move in-dependently of each other. The two systems are superposed in typhoons and it has been suggested by Yanai (1964) that the upper tropospheric waves play a critical role in their development. In the examination
of seventeen easterly wave cases Yanai found the upper level distur-bance appeared to be a necessary but not sufficient condition for fur-ther development.
At the writing of this paper three distinct varieties of wave motion have been identified, two of which are present in the
tropo-sphere (upper and lower) and another which is confined to the lower stratosphere (as discussed in Chapter
3
). Previous studies have hinted at these regions' interaction but their relationship is far from clear.Should upper tropospheric and lower stratospheric disturbances be dynamically related so that the tropospheric motions essentially pro-vide the driving force for the region above, the question still re-mains: What initiates and maintains the upper tropospheric distur-bances?
CHAPTER 3 THEORETICAL STUDIES
Several theoretical studies are pertinent to the explanation of observed wave modes in the tropical region.
A study by Charney and Drazin (1961), using a quasigeostrophic approximation, discussed the conditions under which existing distur-bances could propagate vertically. It was found that vertical
propa-gation could occur only when the phase velocity of the disturbance was easterly relative to the mean flow (but slower than some critical velocity). The critical velocity grew smaller rapidly for increasing horizontal wave number so that forcing occurred only from long waves.
Charney (1963), using a scale analysis technique, showed that the large scale tropical atmosphere should be non-divergent to a greater extent than the extra-tropical atmosphere in the absence of
condensation. This would seem to be supported by the observational studies of the upper and lower tropical troposphere. Holton (1969), however, has pointed out that this need not be the case for small scales of motion; here coupling in the vertical could be strong.
Rosenthal (1965) also considered the problem of wave motions in the tropics, but chose only to examine the symmetric part of the so-lution.
A more detailed analysis was carried out by Matsuno (1966) and Lindzen (1967) and has been summarized by Wallace (1969). These dis-cussions describe quasi-horizontal wave motions in a barotropic,
incompressible fluid with a free surface and yield several types of propagating waves having their greatest amplitudes near the equator. With these theoretical methods parameters usually difficult to measure directly, such as vertical velocity, can be deduced.
Lindzen (1967) showed that the free modes excited were barotropic and consisted of eastward and westward propagating inertia gravity
waves and a westward propagating Rossby wave. Of the forced modes iden-tified in the studies only the n = 0 and n = -l modes have been identi-fied observationally, the former by Yanai et al. (1968) and the latter by Wallace (1968). The n = 0 mode is a mixed Rossby-gravity wave in which the phase propagates downward and westward and the meridional component of velocity has its maximum at the equator. The velocity fields are symmetric about the equator and the horizontal structure of both the forced and free modes is identical. This mode carries wester-ly momentum upwards and heat poleward.
The n = -1 corresponds to a Kelvin wave (no v dependence) propa-gating eastward and also carrying westerly momentum aloft. Since in this wave pressure and vertical velocity are correlated the energy flux is also in the upward direction. These were identified observationally by Wallace and Kousky (1968) and may play a role in the dynamics of the lower stratospheric region since the energy and momentum fluxes of these waves are transmitted to the stratosphere.
A numerical experiment of great relevance to the study of distur-bances in the upper tropical troposphere has been performed by Mak
16
neglected convection) and used symmetric driving at 30*N and 30*S. The results indicated motions in the upper troposphere of five days in period and will be discussed at greater length in the following sections relative to the observational studies. In short the model was an attempt to evaluate the response of the tropical troposphere
CHAPTER 4.1 EDDY FLUXES
Short term eddy fluxes of momentum and heat were examined to initially evaluate the time and length scales of the observed disturbances in the upper tropical troposphere.
Time-height cross sections were prepared for zonal and meridional components of wind, temperature, and eddy fluxes of momentum and heat for Kapingamarangi (10
2'N 154046'E), Truk (7027'N 151050'E), Eniwetok (110
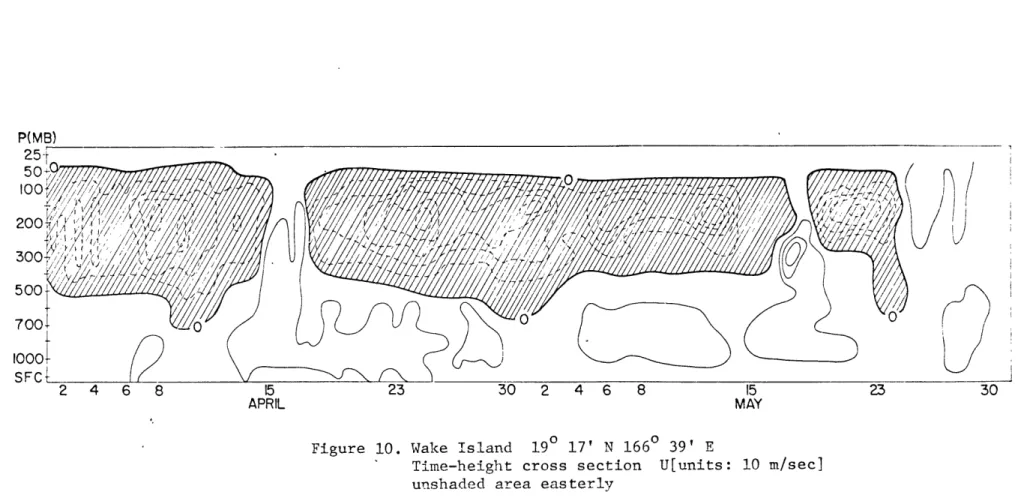
20'N 162020'E), Wake Island (19 0
17'N 166039'E), and Nauru (0034'S 166040'E) (Figures 5-12). The height, time, and space scales over which the momentum and heat transports occur, provide elemental indicators of the basic characteristics of such
transient disturbances.
Several of the most prominent features of momentum and heat transports show continuity, not only between stations lying in a north-south plane, but also over approximately twenty degrees of longitude, thus indicating an organized process operating within that region. The transports reach a maximum in the region from 150-200 mb where most of the momentum transport across the equator occurs and
o'v
is relatively large. These cross sections forKapingamarangi (uv) during the month of April 1958 show two major features centered near April 6th and April 17th. At this time the zonal wind is easterly. The disturbances are found from 100-300 mb with the maximum occuring at 200 mb. After April 20th the time height section for zonal wind indicates downward propagating
50 mb down to 400 mb. These disturbances appear to'transport momentum equatorward and their duration is from four to six
days. The peak values of the fluxes occur in the upper troposphere and reach 950 m 2/sec2 (uv).
The latitudinal dependence of these disturbances is demonstrated by the cross section for uv at Wake Island which is located at approximately 20 0N. Here the eddy fluxes indicate a greater regularity in time (~- week) and are considerably
2 2 2
larger, with uv reaching 6 x 10 m /sec (Figure 9). This is reflective of the more mid-latitude nature of this station at which waves in the westerlies amplify and extend into tropical -regions. These results are borne out by the detailed synoptic
analysis presented in the next section.
The wave periods observed at Wake do not coincide with those observed at equatorward stations, however, their presence and consequent energy transports may be of critical importance to
the development and maintainance of the equatorial eddies.
The disturbances observed on April 6th and 17th at stations in the northern hemisphere also appear to extend into the southern hemisphere. The time-height cross section of momentum at Nauru,
located at 34'S (Figure 11), shows the same major features clearly with a lag of about one day behind the northern hemisphere
stations. The unfortunate lack of radisonde data for the upper troposphere at Australian stations made it impossible to trace these disturbances further south.
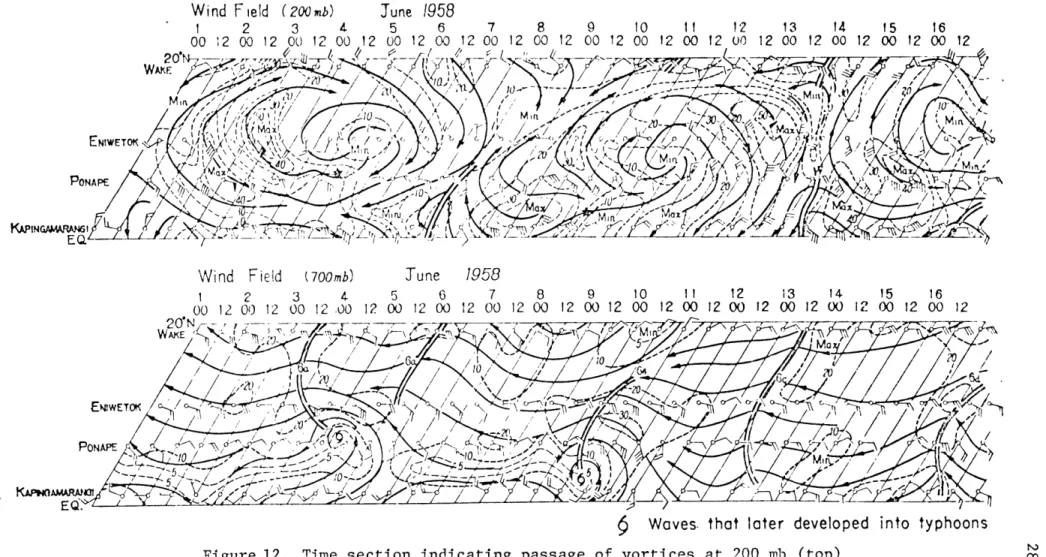
found throughout the period of study, as at Kapingamarangi and Ponape on 22 May, 3 June, 10 June, 16 June, and 17 July. In
some of these cases developing typhoons are to be found at lower tropospheric levels (Figure 12).
In order to determine whether disturbances are to be found
at other longitudes in the tropics, momentum transports were computed for Ascension Island (70 58' S 140 24' W) (Figure 13). During the period examined the basic flow in the upper troposphere is westerly while easterlies are present in the lower troposphere. The time-height cross section of uv does indeed show similar
features to those for the western Pacific. As was found using the Marshall Island data fluxes were a maximum at 200 mb and of
2 2 2
the order of 8 x 10 m /sec . As in the Marshall Island cases cross sections of temperature failed to show significant variations
during the disturbance periods.
In view of the penetration of mid-latitude waves to sub-tropical latitudes as observed at Wake Island during northern hemisphere spring , a question of great interest becomes: What
are their roles in the circulation of the subttopics? Past studies of the angular momentum balance of the atmosphere (Starr and White, 1952) have -indicated that the observed poleward transport of momentum at mid-latitudes are effected by the appropriate tilt of troughs and ridges. These troughs and ridges which extend into the subtropical upper troposphere are similarly tilted so that the correlation between northerly and easterly components of the wind indicate poleward transport also. In the subtropics
large anticyclonic circulations accomplish this transfer with the direction of transfer varying with season. Studies of the general circulation of the tropic indicate that the maximum equatorward transport of momentum occurs at 200 mb during winter where mean meridional motions and transient eddies
provide the greatest contributions. During northern hemisphere summer the direction of this transport is reversed, that is, poleward.
The synoptic analyses presented in the next section depict the amplification of mid-latitude troughs into the subtropics with the consequent effect of enhancing poleward momentum
transport.
It also remains to provide a physical characterization of the type of wave motions present at equatorial latitudes which may effect the observed transports; this will be presented in Chapter 4.2.
P(MB) 000
0
O(0I0
00 500j1 00 000
500 "/
/ SF _) 0 0 0 2 4 6 8 15 23 34 6 8 15 23 30 APRIL 1958 MAY 1958 Figure 5. Kapingamarangi 1s0 2 N 1540 46' E 2 2Time-height cross section uv[unve 50 m /Sec unshaded area negative
P(MB) 25 50 100 \ 200' 300 0 500 700 1000 SF C MAY Figure 6., Kapingamarangi 10 2' N 1540 46' E
Time-height cross section U[units: 10 m/sec] unshaded area easterly
25 50 200 300 500 '
00
00
700&01000V
UK
/ 2 4 6 8 15 23 30 2 4 6 8 15 23 30 APR IL 1958 MAY 1958 Figure 7. Truk 70 27' N 1510 50' E 2 2 Time-height cross section uv[units: 50 m /sec2 unshaded area negativeAPRIL 1958 MAY 1958
Figure 8. Eniwetok 110 20' N 1620 20' E 2 2
Time-height cross section uv[units: 50 m /sec ] unshaded area negative
P (MB)
22
8
0
2
30
APRIL 1958 MAY 1958
F 9 Tie-height coss section uvnits:
100 m2/sec2 unshaded area negative
P(MB)
APRIL MAY
Figure 10. Wake Island 190 17' N 1664 39' E
Time-height cross section U[units: 10 m/sec] unshaded area easterly
P (MB) 25V 0 010 \ o 4 0 / / 0
500
00
O000
/O 30tDATA/
NO 00 700 ' SFc 0 0 0 0_0_0 2 4 6 8 15 23 30 2 4 6 8 15 APRIL 1958 MAY 1958 Figure 11. Nauru 000 34' S 1660 40' E 2 2Titne-height cross section uv[units: 50 m /sec2
Wind Field (200 mb) 1 2 3 00 12 00 12 00 12
June
1958
7 8 9 10 11 12 13 14 15 16 12 00 12 00 12 00 12 00 12 00 12 00 12 00 12 00 12 00 12 00Wind Field
(700mb)Tune
1958
1 2 3 4
00 12 00 12 00 12 .00
5 6 7 8 9 10 11 12 13 14 15 16
12 00 12 00 12 00 12 00 12 00 12 00 12 00 12 00 12 00 12 00 1i 00 12 00 12
Waves. that later developed into typhoons
Figure 12. Time section indicating passage of vortices at 200 mb (top)and waves at 700 mb (bottom) over Marshall Islands, June 1958 (after Yanai)
15 -30
APRIL 1958
Figure 13.
15 30 15 30 15
MAY 1958 JUNE 1958 JULY 195
Ascension Island 70 58' S 140 24' W
2 2
Time-helght cross section uv[units: 100, 300, 500 m /sec ] unshaded area negative
30
8
60%
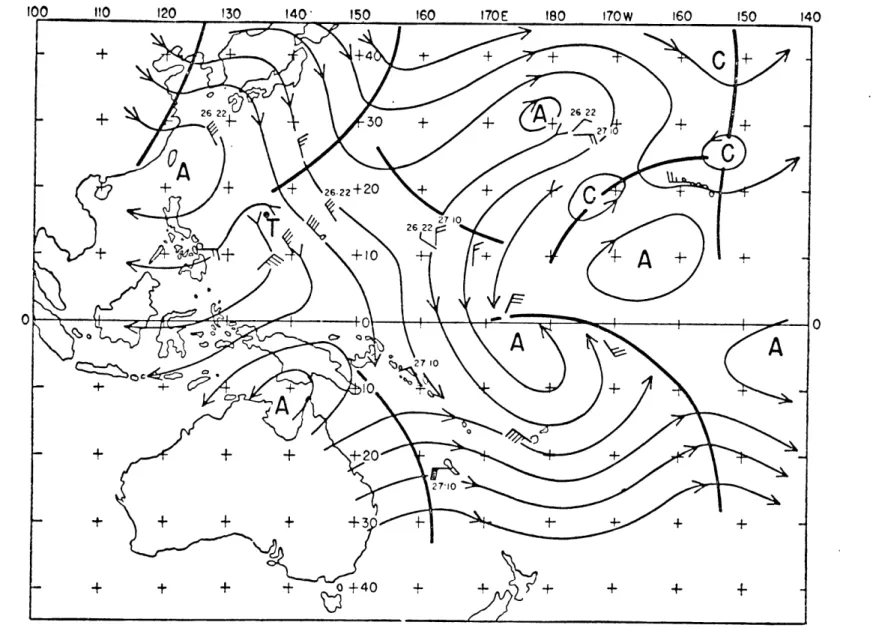
CHAPTER 4.2 SYNOPTIC ANALYSIS
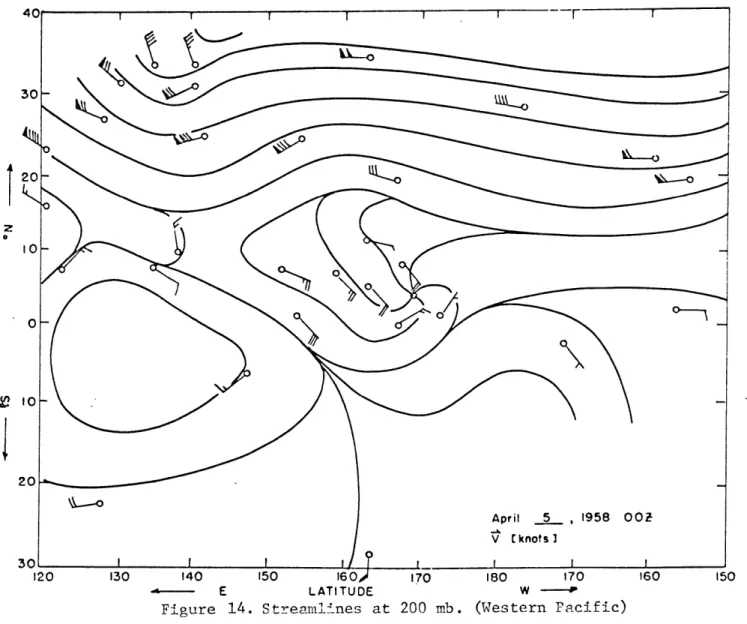
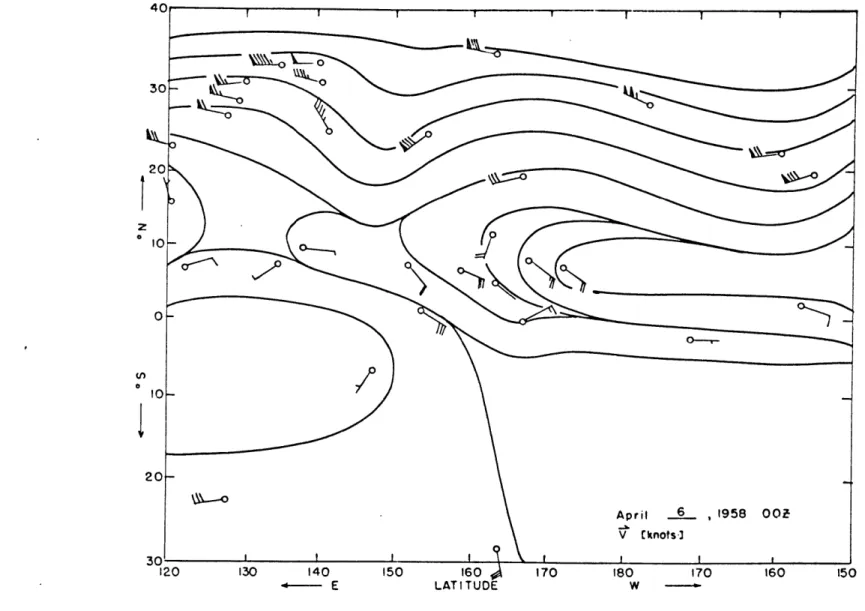
Synoptic maps for April 4th through April 22nd at 200 mb (00Z) were drawn including a portion of northern hemisphere mid-latitudes and a small part of the southern hemisphere where data was available
(Figures 14-22~). During this period the passage of several mid-latitude troughs was noted through the western Pacific which, after growing in amplitude, appear to interact with the flow at low latitudes, producing a depression of the subtropical ridge equatorward.
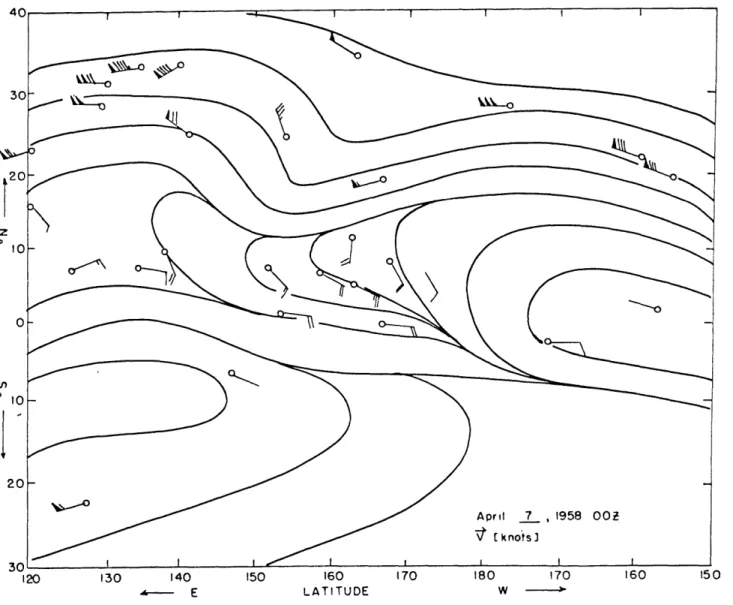
By April 6th OOZ the trough that had been located at 172*E had advanced westward to 160*W and another trough had moved to 142*E. April 6th is the day during which the eddy fluxes at 200 mb reached their maximum at Kapingamarangi, Ponape, and Nauru as shown in pre-vious figures. A graph of the average kinetic energy computed for the Marshall Islands (hereafter denoted KE) shows this pronounced peak on April 6th (Figure 25). In the next few days the trough continues its eastward motion while increasing in amplitude and developing an eastward tilt with increasing latitude. By April 10th the trough is located at approximately 175*W and Wake (~20*N) is showing strong northwesterly flow. At this time both the cross sections of eddy fluxes and KE for the Marshall Islands have reached a minimum.
Another large increase in the 200 mb eddy fluxes and KE for the Marshall Islands is noted on April 17th (Figure 25). The ridge located at 160*E on April 13th begins to retrogress and the trough mentioned
previously develops increased eastward tilt and amplitude until by April 16th the trough axis passes through 160*E at 10*N. At this point the synoptic maps show fairly strong cross equatorial flow at stations located near the equator (Nauru, Tarawa). By the following day the trough has moved rapidly to 158*W and the easterlies extend to 20*N. Correspondingly the KE has reached its peak and the cross equatorial flux is large.
A new trough begins moving eastward from 140*E on April 18th and by the 20th has reached 150*E. This trough appears to be weaker and exhibits smaller amplitude than the previous one. Throughout the re-mainder of the period the KE continues to decrease until it reaches a comparable value to April 10th on April 22nd.
In order to examine the relation of mid-latitude trough and ridge placement during disturbance periods in the upper tropical troposphere mean maps were constructed for three time periods, April 5-9th, April
10-14th, and April 15-20th, (Figures 26-28). Although there is no clearcut dependence on trough or ridge placement during the periods when maximum or minimum KE is observed at the Marshall Islands sta-tions, it is noted that the average intensity of northwesterly flow at 20*N (Wake) appears to be at a minimum during the KE minimum, and is much stronger during the second disturbance period. This may be a measure of the distance to which mid-latitude features penetrate the tropics, but it will be necessary to examine much more extensive data records to establish such relationships conclusively.
stations such as Kapingamarangi, Nauru, Tarawa, and Canton Island indicate horizontal wavelengths of the order of about 4,500km. The phase velocity is about 10 m/sec westward. Riehl's estimation of wavelength was 5,000 km while Yanai et al.'s
results suggested 6,000 km and a westward propagation rate of 23 m/sec. It would seem apparent from these results that
wave motions in these regions are subject to variations in their structure or modification during their lifetime.
Composition of a coherent description- of the disturbances in the upper tropical troposphere from synoptic and spectral
analyses suggests the presence of a variety of westward propagating waves. Wavelengths are
estimated
to be approximately 5,000km but large variations are noted (500 to 1,000 km).
Similarly, propagation velocities are also found to exhibit
large variations (-v 15 m/sec).
The daily products of u and v during the first part of the disturbance periods are large and negative (southeast winds). When viewed relative- to other stations in the Marshall Islands, these products are excellently coherent, that is, they are well correlated over more than 200 of longitude. This would seem to indicate a rather large scale process which, it will be shown, can provide a mechanism for net transports over the longitudes concerned. During this period strong easterlies dominate the equatorial region in the western Pacific and extend as far north
sign
of the products of u and v reverses (northeasterly winds) and is of much smaller magnitude, an implication that thedisturbances are performing some net transport when viewed over the whole period.
If we consider uv to be related to momentum transport over the limited longitudes involved, this product may be interpreted
as the transport originating from the combined action of the mean meridional circulation and the transient and standing eddies.
The time-height cross sections would seem to indicate that large relative momentum transports are being effected in the tropical upper troposphere during the disturbance
periods and that the direction of this transport is equatorwards. It must be noted that these transports occur over very limited longitudes, but cross sections at different longitudes also in-dicate the presence of similar disturbances, which implies the importance of these disturbances to the gross circulation of the equatorial belt. Hemispheric studies also indicate equatorward momentum transport during December-February, with the largest contributions from the standing and transient eddy terms.
These disturbances are seemingly confined to a relatively shallow atmospheric layer in the tropical upper troposphere since
cross section values for uv are maximum at 200 mb and fall sharply to small values at 100 and 300 mb.
In order to effect the net transports noted, the structure of the disturbances may be hypothesized as exhibiting a
horizontal tilt, specifically westward with increasing
latitude. This comes about through the correlation of strong easterlies with larger northward directed meridional components and weaker easterlies with southward directed meridional
components.
Since the long term studies indicate poleward transport of momentum during June-August, these waves must either play a minor role during this period or be modified in such a way as.to
produce poleward transport of momentnm. The tilt necessary would be eastward with increasing latitude and resemble waves found in the mid-latitude westerlies.
It is difficult to ascertain whether there is an organized heat flux at these latitudes since temperature variations are small and may be in--the noise level. This would seem to suggest
the presence of baratropic waves.
-d- E
160'.
LATITUDE
Figure 14. Streamlines at 200 mb. (Western Pacific)
150
-z * 10
140 150 160 IA 170 180 170
E LATITUDE w
120 130 140 150 160 170 180 170 160 150
A E LATITUDE W
30 - I
120 130 140 150
d.- E
160 170 180 170 160 150
LATITUDE W
E LATITUDE w
V C knotsJ
30
-120 130 140 150 160 170 180 170 160 150
. -E LATITUDE W
V L knofs I
140 150 160 170 180 170 160 ido
E LATITUDE W
0 0 20-April 17 , 1958 00* 301 1V Eknots2 120 130 140 150 160 170 180 170 160 150 E LATITUDE w
10 0-0 20 -April _18_ , 1958 002 V C knots- I 120 130 140 150 160 170 180 170 160 60 E LATITUDE w
4- E LATITUDE160 w :.
Figure 23, Streamlines at 200 mb. (Western Pacific)
f
z0 0 0 20 -April 20 1958 00Z ( knots , 30 --- I 120 130 140 150 160 170 180 170 160 150 +- E LATITUDE wENERGY ( MARSHALL
( MEAN LONGITUDE - 162* E )
4 5 6 7 8 9 to II 12 13 14 15 16 17 18 19 20 21 22
APRIL 1958 002
Figure 25. Time section of average kinetic energy. 140 120 100 80 60 40 20 0 ISL ANDS) AVERAGE K IN E T I C
E LATITUDE W
160
LATITUDE
-.
0 E W
10 0 10-20- April 15-20,1958 OOZ-V (knots) 301 120 130 140 150 160 170 180 170 160 150 E LATITUDE w
CHAPTER 4.3
ENERGY SOURCES FOR THE WAVES
Like the wave motions of the lower troposphere the driving force for upper tropospheric disturbances has not been fully understood. Several theories have been offered, and are also applicable to disturbances identified in the lower troposphere.
Although barotropic instability has been thought as unimportant in the lower troposphere (Wallace and Chang, 1969) it is not clear that this is the case in the upper troposphere where the correlation between u and v is observed to be fairly high.
A type of baroclinic instability used by Charney and Eliassen (1964) to explain hurricane formation and development suggests that the release of latent heat at lower tropospheric levels and the
subsequent redistribution of heat in the vertical could provide the kinetic energy for the upper tropospheric disturbances. For these
effects to be felt at upper levels deep convective motions would be necessary. Hurricane models are characterized by a lower inflow layer around an intensifying easterly wave (cold-cored) in which deep convective motions develop and are topped by an anticyclonic outflow layer (warm-cored). Although such structures have been
observed, upper tropospheric disturbances have also been detected in the absence of lower tropospheric waves. In such cases the
upper level disturbances have not been found to be warm-cored, indeed no significant temperature fluctuations have been observed. Although convective motions cannot be discarded as a possible driving
related to several mechanisms, each operating exclusive of each other. Another variety of driving has been demonstrated by Mak (1969) in which middle latitude disturbances were parameterized in a time and spacial sense and, through the use of a numerical model, were shown to excite tropical disturbances. Although the model was highly simpli-fied, (two layer, neglected convection, and assumed symmetric driving at 30*N and 30*S based upon observations only available in the north-ern hemisphere) the results are somewhat supported by some observations. Motions of periods approximately 5 days in period and wavelengths of 10,000 km propagating westward were produced in the tropical upper tro-posphere. The energy flow in this model indicated that the tropical eddies gain their kinetic energy through midlatitude driving (pressure work on the boundaries) and lose kinetic energy through conversions to zonal kinetic energy and zonal available potential energy. For this process sensible heat and wave energy is transported equatorward and
zonal momentum poleward.
A discussion of the kinetic energy balance for horizontal motions derived from simplified hydrodynamic equations will prove useful in demonstrating some mechanisms thought important in tropical motions. The following expression is given by Starr (1948).
'A
E
EV,
8
S
f
BdydL
A
where E = 1/2 fV2 (the horizontal kinetic energy per unit volume), Vn is the normal velocity at the boundary, d is the effect of fric-tion, dS is an area element, and u and v are the usual cartesian components of wind.
The equation expresses the rate change of kinetic energy within a volume as due to four terms, A the horizontal advection of kinetic energy into or out of the volume, B the performance of work by pres-sure forces at the boundary of the volume, C the production of kinetic energy within the volume, and D its dissipation.
The term considered by Mak (1969) to be of critical importance is the pressure work boundary term B. Physically, a region like the tropics may increase its kinetic energy by having an outside source
(the mid-latitudes) perform work upon the tropical boundary. Neglec-ting the advection term may not be valid for upper tropospheric mo-tions because of their increased magnitude. Likewise, consideration of the source term may also be not justified since inflow at lower tropospheric levels followed by deep convection and subsequent diver-gence at upper tropospheric levels has been shown to be important in hurricane development.
An essential question seems to be: Can and when does each of the terms in the equation play an important role in the tropical upper troposphere?
Since few observational studies of the short period transient disturbances in the tropical upper troposphere have been made their seasonal variation is not well known. Their presence has, however,
been established during northern hemisphere spring and summer. An estimate of the seasonal variation of the pressure work term for standing waves at 20*N has been made by Newell et al. (1970). The result that this term is largest during January and reaches a minimum near spring is somewhat contradictory to the proposition that
mid-lati-tude driving plays an important role during this period.
Several alternatives present themsalves. One, contributions from the transient eddies is much larger than the standing eddies, or two, mid-latitude driving from the southern hemisphere may reach its maxi-mum during northern hemisphere spring and summer and provide a source
of energy for the tropical disturbances.
Examination of the conversion of zonal to eddy kinetic energy for transient and standing eddies from the previously mentioned study (June through August) indicates that the eddies feed on the zonal flow
(KZ-+KE) in the equatorial upper troposphere (in contrast to Mak's KE-V KZ), that is, the kinetic energy of the tropical disturbances may be maintained by instabilities in the zonal flow. We are then left with
difficulty of providing an explanation of the initiation of the insta-bility, in spite of the possibility that the zonal flow may be capable of maintaining the ensuing disturbances. One possible conclusion, is that the relationships between mid-latitudes and the tropics is of a more subtle nature than the simple symmetric mid-latitude forcing suggested by Mak (1969).
It may be that acLivation of the instability in the tropical region is brought about by mid-latitude driving and that the zonal
flow only provides energy for the maintenance of the disturbance. Newell et al. (1970) have pointed out that the energy involved in the
2 -2 -1
transformation (KZ4KE) is approximately 10 ergs cm sec if the ab-sorption is considered to occur over a 15 degree latitude strip.
In light of the seasonal nature of the mid-latitude pressure work term and the presence of equatorial upper tropospheric disturbances during the pv minimum, the author feels that a more detailed numerical experiment might prove enlightening if, instead of assuming symmetric forcing from mid-latitudes as in Mak's (1969) model, forcing is para-meterized as asymmetric at 30*N and 30*S so that when pV reaches a minimum at northern mid-latitudes the pressure work term at the bound-ary in the southern hemisphere reaches its maximum. The reason for Mak's assumption of symmetry for the forcing would seem to be based on
the unavailability of sufficient southern hemispheric data. This assump-tion does not seem adequate in light of the seasonal variaassump-tion of pV in the northern hemisphere. The new hypothesis to test would seem to be: can disturbances be initiated in the tropical upper troposphere by either northern or southern hemispheric forcing?
This discussion has neglected the effects of condensation. If the upper tropical troposphere is viewed as a forced region by con-vergence and deep convection (i.e. coupling between levels), the source
term in the kinetic energy equation would contribute to the increase in kinetic energy of the upper region by divergence aloft. Hurricanes and typhoons have been characterized as having such a structure, how-ever, the presence of the upper level disturbances in the absence of
convective motions can only imply that such a mechanism is important in the upper troposphere intermittently.
The term representing the horizontal advection of kinetic energy may also be a contributor to the kinetic energy of upper tropospheric motions. In the tropical lower troposphere wind velocities are rela-tively small (in the absence of hurricanes) and this term would seem-ingly be correspondseem-ingly small. This is not the case for upper tropo-spheric motions (200 mb) where wind velocities at 20*N typically reach 25-35 m/sec during the passage of mid-latitude troughs penetrating the sub-tropics. The essential difficulty with this reasoning is that sys-tematic advections would have to produce larger equatorward than pole-ward fluxes. Examination of synoptic maps during upper tropospheric
disturbances periods does not indicate that such a process is involved during northern hemisphere spring and summer.
q
CHAPTER 5
SUMMARY AND CONCLUSIONS
The disturbances observed in the upper tropical troposphere
appear to have wavelengths of approximately 5, 000 km, a time
scale of the order of a week, are confined to the region from 300
to 100 mb, and propagate westward at anywhere from 10 to 25
m/sec.
The correlations of u and v would seem to imply that these
disturbances are tilted horizontally so as to produce the net
mo-mentum transports suggested by the time-height cross sections,
that is, westward tilt with increasing latitude.
In addition to further describing upper tropospheric waves at
200 mb at equatorial latitudes, an attempt was made to evaluate
the relation of mid-latitude troughs and ridges to these disturbances.
Although more extensive work seems necessary, it is clear that
mid-latitude driving by baroclinic processes can only be partially
correct, that is, that waves in the westerlies may initiate the
dis-turbances in the upper tropical troposphere, but not provide the
energy necessary for continued maintainance.
This is based upon
the variation of the driving force pv with season, which reaches
a maximum in January and is smallest during April. This
varia-tion, coupled with observational studies made during the latter
period, would seem to imply that either mid-latitude driving from
the southern hemisphere serves as the initiator or the boundary
pressure work term is unimportant during northern hemisphere
spring and summer. To evaluate southern hemisphere driving,
additional observations will be necessary.
The synoptic analyses unfortunately did not show any
consis-tent relationship between mid-latitude trough and ridge position
during the active periods in the tropical upper troposphere. A
greater number of cases should be examined in order to
substan-tiate this relationship, especially during January when northern
hemispheric pv is maximum.
Present evidence suggests that mid-latitude driving may act
as the initiator of transient disturbances in the equatorial upper
troposphere, but the maintainance of their energy is more
pro-bably related to instabilities in the zonal flow, as the K
--+
K
z
e
BIBLIOGRAPHY
Bates, J. R. , 1969: Dynamics of disturbances on the
Intertro-pical convergence zone.
Ph. D. thesis, Dept. of
Meteo-rology, M.I. T.
Charney, J. G., and Drazin, P. G., 1961: Propagation of
Planetary-scale disturbances from the lower into the upper atmosphere.
Journal Geophys. Res. , 66, pp. 83-109.
, 1963: A note on the large scale motions in the tropics.
J.A.S., Vol. 20, No. 6.,
pp. 607-609
, and Eliassen, A., 1964: On the growth of the
hurri-cane depression, J. A.S., Vol. 21, No. 1., pp. 68-75
Fujita, T., Watanabe, K., and Izawa, T., 1969: Formation
of equatorial cyclones caused by large scale cross
equa-torial flows determined by ATS-I photographs.
Satellite
and Mesometeorology proj., Univ. of Chicago.
Kidson, J. W.,
1968: The general circulation of the tropics.
Ph. D. thesis, Dept. of Meteorology, M. I. T.
, and Newell, R. E., 1969: Exchange of atmospheric
angular momentum between the hemispheres.
Nature,
Vol. 221, No. 5178., pp. 352-353
, Vincent, D.G., and Newell, R. E., 1969:
Observa-tional studies of the general circulation of the tropics: long
term mean values.
QJRMS, Vol. 95, No. 404., pp. 258-287
Kuo, H. L., 1965: On formation and intensification of tropical
cyclones through latent heat release by cumulus
convec-tion. J.A.S., Vol. 22, No. 1., pp. 40-63Koteswaram, P. and George, C. A., 1957: The formation and
structure of tropical cyclones in the Indian Sea areas, 75th
Anniv. Vol.,
Jour. Met. Soc. of Japan, pp. 309-322.
Mak, Man-Kin, 1969: Laterally driven stochastic motions in
the tropics, J.A.S., Vol. 26, No. 1., pp. 41-64
Mancuso, R. L. , and Endlich, R. M. , 1968: Objective and
dy-namic analyses of tropical weather, Rep. No. 1, Res. and
Dev. Tech. Rep. ECOM-0192-1, Stanford Res. Inst. , Cal.
Maruyama, T., 1967: Large scale disturbances in the
equator-ial lower stratosphere, J. Met. Soc. of Jap., 45, pp.
391-408.
, and Yanai, M., 1967: Evidence of large scale wave
disturbances in the equatorial lower stratosphere. J. Met.
Soc. of Jap., 45, pp. 196-199.
, 1968: Vertical transport of momentum due to large
scale disturbances in the equatorial lower stratosphere. J.
Met. Soc. of Jap., 46, No. 5, pp. 404-417.
McRae, J. N., 1956: The formation and development of tropical
cyclones during the 1955-1956 season in Australia. Proc.
Trop. Cyclone Symposium, Brisbane, pp. 233-261.
Matsuno, T. , 1966: Quasi-geostrophic motions in the
equato-rial area. J. Met. Soc. of Jap. , 44, pp. 25-43.
Newell, R.E., Vicent, D.G., Dopplick, T., Ferruzza, D.,
and Kidson, J.W., 1970: The energy balance of the
glo-bal atmosphere, to be published in QJRMS.
Palmer, C. E., 1951: Tropical Meteorology. Compendium of
Meteorology- Boston. American Meteorological Society.
pp. 859-880.
Riehl, H., 1945: Waves in the easterlies and the polar front
in the tropics.
Dept. of Met., Univ. of Chicago, Misc.
Rep., 79
pp.
, 1948: On the formation of typhoons, J. Met. , 5, pp.
247-264.
, 1954: Tropical Meteorology. McGraw Hill, N.Y. 392 pp. , and Higgs, 1960: Unrest in the upper stratosphere over
the Carribbean Sea during January 1960. J. Met. 17, pp,
555-561.
Rosenthal, S. L., 1965: Some preliminary theoretical
consider-ations of the wave motions in equatorial latitudes. M. W. R.,
Vol. 93, pp. 605-612.
Wallace, J. M., and Kousky, V. E., 1968: Observational evidence
of Kelvin waves in the tropical stratosphere.
J. A. S., 25,
pp. 900-907.
large-scale wave disturbances in the tropical lower troposphere.
J.A.S., Vol. 26, No.5., pp. 1010-1025
Yanai, M., and Maruyama, T., 1966: Stratospheric wave
dis-turbances propagating over the equatorial pacific. J. Met.
Soc. of Jap., 44, pp. 291-294.
, Maruyama, T., Nitta, T., and Hayashi, Y., 1968:
Power spectra of large scale disturbances over the tropical
pacific. J. Met. Soc. of Jap. , 46, pp. 801-816.
, 1964: Formation of tropical cyclones. Rev. of