HAL Id: hal-00330885
https://hal.archives-ouvertes.fr/hal-00330885
Submitted on 1 Jan 2002
HAL is a multi-disciplinary open access
archive for the deposit and dissemination of
sci-entific research documents, whether they are
pub-lished or not. The documents may come from
teaching and research institutions in France or
abroad, or from public or private research centers.
L’archive ouverte pluridisciplinaire HAL, est
destinée au dépôt et à la diffusion de documents
scientifiques de niveau recherche, publiés ou non,
émanant des établissements d’enseignement et de
recherche français ou étrangers, des laboratoires
publics ou privés.
An experimental study of particle-driven gravity
currents on steep slopes with entrainment of particles
Marie Rastello, Christophe Ancey, Frédéric Ousset, R. Magnard, Emil J.
Hopfinger
To cite this version:
Marie Rastello, Christophe Ancey, Frédéric Ousset, R. Magnard, Emil J. Hopfinger. An experimental
study of particle-driven gravity currents on steep slopes with entrainment of particles. Natural Hazards
and Earth System Science, Copernicus Publications on behalf of the European Geosciences Union,
2002, 2 (3/4), pp.181-185. �hal-00330885�
c
European Geosciences Union 2002
and Earth
System Sciences
An experimental study of particle-driven gravity currents on steep
slopes with entrainment of particles
M. Rastello1, C. Ancey1, F. Ousset1, R. Magnard1, and E. J. Hopfinger2
1Cemagref, u.r. etna, 2 rue de la papeterie, BP 76, F-38402 Saint Martin d’H`eres, France 2Legi, 1025 rue de la Piscine, BP 53, F-38041 Grenoble Cedex, France
Received: 20 September 2001 – Revised: 24 January 2002 – Accepted: 29 January 2002
Abstract. Results of laboratory experiments are presented in
which a finite suspension of sawdust particles was released instantaneously into a rectangular channel immersed in a wa-ter tank. Two kinds of gravity currents were studied: currents with or without entrainment of particles from the bed. Ex-periments were repeated for two slopes: 30◦and 45◦. We observed that the velocity of the front was significantly in-creased as particle entrainment occurred. In addition, our ex-periments showed that the front kept a quasi-constant veloc-ity for both runs. This might suggest that the flow regime cor-responded to the “slumping regime” or “adjustment phase” described earlier by Huppert and Simpson (1980).
1 Introduction
This paper presents an experimental investigation into particle-driven gravity currents on steep slopes. Specific at-tention was paid to the effect of particle entrainment from the bed on the front velocity. Many papers have been devoted to the study of gravity currents. In addition to review papers (Benjamin, 1968; Hopfinger, 1983; Simpson, 1987), typical references include Huppert and Simpson (1980) and Rottman and Simpson (1983) for currents flowing down gentle slopes, Gladstone and Woods (2000) and Parker et al. (1987) for par-ticle driven gravity currents on gentle slopes, Hopfinger and Tochon-Danguy (1977), Beghin et al. (1981) and Beghin and Olagne (1991) for density currents on steep slopes and So-villa et al. (2001) for the entrainment of snow by dense snow avalanches. Here we report preliminary results concerning particle-driven gravity currents on steep slopes, a subject that has been evasively addressed in recent years. Our investiga-tion has been motivated by the poor knowledge of the physi-cal processes governing the particle entrainment from the bed into the gravity current. Even the effects of such entrainment are poorly known, though such a subject is of great interest
Correspondence to: M. Rastello
for submarine turbidity currents down an inclined sea floor or powder-snow avalanches (airborne avalanches).
First we will present our experimental device. Then we will look at the difference in behavior of the gravity current depending on whether it flows on a mobile bed (made up of sawdust) or a fixed rough bed. Finally, we will compare our results with previous results provided by other authors in order to better characterize the flow regime.
2 Experiments
2.1 Experimental device
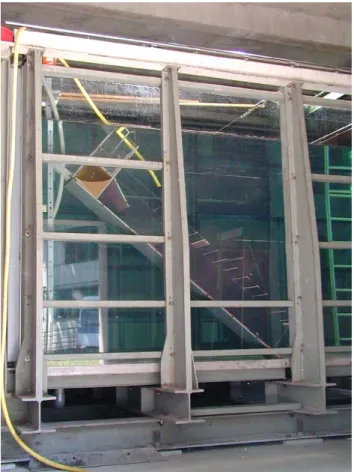
The experiments were performed in a channel immersed in a water tank of 20 m3 (see Fig. 1). The channel, made up of Plexiglas, was 2 m long, 30 cm wide, and 40 cm high. The channel inclination ranged from approximately 0◦to 50◦ with respect to the horizontal.
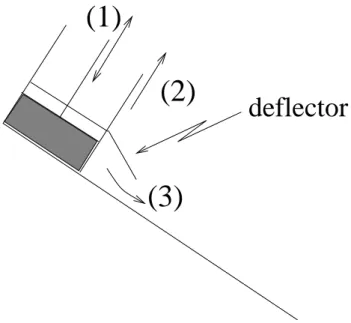
The channel bottom was roughened by gluing sawdust particles. The particles were identical to those used in the flowing suspensions (see below). A reservoir, a rectangu-lar chamber measuring 0.2 m×0.2 m×0.3 m, was located at the upstream entrance of the channel. The chamber exit was equipped with a sliding gate and a deflector as depicted in Fig. 3. We used the gate to release the suspension contained in the chamber. The role of the deflector was to give a down-ward direction to the flowing suspension.
2.2 Material
The suspensions were made up of spruce sawdust particles, which looked like pins. Their typical size was 0.5 mm. The distribution in size and the ratio of the particle length to width were determined using a microscope. Figure 2 shows the width and length of 300 particles; the size characteristics were scattered around the typical value. The particles exhib-ited weak electrostatic properties but no colloidal properties. To determine the density of the wetted sawdust, we first prepared a suspension of particles in water (Mp+w). Second,
182 M. Rastello et al.: An experimental study of particle-driven gravity currents
Fig. 1. Side view of the experimental setup.
after weighing it, we computed the mass of an equivalent vol-ume of water (Mw). The third step involved measuring the
mass of water resulting from filtration of the sawdust suspen-sion (Mwf). The density ρp of the wetted sawdust was then
computed as: ρp=ρw
Mp+w−Mwf
Mw−Mwf
(1) where ρw denotes the water density. We repeated the
pro-cedure ten times and found that the average density was ρp ≈ 1060 kg/m3 with a standard deviation of 9 kg/m3.
Making allowance for the different operations in measur-ing the particle density, we estimated the uncertainty of this quantity at ±20 kg/m3. The settling velocity was determined by measuring the duration of fall of particles in a large vol-ume of still water. The average value of the settling velocity was : Vs ≈5 × 10⁻³m/s. For each run, the suspension was
prepared by adding a given mass Mpof sawdust to the
reser-voir of volume Vt =0.2 × 0.2 × 0.3 m3. The bulk density ρt
was then computed as: ρt =(1 − ρw ρp )Mp Vt +ρw (2)
The typical mean value was ρt ≈ 1003 kg/m3. In the
fol-lowing we will consider that the initial density of the tur-bidity current is equal to this value. The uncertainty on ρt
length (mm) width (mm) 0.1 0.01 1 10 0.1 1 × × × × × × × × × × × × × × × × × × × × × × × × × × × ×× × × × × × × × × × × × × × × × × × × × × × × × × × × × × × × × × × × × × × × × × × × × × × × × × × × × × × × × × × × × × × × × × × × × × × × × × × × × × × × × × × × × × × × × × × × × × × × × × × × × × × × × × × × × × × × × × × × × × × × × × × × × × × × × × × × × × × × × × × × × × × × × × × × × × × × × × × × × × × × × × × × × × × × × × × × × × × × × × × × × × × × × × × × × × × × × × × × × × × × × × × × × × × × × × × × × × × × × × ×× × × × × × × × × × × × × × × × × × × × × × × × × × × × × × × × × × × × × × × × × × × × × × × × × ×× × × × × × × × × × × × × × × × × × × × × × × × × × × × × × × × × × × × × × × × × × × × × × × × × ×× × × × × × × × × × × × × × × × × × × × × × × × × × × × × × × × × × × × × × × × × × × × × × × × × × × × × × × × × × × × × × × × × × × × × × × × × × × × × × × × × × × × × × × × × × × × × × × × × × × × × × × × × × × × × × × × × × × × × × × × × × × × × × × × × × × × × × × × × × × × × × × × × × × × × × × × × × × × × × × × × × × × × × × × × × × × × × × × × × × × × × × × × × × × × × × × × × × × × × × × × × × × × × × × × × × × × × × × × ×× × × × × × × × × × × × × ×× × × × × × × × × × × × × × × × × × × × × × × × × × × × × × × × × × × ×× × × × × × × × × × × × × × × × × × × × × ×
Fig. 2. Distribution in size of 300 sawdust particles.
was estimated at ±1.5 kg/m3. The bulk density ρt depended
on the temperature when we performed the measurements. In practice, as the key parameter of the turbidity current is g0 = g(ρt−ρw)
ρw , and not ρt, variations in g
0 induced by the
temperature could be neglected. 2.3 Experimental procedure
The experiment consisted of measuring the position of the leading edge of a turbidity current as a function of time. We considered two channel slopes: 30◦and 45◦. For each slope,
we examined two different boundary conditions. The first configuration, hereafter referred to as “flow without (parti-cle) entrainment”, corresponded to the case where the tur-bidity current was released over a roughened stationary bed. The second configuration corresponded to the case where the channel base was covered with a thin layer of sawdust. In this case, entrainment of particles from the bed occurred and thus we called this configuration “flow with entrainment”. In the latter case, we used pink-colored sawdust particles as bed particles. This enabled us to distinguish bed particles and grains of the released suspension within the current. The bed thickness was roughly constant and its value was on average 2 × 10⁻³m for each flow with entrainment. We proceeded as
follows:
– After filling the reservoir with a given mass of sawdust,
we mixed the suspension vigorously using an oscillating Plexiglas grid until we obtained a homogeneous suspen-sion ((1) in Fig. 3).
– We opened the gate of the chamber ((2) in Fig. 3). The
suspension began to accelerate. The flow initiation was controlled by the deflector.
– After releasing the turbidity current, we measured the
variation of the front position with time. To that end, we filmed the front motion from above using a simple video recorder. We had some markers located every ten centimeters. Using the film, we determined the times
(2)
(3)
(1)
deflector
Fig. 3. Sketch of the experimental procedure.
of passage of the front towards each marker. These propagation times were measured with an uncertainty of ±8 × 10⁻²s.
2.4 Results
2.4.1 Effect of particle entrainment
For both angles we performed experiments with or without a mobile bed of particles along the channel base. In the case where the current flowed over a mobile bed, we observed systematically that the front was increasingly colored in pink as it descended, demonstrating that particles were entrained, at least in the front, from the ground and lifted up into the current.
To estimate the effect of particle entrainment, we plotted the position of the front as a function of time in Figs. 4 and 5, respectively, for a slope of 30◦and 45◦. For an inclination of 30◦the flow with entrainment was slightly more rapid than the flow without entrainment. Worthy of note, for a slope of 45◦, this difference was more pronounced. The flow with entrainment was much more rapid than the flow without en-trainment. A possible explanation for this difference is that for the steepest slopes, the channel inclination was barely lower than the internal friction angle of the sawdust. Thus, when the turbidity current flowed over a mobile bed, it ex-erted a shear stress on the bed, which could be sufficient to cause failure within the particle bed along the channel base. The bed then began to flow as a dense layer of particles, which were more easily entrained by the turbidity current. 2.4.2 Comparison between slopes
Using the least-square method, we fitted power-law func-tions to the experimental data to quantify the dependence of
time (s) front position (m) + + + + + + + + + + + + + × × × × × × × × × × × × × ⊕ ⊕ ⊕ ⊕ ⊕ ⊕ ⊕ ⊕ ⊕ ⊕ ⊕ ⊕ ⊕ ♦ ♦ ♦ ♦ ♦ ♦ ♦ ♦ ♦ ♦ ♦ ♦ ♦ ◊ ◊ ◊ ◊ ◊ ◊ ◊ ◊ ◊ ◊ ◊ ◊ ◊ 0 2 4 6 8 10 12 14 0.4 0.8 0.6 1.0 1.2 1.4 1.6 1.8
Fig. 4. Position of the front as a function of time. The channel
inclination is 30◦. Points correspond to experimental data with par-ticle entrainment, the solid lines represent the experimental curves without entrainment. front position (m) time (s) + + + + + + + + + + + + + × × × × × × × × × × × × × ⊕ ⊕ ⊕ ⊕ ⊕ ⊕ ⊕ ⊕ ⊕ ⊕ ⊕ ⊕ ⊕ ♦ ♦ ♦ ♦ ♦ ♦ ♦ ♦ ♦ ♦ ♦ ♦ ♦ ◊ ◊ ◊ ◊ ◊ ◊ ◊ ◊ ◊ ◊ ◊ ◊ ◊ ∆ ∆ ∆ ∆ ∆ ∆ ∆ ∆ ∆ ∆ ∆ ∆ ∆ ∇ ∇ ∇ ∇ ∇ ∇ ∇ ∇ ∇ ∇ ∇ ∇ ∇ 0 2 4 6 8 10 12 14 16 0.4 0.8 0.6 1.0 1.2 1.4 1.6 1.8
Fig. 5. Position of the front as a function of time. The channel
inclination is 45◦. Points correspond to experimental data with par-ticle entrainment, the solid lines represent the experimental curves without entrainment.
the bed slope and particle entrainment upon the velocity. We found:
dx
dt =0.09t
−0.03for θ = 45◦without entrainment, dx
dt =0.10t
0.07for θ = 45◦with entrainment, dx
dt =0.09t
0.08for θ = 30◦without entrainment, dx
dt =0.09t
0.09for θ = 30◦with entrainment.
These values show that:
– in each case the velocity was fairly constant,
– the effect of entrainment is evident in the values of
ve-locities for the steeper slope,
– Surprisingly, the current moved faster for 30◦than for 45◦.
184 M. Rastello et al.: An experimental study of particle-driven gravity currents 0 xx0 x-0 x x-log( angle=45,without entrainment angle=45,with entrainment angle=30,without entrainment angle=30,with entrainment log( ) log( x0 t 0 t +0.16 =1.05log( ) ) t t0) -0.9 -0.71 -0.51 -0.32 -0.13 0.06 0.26 0.45 0.1 -0.1 -0.3 -0.5 -0.7 0.3 0.5 0.7 + + + + + + + + + + + + + + + + + + + ++ ++ + + + + + + + + + + + + + + + + + + + + + + ++ + + + + + + + + + + ++ + + + + + + + + + + ++ + + + + + + + + + + + + + × × × × × × × ×× ×× × × × × × × × × × × ×× × × × × × × × × × × ×× × × × × × × × × × × ×× × × × × × × × × ×× ×× × × × × × × × × × × ×× × × × × × × × × × × ×× × ◊ ◊ ◊ ◊ ◊ ◊ ◊ ◊ ◊ ◊ ◊ ◊ ◊ ◊ ◊ ◊ ◊ ◊ ◊ ◊ ◊ ◊ ◊◊ ◊ ◊ ◊ ◊ ◊ ◊ ◊ ◊ ◊ ◊ ◊◊ ◊ ◊ ◊ ◊ ◊ ◊ ◊ ◊ ◊◊ ◊◊ ◊ ◊ ◊ ◊ ◊ ◊ ◊ ◊ ◊ ◊ ◊ ◊ ∆ ∆ ∆ ∆ ∆ ∆ ∆ ∆ ∆∆ ∆∆ ∆ ∆ ∆ ∆ ∆ ∆ ∆ ∆ ∆∆ ∆∆ ∆ ∆ ∆ ∆ ∆ ∆ ∆ ∆ ∆∆ ∆∆ ∆ ∆ ∆ ∆ ∆ ∆ ∆ ∆ ∆∆ ∆∆ ∆ ∆ ∆ ∆ ∆ ∆ ∆ ∆ ∆∆ ∆∆ + × ◊ ∆ Fig. 6. log(x−x0
x0 )is plotted versus log(
t
t0), for the four types of experiment we performed. The linear regression obtained from all the points is also plotted.
This last point probably resulted from differences in initial conditions, as explained below. Thus no direct estimation of the slope effect on the front velocity could be made.
3 Discussion
3.1 Previous results 3.1.1 Experimental results
As mentioned in the introduction, many experiments have been performed on gravity currents. Here we focus on those concerning currents resulting from instantaneous releases. In this case the heavy fluid is generally kept initially in a box. This box has a door, which is opened suddenly to release the fluid at the beginning of the experiment. In this context, three phases have been shown in the studies on low slopes. The first phase is a slumping regime. In this phase the veloc-ity is a constant, which is dependent on the initial conditions. The second phase is an inertial regime. The front velocity scales as t23. A convenient way of displaying such a scaling is to plot log(xf−x0 x0 )vs. log( t t0). x0is a characteristic length of the box, t0= √x0 g0h 0 with g0=gρt−ρw
ρw the reduced gravity
and h0the initial height of the flow. As described by Rottman
and Simpson (1983) and by Simpson (1987) when the door is suddenly opened a backward-moving wave is created. When this wave encounters the back of the box it is reflected and goes downward. These authors say that the transition from the first phase to the second occurs when this wave reaches the front of the gravity current. The duration between the beginning of the experiment and the transition is very depen-dent on the initial conditions, such as the shape of the box, the ratio 8 of the height of the heavy fluid to the height of the ambient fluid, etc. For example, with the same configuration
for the box and a ratio 8 varying from 0 to 1, the distance at which the transition occurs is multiplied by a factor of more than 3. The third phase is a viscous regime. In most of the studies, the viscous regime is assumed but not reached be-fore the end of the channel. Here we would need a channel at least ten times longer to reach this regime. All the previous studies that have been performed on steep slopes focused on the second phase of the flow.
3.1.2 Brief description of existing models
Currently two kinds of models are used to describe gravity currents: The so-called “box-model” is a model widely used by the authors studying currents on low slopes. The princi-ple of this model is that the behavior is governed by the front. On the basis of Benjamin’s (1968) study, and the hypothesis that during the whole run of the front of the current, its tail does not move, a law for the velocity of the front is deduced. When the current is a turbidity current, an Einstein sedimen-tation law is added. The second kind of model has been de-veloped by the authors studying the currents on steep slopes. This model is based on the conservation of mass and of lin-ear momentum of the whole current supposed to be a finite volume, which grows while going downslope. This model is explicitly devoted to the second phase of the current. 3.2 The interpretation of our results
3.2.1 A first phase regime
To determine which phase was apparent in our experiments, we plotted log(x−x0
x0 )vs. log(
t
t0). As we began measuring the time twenty centimeters after the gate (forty centimeters down from the back of the box), we chose to take this value of forty centimeters for x0. t0is defined as Simpson (1987) did:
t0=√x0
g0h
0
. In Fig. 6 these logarithms are plotted for the four types of experiments. We also plotted the linear regression inferred from all the points.
From this figure we can conclude that all our experiments were completely in the slumping regime, i.e. in the first phase of the flow, where the velocity is a constant. The value of this constant was very dependent on the initial conditions. Indeed, the velocity was approximately the same for both an-gles but was a little bit larger for an angle of 30◦. The in-crease in velocity cannot be ascribed to the initial geometry since that was kept identical for both angles. More likely, this was due to the greater initial push for an angle of 30◦than for an angle of 45◦. This difference in velocity is not very acute, but does exist. This seems to be linked to the presence of the deflector whose angle with the horizontal varies with the slope angle. The hypothesis is that a kind of Boycott effect occurs. The velocity of the returning water in this effect is dependent on the angle with the horizontal. This could ex-plain the difference in velocity we observed.
Surprisingly enough, in our experiments, flows were in a slumping phase. This contrasts with previous experiments, such as Beghin’s (1979) experiments showing a rapid
tran-sition from a slumping phase to an inertial regime. An ex-planation could be linked to the value of the Froude number at the front. Indeed, let us assume, as Rottman and Simpson (1983) and Simpson (1987) did, that the transition from the first phase to the second occurs when the wave created by the opening of the door reaches the front of the current. In the previous studies, the flow was a finite volume of salted water in clean water. The order of magnitude of the different pa-rameters was at the beginning: g0≈0.2 m/s2, h ≈ 0.2 m and u ≈ 0.1 m/s1. This leads to a densimetric Froude number (F rd = U
2
g0H) of approximately 0.5. Beghin (1979) plotted
the densimetric Froude number and showed that it decreased during the flow. In the previous experiments, the densimet-ric Froude number was always below 1, and thus waves were able to go upstream from the back to the front of the current. In our case, at the beginning, g0 ≈ 0.03 m/s2, h ≈ 0.2 m
and u ≈ 0.1 m/s1, the densimetric Froude number is thus much greater than 1. So in our configuration, because g0is
ten times lower than in the other experiments, the flow begins to run down the channel with a densimetric Froude number at the front greater than 1, and the waves cannot catch up the front. We plotted neither the value of the height of the suspension nor the value of the densimetric Froude number during the flow, but the estimation of h ≈ 0.3 − 0.4 m and u ≈ u0 ≈0.1 m/s1at the bottom of the channel leads us to
assume that the densimetric Froude number was still greater than 1. This explains why, in our experiment, the flow during the whole run remains in the first phase.
3.2.2 How to model?
The main differences between our experiments and previous experiments that treated both the first and second phase are:
– The turbidity current went down slopes of 30◦ to 45◦ whereas the other authors used very small slopes.
– In many models that treat these experiments, such as
the “box-models”, the hypothesis is made that the tail of the gravity current is still at its initial place at every stage of the experiment. Numerically it is expressed by keeping the product l ∗ h constant with l the length of the gravity current and h its height. In our case, this hypothesis does not work at all because the tail of the gravity current also goes down the channel.
Because of these two points, it will be difficult to apply the various models that have been developed by other authors to our experiments. The models developed for steep slopes concern the second phase of the flow and cannot be applied to our case. Our next efforts will be focused on the modelling of this first regime and on the study of the differences between the first and the second phase. This should lead us to a better understanding of the phenomena occurring in the first phase on steep slopes. At this stage, we would be able to point out how the present results can be applied to field scale.
References
Beghin, P.: Etude des Bouff´ees Bidimensionelles de Densit´e en Ecoulement sur Pente avec Application aux Avalanche de Neige Poudreuse, Institut National Polytechnique de Grenoble, May, 1979.
Beghin, P., Hopfinger, E. J., and Britter, R. E.: Gravitational con-vection from instantaneous sources on inclined boundaries, J. of Fluid Mechanics, 107, 407–422, 1981.
Beghin, P. and Olagne, X.: Experimental and theoretical study of the dynamics of powder snow Avalanches, Cold Regions Science and Technology, 19, 317–326, 1991.
Benjamin, B.: Gravity currents and related phenomena, J. of Fluid Mechanics, 31, 209–248, 1968.
Gladstone, C. and Woods, A. W.: On the application of box models to particle-driven gravity currents, J. of Fluid Mechanics, 416, 187–195, 2000.
Hopfinger, E. J. and Tochon-Danguy, J.-C.: A model study of pow-der snow avalanches, J. of Glaciology, 19, 81, 343–356, 1977. Hopfinger, E.-J.: Snow avalanche motion and related phenomena,
Ann. Rev. Fluid Mech., 15, 47–76, 1983.
Huppert, H. E. and Simpson, J. E.: The slumping of gravity cur-rents, J. of Fluid Mechanics, 99, 785–799, 1980.
Parker, G. Garcia, G., Fukushima, Y., and Yu, W.: Experiments on turbidity currents over an erodible bed, J. of hydraulic research, 25, 1, 123–147, 1987.
Rottman, J. W. and Simpson, J. E.: Gravity currents produced by instantaneous releases of a heavy fluid in a rectangular channel, J. of Fluid Mechanics, 135, 95–110, 1983.
Simpson, J. E.: Gravity currents: In the environment and the labo-ratory, Ellis Horwood, 1987.
Sovilla, B., Sommavilla, F., and Tomaselli, A.: Measurements of mass balance in dense snow avalanche events, Ann. of Glaciol-ogy, 32, 2001.