DYNAMICS OF THE EQUATORIAL UNDERCURRENT AND ITS TERMINATION by
Sophie Huguette Claire Wacongne
Doctorat 3e cycle en "Physique des Liquides" Universit4 Paris 6, France (1980)
Matrise, Universite Paris 6, France (1977)
SUBMITTED IN PARTIAL FULFILLMENT OF THE REQUIREMENTS FOR THE DEGREE OF DOCTOR OF PHILOSOPHY
at the
Massachusetts Institute of Technology and the
Woods Hole Oceanographic Institution January 1988
@ Sophie Wacongne 1988
The author hereby grants to MIT permission to reproduce and to distribute copies of this thesis document in whole or in part
Signature of the Author
Joint Program In Oceanography, Massachusetts
Institute of Technology - Woods Hole Oceanographic Institution
Certified by:
Accepted by:
Mark Cane Philip Richardson
Thesis Supervisors
(/6oseph Pedlosky
Chairman, Joint Committee for Physical Oceanography, Massachusetts Institute of Technology - Woods Hole Oceanogra
DYNAMICS OF THE EQUATORIAL UNDERCURRENT
AND ITS TERMINATION
by S. Wacongne
submitted in January 1988 in partial fulfillment of the requirements for the Degree of Doctor of Philosophy in Physical Oceanography.
ABSTRACT
This study focuses on the zonal weakening, eastern termination and seasonal variations of the Atlantic equatorial undercurrent (EUC). The main and most original contribution of the dissertation is a detailed
analysis of the Atlantic EUC simulated by Philander and Pacanowski's
(1986)general circulation model (GCM), which provides a novel description of the dynamical regimes governing various regions of a nonlinear strati-fied undercurrent.
Only in a narrow deep western region of the simulation does one find an approximately inertial regime corresponding to zonal acceler-ation. Elsewhere frictional processes cannot be ignored. The bulk of the mid-basin model EUC terminates in the overlying westward surface flow while only a small fraction (the deeper more inertial layers) terminates at the eastern coast. In agreement with observations, a robust feature of the GCM not present in simpler models is the apparent migration of the EUC core from above the thermocline in the west to below it in the east. In the GCM, this happens because the eastward flow is eroded more efficiently by vertical friction above the base of the ther-mocline than by lateral friction at greater depths. This mechanism is a plausible one for the observed EUC. A scale analysis using a depth scale which decreases with distance eastwards predicts the model zonal trans-ition between western inertial and eastern inertio-frictional regimes.
Historical and recent observations and simple models of the equatorial and coastal eastern undercurrents are reviewed, and a new analysis of current measurements in the eastern equatorial Atlantic is presented. Although the measurements are inadequate for definitive con-clusions, they suggest that Lukas' (1981) claim of a spring surge of the Pacific EUC to the eastern coast and a seasonal branching of the EUC
into a coastal southeastward undercurrent may also hold for the Atlantic Ocean. To improve the agreement between observed and modelled strength of the eastern undercurrent, it is suggested that the eddy coefficient of horizontal mixing should be reduced in future GCM simulations. Thesis supervisors:
Mark Cane, Doherty Senior Scientist, Adjunct Associate Professor in Geological Siences, Visiting Professor at the Center for
Meteorology and Physical Oceanography at M.I.T.
ACKNOWLEDGEMENTS
To
some degree, the completion of this dissertation has
undoubt-edly been an exciting motivating and enjoyable scientific experience.
It
would be unfair however not to mention that it
also involved
drain-ing struggles with dead ends, with changes of focus, with
misunderstand-ings, and with the "spirit of the deadline".
I therefore wish to insist on my deep gratitude to Mark Cane, Phil
Richardson and George Philander not only for their guidance but also for
their constant heart warming display of optimism and confidence. I
attribute my perseverance to the combined effect of their always
posi-tive attitude, the affectionate support of my officemates, housemates
and other friends and relatives, the balancing presence of Kevin, and
shear obstinacy on my part, for all of which I am very thankful.
I
also
thank Paola Rizzoli, John Toole and Joe Pedlosky for the
time they spent at giving me valuable detailed comments on my
dissert-ation.
Paola and John deserve extra thanks for their patience and
good-heartedness at committee meetings,
and Joe for the excellent job he did
at tempering
any undue excess of optimism along the way.
I am pleased and grateful that Nick Fofonoff agreed to chair my
thesis defense, and I have
to
acknowledge the help I received
from my
self appointed "anti advisor" Bill Schmitz towards keeping my sense of
humor alive.
I
am indebted to Bruno Voituriez and Boer Piton who let me use
their Gulf of Guinea profiler current meter data, and to Jean-Jacques
Lechauve and Daniel Corre who prepared the tapes. I
am deeply indebted
to Ron Pacanowski who provided the model data that I analysed and
kind-ly helped me decipher the model code and the GFDL computer language, and
to Mary Hunt who adapted the tape decoding software provided by Steve
Hankin. I
am also forever indebted to Mary Ann Lukas who typed and
edited most of my dissertation as if
it
was fun, and I
thank Jayne
Doucette who drafted some of the figures.
My interaction with the scientists involved in
the SEQUAL/FOCAL
program has been instructive in
many ways and very motivating, and I
thank them all for having made me feel at ease in
their company.
Re-peated encouragements from Ed Sarachik and conversations with Eli Katz
and Christian Colin were specially appreciated.
Finally I
wish to thank the Joint Program for having given me the
opportunity to spend several years among the American oceanographic
community, pursue my education and meet the great people I met, and I
thank the staff of M.I.T.'s International Students
Office for their
helpfulness and efficiency.
Special thoughts went to Melissa, Joyce and Betsy during the
writing of this thesis.
This work was supported by NSF grants
TABLE OF CONTENTS
Introduction p. 11
Chapter 1:OBSERVATIONAL AND THEORETICAL REVIEW p. 15
1.1 Wind forcing over the tropics p. 16
1.2 Simplest explanations for the existence of steady p. 20 eastward flow within the equatorial thermocline
1.2.1 Zonal pressure gradient forcing 1.2.2 Conservation of vorticity
1.2.3 Driving by upwelling
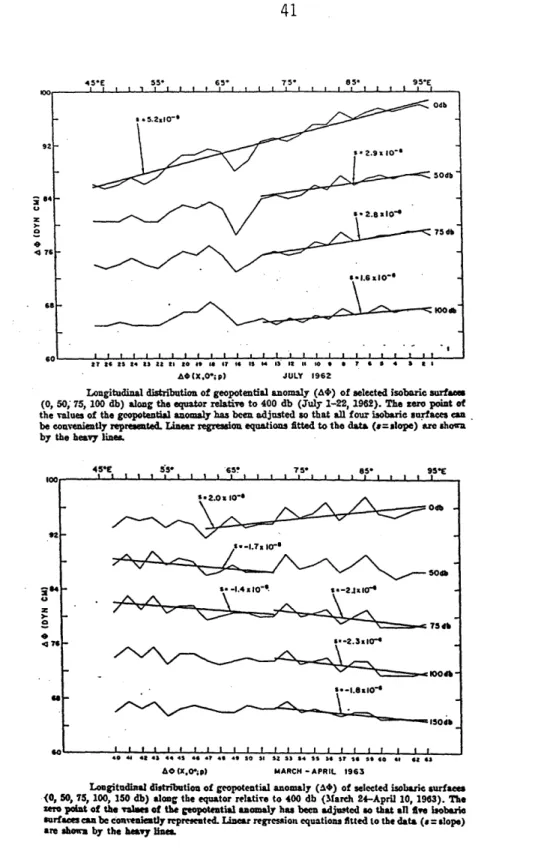
1.3 Observations of the equatorial zonal pressure gradient p. 26 (or of the longitudinal structure of the dynamic
topography)
1.3.1 Seasonal variations of the equatorial ZPG in the Atlantic
1.3.2 Seasonal variations of the equatorial ZPG in the Pacific
1.3.3 Seasonal variations of the equatorial ZPG in the Indian Ocean
1.4 Observational basis for a relationship between EUC and p. 40 ZPG
1.4.1 Zonal circulation
1.4.1.1 Atlantic undercurrent 1.4.1.2 Pacific undercurrent 1.4.2 Meridional circulation
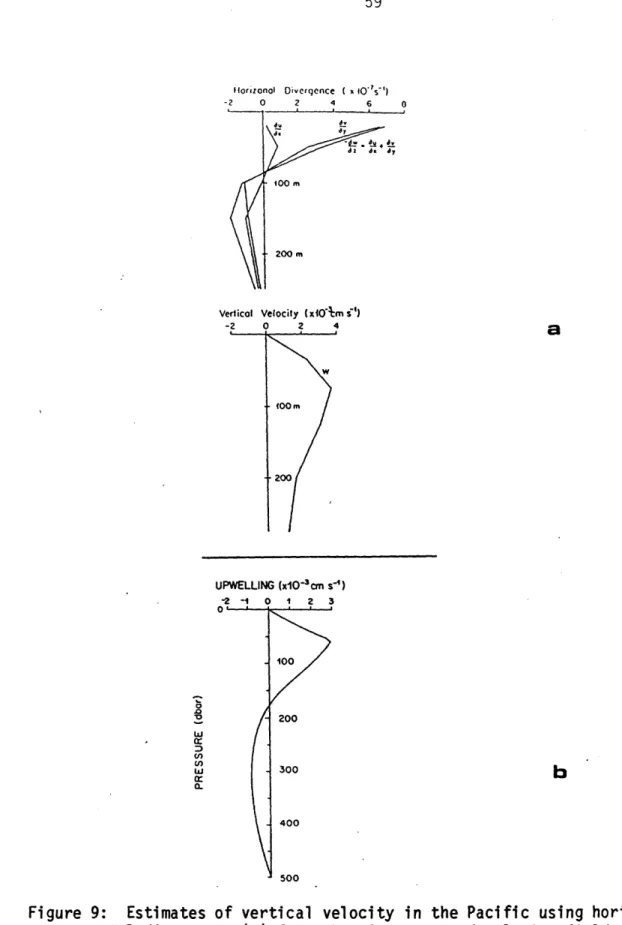
1.4.2.1 Observations in the Pacific Ocean
1.4.2.2 Observations in the Atlantic Ocean 1.4.3 EUC eastern termination
1.6 Review of EUC models p. 73 1.6.1 Steady models
1.6.1.1 Layer models
1.6.1.2 Continuously stratified models 1.6.2 Time-dependent models
Chapter 2: EASTERN TERMINATION OF THE EQUATORIAL UNDERCURRENT p.101 2.1 Eastern termination of the Pacific EUC p.102 2.2 Eastern termination of the Atlantic EUC p.114 2.3 Current meter measurements in the eastern Gulf of p.137
Guinea
2.4 Seasonal variations of the EUC at 4'W p.151 2.5 Coastal undercurrent off the coast of Gabon p.17 4
2.6 Conclusion p.187
Chapter 3: DYNAMICS OF A SIMULATED EQUATORIAL UNDERCURRENT p.195
3.1 Basic features of the model p.196
3.2 Description of the simulated circulation p.200 3.2.1 Annual mean
3.2.2 Time dependence
3.3 Dynamical analysis of the general circulation model p.220 3.3.1 Zonal evolution of the annually averaged zonal
momentum balance (ZMB) along the equator
3.3.2 Meridional structure of the annually averaged ZMB at various longitudes
3.3.3 Time evolution of the ZMB at 00N 25'W
Chapter 4: PERFORMANCE OF THE GENERAL CIRCULATION MODEL p.283 IN SIMULATING ATLANTIC OBSERVATIONS
4.1 The SEQUAL run p.289
4.2 The half climatology run p.2 99
4.3 Discussion p.299
Chapter 5: DISCUSSION OF THE EQUATORIAL UNDERCURRENT p.309 DYNAMICS SIMULATED BY THE GENERAL CIRCULATION MODEL
5.1 Comparison between the dynamical regimes simulated p.310 by the GCM and by simpler models
5.1.1 Charney's (1960) nonlinear frictional EUC 5.1.2 Pedlosky's (1987) purely inertial EUC
5.1.3 Veronis' (1960) nonlinear frictional stratified EUC
5.2 Vertical scales relevant for the dynamical regimes p.317 simulated by the GCM
5.3 Conceptual model of an x-dependent upper undercurrent p.324 5.3.1 Input from scale analysis
5.3.2 Simulation of a zonal transition between regimes under zonally uniform easterly wind forcing
5.4 Justification for a deep undercurrent in the simulation p.333
Conclusion p.33 5
References p.339
Appendix I: MERIDIONAL STRUCTURE OF THE FLOW AND OF THE ZONAL P.353 MOMENTUM BALANCE SIMULATED BY THE GENERAL CIRCULATION
9
INTRODUCTION
The equatorial undercurrent (EUC) is
a swift narrow
subsur-face jet found in
the equatorial Pacific and Atlantic thermocline (and
in
the Indian Ocean thermocline on a seasonal basis) below predominantly
westward surface flow. This current has been the object of many
obser-vational and theoretical studies over the last forty years which
resulted in
an abundant literature on observations and theoretical
justifications of the undercurrent existence. The following questions
related to the dynamics of the EUC are however still unanswered. How
does the EUC form in
the western equatorial oceans and how does it
terminate in
the east
?
What is the zonal evolution of the system
?
How
do EUC speed and transport depend upon the forcing
(Why is
the Pacific
EUC stronger than the Atlantic EUC, given southeasterlies of similar
magnitude over both basins'?) How does the EUC vary on seasonal and
interannual time scales
T
This thesis contributes elements of answers to some of these
questions, through two distinct studies. The first, observational, is
aimed at determining whether presently available velocity measurements
in
the Gulf of Guinea (eastern equatorial Atlantic) confirm the
circula-tion pattern for the EUC terminacircula-tion inferred from indirect methods.
Special attention is
given to a southeastward branching of the EUC into
a poleward coastal undercurrent. While it
is
demonstrated that the
spa-tial and temporal distribution of the velocity measurements is
inade-quate to allow for definitive conclusions, two partial conclusions can
be made.
First the analysis of unpublished moored profiler current
meter measurements off Gabon
and Congo presented in
this thesis provides
the first statistically significant estimate of a mean poleward
velocity measurements reviewed in
the eastern equatorial Pacific and
Atlantic do not contradict Lukas'(1981) hypothesis of a seasonal surge
of eastern EUC waters leading to a direct seasonal branching of the EUC
into the coastal southeastward undercurrent near the longitude where
the equator meets the eastern boundary.
The second study proposes a possible balance of zonal forces
for a nonlinear stratified EUC. The results are obtained from the
diag-nostic analysis of a climatologically forced general circulation model
(GCM) of the tropical Atlantic (Philander and Pacanowski, 1986a). No
complete theory of a nonlinear stratified undercurrent is
presently
available, and no set of measurements yields estimates of all dynamical
terms at one time. Thus the appropriate set of approximations one
should use to study the dynamics of the observed EUC is
not conclusively
determined. However, that the core of the EUC is
generally found in
the thermocline suggests the importance of stratification. Further,
both direct measurements and order of magnitude estimates point to the
importance of the advective terms in
the zonal momentum equation. On
the other hand, theoretical studies have shown that virtually any
combination of terms from the zonal momentum balance can result in
an
eastward subsurface flow under realistic forcing, even in
a homogeneous
layer. The approach undertaken in
this dissertation was thus a logical
step: start with the flow simulated by a model able to reproduce most
of the physical processes expected to play a role at the equator, and
reconstitute the dynamical balances within the simulated flow. The
simulated flow is
thus described in
detail, the terms of the zonal
momentum balance are computed, several regions of simplified dynamical
regimes are identified and the relevance to the real ocean is
discussed.
This somewhat novel approach is
found powerful and promising for the
study of other oceanic processes with comparably rich dynamics.
The most robust feature of the EUC zonal evolution in both the observations and the simulation is shown to be a relative eastward diving of the EUC core from above the (deep) western thermocline to
below the (shallow) eastern thermocline. Simpler models of the
under-current have so far been unable to simulate this feature, justifying
our analysis of the GCM. The reason for the apparent crossing of the
thermocline by the EUC in the model can be traced to differential dis-sipation on the upper and lower layers of the undercurrent: the
east-ward
momentum of the upper layers is
dissipated at a fast rate by
vigorous vertical friction against the overlying westward flow, while
the eastward momentum of the lower layers is
dissipated at a slow rate
by weak lateral friction. Even though there is
in
the west more
eastward momentum above than below the base of the thermocline, the
upper momentum is
discarded faster along the EUC eastward course and the
vertical profiles in
the east eventually exhibit more eastward momentum
below than above the base of the thermocline. We suggest that this is
a
plausible mechanism for the apparent crossing of the thermocline by the
observed undercurrent.
A simple scale argument applied to the upper undercurrent
can explain the zonal transition between the inertial and the eastern
frictional regimes identified in
the GCM simulation. It
is
argued that
a proper depth scale for the upper undercurrent must decrease from west
to east as does the thermocline depth. Therefore a longitude can exist
at which the decreasing depth scale of the inertial regime becomes
comparable to the depth scale of the overlying frictional sublayer
(directly forced by the imposed wind stress), and past which the two
regimes merge into one.
The dissertation is
organized as follows:
Chapter 1
presents a review of observations and theories of the EUC of
relevance to its zonal and temporal variations, focusing on the
possible role of zonal pressure gradient variations in forcing
EUC variations.
Chapter 2 concentrates on the EUC termination in the eastern equatorial
Pacific and Atlantic oceans and presents a new analysis of data
bearing on the question of the connection of the Atlantic EUC to
a poleward undercurrent off Gabon and to the EUC seasonality at
4'W.
Chapter 3 contains the diagnostic analysis of the Atlantic EUC
simulated by the Philander and Pacanowski's GCM and the
description of
the zonal,
meridional, vertical and
temporal
structure of the model zonal momentum balance.
Chapter 4 analyses the performance of the GCM in
simulating real
Atlantic observations and proposes parameter changes which may
improve the agreement between the two.
Chapter 5 offers a more conceptual interpretation of the dynamical
regimes identitied in the
GCM
simulation. These regimes are
compared to the predictions of steady models and a new simple
conceptual model of an upper x-dependent EUC is
built, which
provides a visual illustration of the zonal transition between
western inertial and eastern frictional regimes.
Chapter 1. OBSERVATIONAL AND THEORETICAL REVIEW
This chapter discusses basic concepts for the existence of
the equatorial undercurrent and reviews current knowledge of its large
scale zonal evolution based on available observations and model
predic-tions. Observational and theoretical evidence for a relationship
between the zonal structure of the EUC and that of the wind stress
forcing (via basin-wide pressure gradients and local upwelling) is
specially investigated.
For general reviews of equatorial and undercurrent
measure-ments and dynamics, the reader is
referred to Arthur (1960), Montgomery
(1962), Philander (1973), Gill (1975), Moore and Philander (1977),
O'Brien (1979), Philander (1980), Leetmaa, McCreary and Moore (1981),
Cane and Sarachik (1983), Knox and Anderson (1985), McPhaden (1986),
and Eriksen and Katz (1987).
1.1
Wind forcing over the tropics
The main wind system over the tropical Atlantic and Pacific
Oceans are the Southeast trades, which converge towards the Northeast
trades, meeting them at the intertropical convergence zone (ITCZ),
located on average north of the equator. In
both oceans, this regime
becomes a southwest monsoon over the easternmost basin. The dynamical
forcing is
therefore neither symmetrical with respect to the equator
nor uniform with longitude. On seasonal time scales, the ITCZ migrates
meridionally, creating in
the central equatorial Atlantic and Pacific a
pattern of strongest winds during boreal summer when the ITCZ lies at
its northernmost position, a secondary maximum during austral summer
when it
reaches south of the equator, and weakest winds in
early
spring, with a secondary minimum in
late fall. Climatological wind
stress fields were computed for example by Wyrtki and Meyers (1976) for
the Pacific Ocean, and by Hellerman and Rosenstein (1983) for the world
oceans.
The main differences in
the wind fields of the tropical
Atlantic and Pacific are found in their structure with longitude
(Fig-ure 1)
and in
the relative importance of their interannual and seasonal
variations. Over the Atlantic ocean, the mean zonal wind stress, from
westerly off the African coast, grows more and more easterly towards
the west, and reaches a peak near 40'W, very close to the Brazilian
coast. Over the Pacific Ocean, which is
between two and three times as
wide as the Atlantic, the mean wind stress is
again, from westerly off
the coasts of Ecuador, more and more easterly towards the west, but it
peaks around 150W, i.e. at about the center of the basin, and
decreas-es further wdecreas-est to wdecreas-esterly off Indondecreas-esia. Part of the year, wdecreas-esterly
winds are observed over much of the western Pacific. If
one compares
only the zonal wind stress over the Atlantic and the eastern Pacific,
longitudinal patterns are actually very similar. Differences occur in
the ranges of variation of the zonal wind stress with time: seasonal
changes have similar amplitudes in
the eastern Atlantic and the
east-ernmost Pacific, but they are larger in
the western Atlantic (0.5 to
IAMI >AX .TtELN ... .1 W e .... . ...
.
.
.
.K..
.
.
.
.
..
.
.
.
N SE AL AU J T1 W1 A4
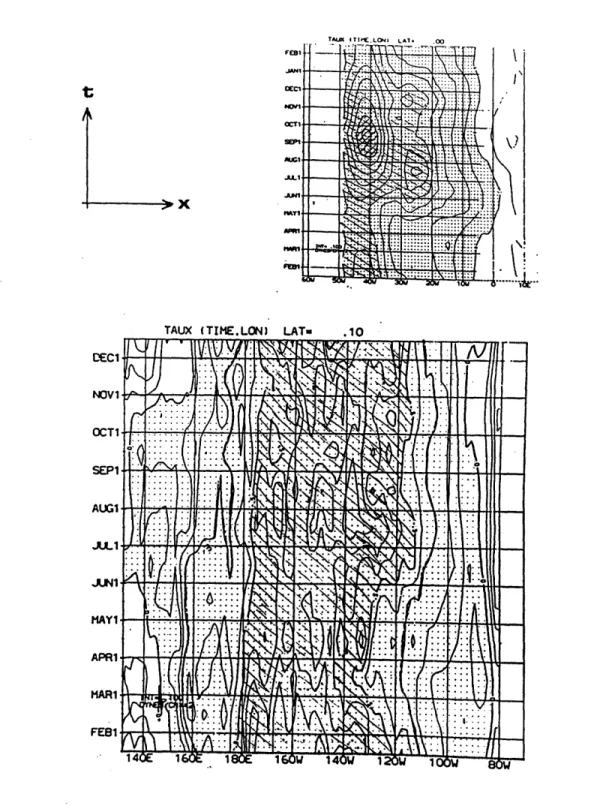
N. .*... MAY1 - -- ---.-- -APR1 MARl . FE81 --84 1 1 1 W 140W 1W-Figure 1: Longitude-time plots of the Hellerman and Rosenstein (1983) zonal wind stress at the equator over (a) the Atlantic Ocean;
(b) the Pacific Ocgan. Easterlies are dotted; values larger than -0.5 dynes/cm (in absolute value) are cross-hatched. (Philander and Pacanowski, personal communication).
Also, while the Atlantic seasonal signal is
more annual (one extremum
per year) in
the west, more semi-annual (two extrema per year) in
the
center and the east (due to the tilt of the ITCZ), the Pacific seasonal
signal is
more annual at the easternmost and westernmost longitudes,
and more semi-annual at the center of the basin. Finally, interannual
wind variations have been observed over both the equatorial Pacific,
where they have been intensively investigated in
connection with El
Nino events (Wyrtki, 1975), and the equatorial Atlantic (Picaut et al.,
1984). In
both cases, interannual variations affect more the central
or western longitudes than the eastern ones. Their amplitude is,
how-ever, larger in
the central and western Pacific (where they can
domin-ate the seasonal signal) than in
the western Atlantic.
The situation over the tropical Indian ocean is
drastically
different. Each year, southwest winds dominate the atmospheric
circu-lation during boreal summer and globally switch to the northeast for a
few months during boreal winter (Wyrtki, 1973).
Only then is the wind
stress field similar to that over the other two equatorial oceans, with
however a northerly rather than a southerly component and a
more
com-plicated zonal structure (easterlies are confined to the western part
of the basin only).
Steady easterlies blowing over a
meridionally bounded
tropical ocean have two main effects on the surface water: (1)
to pile
it
up towards the western boundary along the equator, creating an
east-ward zonal pressure gradient (ZPG) force which acts against the wind
stress, (2)
to drive it
polewards through Ekman divergence, creating
upwelling at the equator to replenish mass. The presence of a
south-erly wind'component introduces a
meridional asymmetry: surface waters
are driven northwards across the equator and a convergence (divergence)
appears north (south) of it
at the latitude of transition with the
off-equatorial eastward (westward) Ekman transport. [In the simplest case
of an x-independent southerly wind, the ocean response is
also
x-independent (away from meridional boundaries) and the convergence and
divergence north and south of the equator are purely meridional
The latitudes of convergence and divergence constitute dynamical
boundaries onto which a meridional tilt of the sea surface slope gets
anchored, upwards to the north, corresponding to a southward pressure
gradient force which opposes the southerly wind stress. The combined
effect of the easterly and southerly components of the wind is
there-fore to create a southeastward pressure gradient force at the equator
and to displace the region of divergence south of the equator. As the
winds
change, so do the surface ZPG, the upwelling rate, and presumably
the equatorial circulation as a
whole. But the way in
which the
adjustment takes place depends on the magnitude and the rapidity of the
changes in
the wind stress since these changes affect the Ekman flow
and thus the upwelling rate instantly, but they affect the ZPG on a
longer time scale as adjustment of the density field requires
propagation and reflections of equatorial waves (section 1.6.2).
1.2
Simplest explanations for the existence of steady eastward flow
within the equatorial thermocline
The earliest models of a steady EUC are based on three
main ideas: zonal pressure gradient forcing, conservation of
vorticity and driving by upwelling.
1.2.1 Zonal pressure gradient forcinj
Since the Coriolis force becomes zero at the equator, no
deflection occurs there, and zonal flow is
expected to be driven by
zonal forces. Accordingly, the EUC has been described as a
compensa-tion current flowing "downhill" below a friccompensa-tionally driven westward
surface flow. The implicit assumption is
made that the vertical decay
scale of westward stress due to the local wind is
less than that of the
eastward ZPG force set up basinwide by the easterlies which accumulate
water at the western boundary of the ocean. (That the frictional
stresses would become negligible at shallower depths than the ZPG force
driven inviscid interior are very successful; however frictional
effects may reach deeper at the equator where penetration scales are
difficult to predict a priori). In a stratified ocean with a sharp
thermocline, one expects pressure gradients to weaken rapidly with
depth through baroclinic adjustment and to become negligible below the
thermocline, and one expects motion below the thermocline to be much
weaker than motion above, with the EUC confined at levels of net
east-ward force. The importance of the equatorial ZPG was first stressed by
Montgomery and Palmen in 1940, in connection with the dynamics of the
North Equatorial Countercurrent (NECC).
Their arguments apply more
convincingly to the EUC, as
the deflecting force present at the
lati-tude of the NECC vanishes at the equator, simplifying the reasoning.
Thus, in
a baroclinic system forced by steady easterlies, the expected
vertical profile of
(-p )
is
maximum (and positive) at the surface. In
other words, the ZPG forcing exists (with weakening amplitude) from the
surface down to some level in
or below the thermocline, and its
ten-dency is
to drive the corresponding water column eastwards in
a
surfa-ce-intensified jet. Only because of the presence of the stress-driven
surface westward flow (which sets up the opposing ZPG) does the
"under-current" have a subsurface core. If
the local winds, after
establish-ing the ZPG, were to disappear
temporarily, then on time scales short
compared to the relaxation of the density field, the maximum eastward
flow would indeed be found
at the surface (Philander, 1973).
A similar argument applies to the meridional flow: with
the southerly component of the wind stress driving frictionally a
northern component of flow and creating a positive meridional surface
slope across the equator, water at subsurface levels is
expected to be
driven southwards by the resulting meridional pressure gradient force,
rationalizing the often observed slight southern shift of the EUC core.
[During the 1982-84 FOCAL program, for example, six out of the nine
cruises show such a shift near 25'W (Hnin, Hisard and Piton, 1986)].
1.2.2 Conservation of vorticity
Looking at meridional sections of water properties in the
central equatorial Pacific, Cromwell (1953) found evidence for
equato-rial upwelling, which he related to surface Ekman divergence off the
equator. Using isentropic analysis, he then deduced a pattern of
meridional circulation consisting of divergent flow at the surface,
upwelling at the equator, and convergent flow in
the thermocline, to
be superimposed on any existing zonal flow.
Using an idealization of Cromwell's meridional circulation,
symmetrical with respect to the equator, Fofonoff and Montgomery (1955)
showed that conservation of absolute vorticity implied a nonlinear
transformation of the subsurface equatorward flow into eastward flow
at the equator. As the authors pointed out, an eastward ZPG force is
still needed in
that model to account for "the gain of eastward
momen-tum by the water flowing towards the equator"; this is
better understood
in
terms of gain of angular momentum, as explained by Cane (1980).
Consider a steady frictionless horizontal system where x-gradients
other than px
are negligible compared to y-gradients, and call
y
0the
latitude from
which water originates; the equations of conservation of
momentum and vorticity reduce to:
du/dt - fv = (uy - Sy)v =-p/p
d(f+ )/dt = -v(uy
-By)
= 0So:
u -
By = px/(Pv)
=-sy
0 , assuming uy(y0)
=0,
u = sy - p /(pv) = (y - y0 and, at y = 0:
u(0) = -ey02/2 + 0 )/(pv) dy = +oy02/2 , assuming u(y0) = 0.
Without a positive ZPG force
(-p ),
the angular momentum (uy
-
sy)
Hide's (1969) theorem according to which the winds at the equator
can-not be westerly]. Furthermore, it
is
because of the existence of a
negative
p
in
and above the thermocline that an equatorward return
flow of Cromwell's meridional circulation occurs and that it
occurs
geostrophically throughout these levels (rather than in
some bottom
frictional layer), making the vorticity conservation argument relevant
to the EUC. So one obtains the surprising result that the velocity of
the EUC does not depend on the magnitude of the ZPG which forces it,
but only on the latitude of origin of the meridional flow.
In
terms of predicting u(O) though, this result is
more
conceptual than practical, since it
shifts the problem to that of
pre-dicting
y
0.
Furthermore, given y
0,
one only gets an order of magnitude
estimate for u(0), since, rigourously, the above integration is
not
valid all the way to the equator where, in
a steady state, friction is
needed to remove the discontinuity in
uy
,
i.e. to
"smear"
out the
unrealistic cusp that the above nonlinear solution develops. In
order
to satisfy uy
=
0
at y =
0,
the approximation of the zonal momentum
equation used above must break down within some equatorial boundary
layer. More dynamical terms are needed to balance
p
x and the flow
may no longer be considered two-dimensional and conservative. The case
of a homogeneous ocean was treated accordingly by Charney (1960) and
Charney and Spiegel (1971). Finally, saying that u(O) does not depend
on px is
not saying that u(O) is
independent of the wind forcing
alto-gether: if
one estimates y
0as the latitude of transition between
linear tropical regime and nonlinear equatorial regime, dimensional
analysis for a homogeneous ocean gives a dependence of y
0, and
there-fore of [u(O)] "
2, on t
according to Charney and Spiegel (1971),
and Cane (1979), or on T;1/8 according to Pedlosky (1987) [cf
section 5.1.2].
1.2.3 Driving
by
upwe!1_1inj
On a meridional section, isopycnals display a vertical spreading equatorwards, with meridional slopes off the equator
be anticipated by geostrophic arguments (Yoshida, 1959) and the problem
is
to explain the meridional structure of density. Yoshida uses steady
linear frictional dynamics in
a stratified ocean to explain this
merid-ional structure in
analogy with coastal upwelling: isopycnals are
de-formed by the subsurface convergence and equatorial upwelling necessary
to compensate the surface divergence caused by the easterlies, with
upward advection of density balanced by downward diffusion. Subsurface
convergence in
turn may be due to equatorward flow in
the central
basin, according to Cromwell's meridional circulation, or to downstream
deceleration of the EUC itself as it
approaches the eastern boundary.
As Yoshida's ocean is
viscous, meridional convergence needs
not be geostrophic, and it
might seem that his mechanism would generate
an EUC independently of any ZPG. At closer look however, his argument
may explain the upward sloping of the upper isopycnals equatorwards, but
not the downward sloping of the lower ones. The change of sign of the
slope is
necessary for the existence of a subsurface eastward jet:
according to the thermal wind equations, the upper region of spreading
corresponds to a negative uz, the lower region to a positive uz. The
simple equations used by Yoshida simulate an interesting surface
pole-ward flow which peaks slightly off the equator and which tends to
Ekman's solution at higher latitudes, and a surface-intensified zonal
jet centered at the equator in
the direction of the wind (uz
<0).
In
the absence of ZPG, no eastward subsurface maximum is
simulated
unless artificial boundary conditions are imposed. But if
a negative
ZPG is
present, it
may become possible for u to change sign with
depth, and we are back to the case of ZPG forcing. Neglecting lateral
friction, the steady linear zonal momentum balance (ZMB) reduces to:
-8yv = -px/P + (vu z'
At the equator, if
there is
no ZPG:
(vuz)z
=
0 ,
with
vuz =(
at z=0
and so:
If now there is a negative ZPG, i.e. a positive ZPG force:
-(Vuz z ~ xP */
vuz ~
x(-p/p)
dzJz
Since TX
<
0 and
0(-p/P)
dz >
0
vuz increases (as IzI increases) from the negative value it
has at
the surface, and becomes positive below the depth D defined by:
( -p /p) dz = - 'x
-D
provided that the variations of p with z
make this definition
possible. In
this model
it
would be the subsurface eastward flow at
the equator which, with the help of some lateral diffusion of momentum,
creates the downward sloping of the lower isopycnals by geostrophic
mass adjustment.
The ZPG and the vorticity conservation arguments reviewed
above are not only the simplest but to date the only explanations for
the existence of eastward momentum at the equator. Through the years,
models of equatorial dynamics have tried to isolate the roles of
stra-tification, nonlinearities, lateral versus vertical friction, global
versus local forcing, and have been studied intensively to see how a
steady state is reached when winds are switched on over an ocean basin
initially at rest. They have not introduced altogether new physical
mechanisms for the EUC.
Dimensional analysis and order of magnitude
estimates indicate that all terms of
the ZMB may be important at the
equator. Their relative importance however is likely to change with
depth and stratification,
so
that
it
may be possible to define distinct
dynamical regimes over various depth ranges. Models which incorporate
only some of the terms may then be representative of only some regimes.
lies in
the thermocline, dynamics such as those of the Charney's (1960)
constant density nonlinear model apply to the upper layers of the
cur-rent (within the relatively well mixed surface layer), while the
mech-anism of convergent equatorward flow, driven eastwards at the equator
where p,
is
no longer balanced by the Coriolis force, apply to the
lower layers imbedded in
the thermocline.
Before discussing the predictions of more elaborate models
in
section 1.6, we will first review actual observations of the
equa-torial ZPG (1.3) and, when possible, relate them to observations of the
meridional circulation and of the state of the EUC (1.4).
Since we are
interested in
the large scale zonal evolution of the EUC, we will be
more interested in
estimates of the large scale than of the local
equatorial ZPG.
1.3
Observations of the equatorial ZPG (or of the longitudinal
structure of the dynamic topography)
After an early discussion by Arthur (1960), measurements of
the ZPG have been reported, for the Pacific by Knauss (1966), Lemasson
and Piton (1968), Tsuchiya (1979), Meyers (1979), Halpern (1980),
Leetmaa and Spain (1981), Mangum and Hayes (1984), Bryden and Brady
(1985) and Lukas (1986), for the Atlantic by Katz et al. (1977), Lass
et al. (1983), Arnault (1984), Merle and Arnault (1985), Weisberg and
Weingartner (1986), Katz et al. (1986), and Hisard and Hlnin (1987),
for the Indian ocean by Taft and Knauss (1967) and Eriksen (1979). The
case of the Indian ocean will be considered separately in
the
follow-ing, because of the extraordinary seasonality of the wind system there.
In
both the equatorial Atlantic and Pacific oceans,
directly measured sea levels (e.g. from sea level gauges at Pacific
islands) are reported to be higher in
the west on average. An upward
slope of the thermocline to the east is
observed, consistent with an
upward slope of the sea surface to the west if
one assumes small
motions below the thermocline (two-layer approximation). Because of
located around 150 m in the central Pacific, around 75 m in the central
Atlantic, dynamic topography relative to a deeper level (typically
chosen between 500 db and 1000 db) is
likely to represent pressure
adequately, as long as one is
not concerned with the deep circulation.
Rebert et al. (1985) compared sea level gauge measurements to
hydro-graphic data at several locations within the tropical Pacific Ocean.
They checked that, between 15'N and 15'S, a
good correlation exists
between directly measured sea levels and the dynamic topography of the
sea surface relative to 400 m.
When referenced to a deep level, pressure indeed decreases
from west to east in
the western and central equatorial Atlantic and
Pacific. A typical order of magnitude for the surface ZPG force is
5
x 10 m s-2 (or equivalently 5 x 10- 5dyn g
1)
in
the central basin of
both oceans. The zonal slope however quickly flattens with depth as
mass readjusts baroclinicly. In
the Pacific ocean, Lemasson and Piton
(1968) show that, for the period November 1964 to March 1965, the slope
of the dynamic height anomaly relative to 700 db is
mostly flat at
200 db along the equator (Figure 2a). A similar result is
reported by
Knauss (1966) who presents dynamic height relative to 1000 db along
the equator for the May 1958 Dolphin Expedition. In
the Atlantic,
Merle and Arnault (1985) show similarly a vanishing slope at 200 m of the
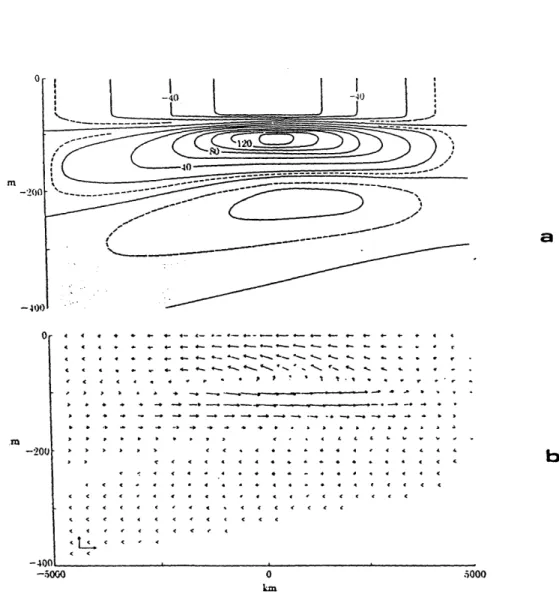
annual mean relative to 500 db averaged between 20N and 2S (Figure 2b).
These results indicate, in
agreement with local vertical profiles of
p
reported for instance by Arthur (1960), Mangum and Hayes (1984) and
Bryden and Brady (1985), that the ZPG becomes negligibly small shortly
below the core of the EUC, as reviewed also in
Weisberg and Weingartner
(1986). (Then, according to Arthur's simple steady linear stratified
model used at the end of section 1.2, the source for the eastward
momentum still present in
the region of no, or even slightly reversed,
ZPG below the thermocline can be just downward diffusion from the core
above).
Another feature apparent on the zonal sections of Figure 2
is
the eastern reversal of the surface ZPG, in
regions of southwest
90 W in
the Pacific]. This has been suspected of slowing down the EUC
(Knauss, 1966; Rinkel et al., 1966; Hisard, 1973). The reversal
how-ever does not appear to reach deep below the surface and, at the
levels of eastward flow, one sees more of a gradual decrease of the
slope with longitude than a sudden change at a given longitude.
1.3.1 Seasonal variations of the eguatorial ZPG in the Atlantic
Seasonal variations of the ZPG in connection with seasonal
variations of the zonal wind stress have been studied mostly in the
equatorial Atlantic, using data from global experiments such as GATE
(early to late summer 1974), FGGE (part of the Global Weather
Experi-ment, August 1978 to March 1980), and SEQUAL/FOCAL (fall 1982 to fall
1984).
Katz et al. (1977) analysed the GATE data and, combining
them with earlier observations from the experiments EQUALANT I
(March-April 1963) and EQUALANT II
(August-September 1963), found evidence for
a seasonal cycle of the ZPG in phase with the seasonal cycle of the
zonal wind stress,
i.e. minimum in
the spring when the ITCZ lies
clos-est to the equator, and maximum in
early fall, after the ITCZ migrated
to its northernmost location. The vertical integral of the ZPG, which
is
the quantity that one wishes to compare to the surface stress
(cf section 1.2), was approximated by the value of px at 50 db
(rela-tive to 500 db), i.e. close to the EUC core depth, multiplied by a
depth of 100 m; a linear fit was computed through the data points west
of 10'W, reducing the field of ZPG to one value, which was then
com-pared to a zonal average of the zonal wind stress. A similar analysis
was performed from the FGGE data, confirming the pattern of lower ZPG
in
the spring, higher ZPG in
the fall, and suggesting that these
varia-tions follow similar changes in
the wind stress by one to two months
(Lass et al., 1983). A longitudinal variation was also noted in
the
western and central parts of the basin,
attributed to a similar
longi-tudinal variation in
the wind, towards larger absolute values in
the
$ydE 96 186 76 16d 156 140 i3d 126 16 o06 96 edw 50 0 4 4 1 i L 3lie 34 73 $1? 4 U 1 11 32 1 1 4 11 4 321 1 1 .170 to ties Gilbert 1s0 Voes G abPa oS d b a 9O 50 db so 400db 20 --- 500 db .50 500db 6CDdb 3004 d 0 SURdhC too 90 SuRFACE 20 TSo-50 60 b *0 40 0 0 W 0. 4 C
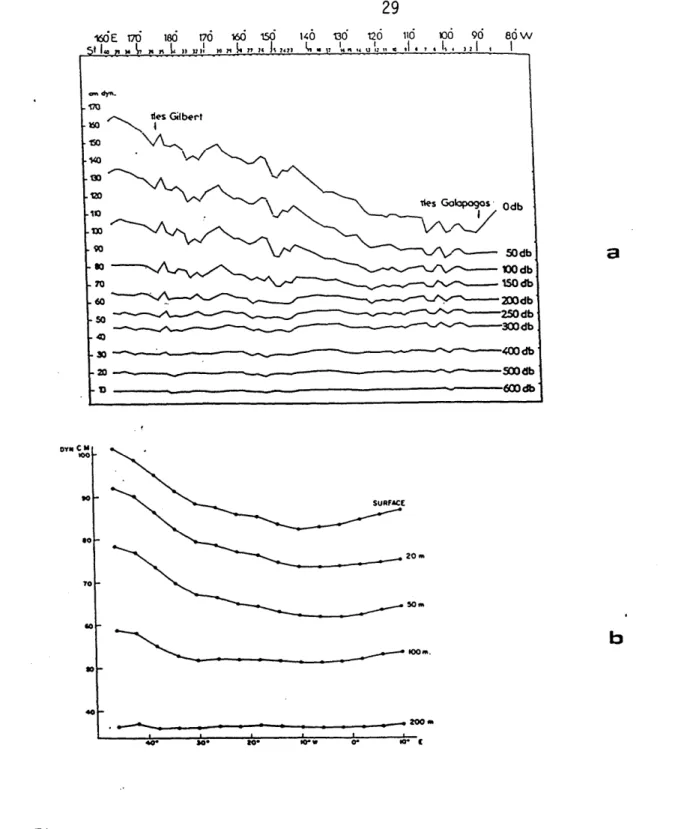
Figure 2: Equatorial sections of the dynamic topography (a) relative
to 700 db in the Pacific Ocean (November 1964-March 1965;
Lemasson and Piton, 1968); (b) relative to 500 db in the Atlantic Ocean (annual mean averaged between 20N and 2:S; Merle and
Arnault, 1985). Note that at mid-basin, the EUC core is found around 120 m in the Pacific, around 80 m in the Atlantic.
Results from the SEQUAL/FOCAL progam are presented in
three
papers. Katz et al. (1986) describe the variations in
sea surface
slope from combined measurements using hydrographic stations, pressure
gauges and inverted echo-sounders (Figure 3a). On a seasonal cycle
similar to the one observed before, an interannual variation is
super-imposed: during the boreal winter of 1983-1984, an almost complete
relaxation of eastward wind stress occurred in
the central basin,
accompanied by a levelling off of the sea surface to the west and a
strong rise against the African coast; through 1984, the zonal wind
stress remained lower than in
1983, with however a larger surface ZPG
west of the Gulf of Guinea. Ten to fifteen days was the estimated time
for the build up of the surface ZPG in
response to the onset of the
south-east winds.
Weisberg and Weingartner (1986) study how the sloping
iso-pycnal s reduce the surface
ZPG by computing time series of the heat
content
between the surface and various depths using moored temperature
data along the equator, and by forming zonal differences between pairs
of these time series, taking the risk of aliasing spatial into temporal
variations. According to their analysis, during periods of rapidly
changing easterlies, the differentiated heat content experiences a
rapid variation of one sign followed by a slow variation of the
oppo-site sign; their interpretation is that the variations "overshoot their
intended equilibrium and then gradually relax towards it". They also
argue that the baroclinic response is
zonally inhomogeneous and that
its vertical structure varies with time.
Finally, Hisard and Henin (1987) summarize measurements of
the ZPG at 0 and 50 db relative to 500 db from the hydrographic data.
The ZPG at 50 db is
seen to vary mostly in
phase with the surface
gradient, with, as expected, a
weaker slope at 50 db, except in
winter
1983 and, more strikingly, in
winter 1984, when the value at depth
exceeded the (lower than usual) surface value (Figure 3b). Unlike
con-tinuously sampled data from the echo-sounders or the moored temperature
sensors, these hydrographic data poorly resolve variations in time, and
the zonal differencing. However, Hisard and Hdnin argue that they
observe a lag of the order of two months between ZPG and t(x): ZPG
force at 23'W and easterly wind stress at 40"W are both maximum in
the
fall and they both weaken in
the winter, but the ZPG appears to reach
its minimum and to start building back up before the winds reach their
own minimum and reintensify. According to Katz et al. (1986), the
echo-sounder signal does not reproduce such an early reintensification
of the zonal slope in January 1984, but there is no echo-sounder data
to compare to the estimate from hydrography in
January 1983.
Hisard and H
4nin's interpretation of their data differs
from the interpretation published in
Katz et al. (1986): according to
Hisard and Henin, the maximum zonal slope and hence ZPG force estimated
from the 1983 hydrographic casts occured in
October (based on two data
points only) while, in
Katz et al., it
is
represented as occuring in
July, and being followed by a weaker value in
October in
agreement with
the echo-sounder signal.
However, Hisard and Hdnin's description of
their data is not
unlike Weisberg and Weingartner's "overshooting"
argument, and their observation of a larger zonal slope at depth than
at the surface in
winter 1983 and 1984 agrees with Weisberg and
Weingartner's suggestion that "subsurface gradients may not be in
phase
with those at the surface during a period of weak and variable winds".
The question of the time lag with the wind obviously requires some
clarification, as
not only do estimates of the date of the maximum
zonal slope differ, but also the onset date appears to vary with
longitude.
Hisard and Hinin also report measurements in the Gulf of
Guinea (eastern equatorial Atlantic), showing variations with time of
the intensity of the ZPG reversal and of its penetration at 50 db.
Previous estimates based on climatological hydrographic data are
pre-sented in
Arnault (1984) for each month of the year. East of about 5'W
in
February-March and in
September, when the westerly component of the
south-west monsoon is
most intense, the zonal slope of the equatorial
dynamic height field at various depths relative to 500 db exhibits its
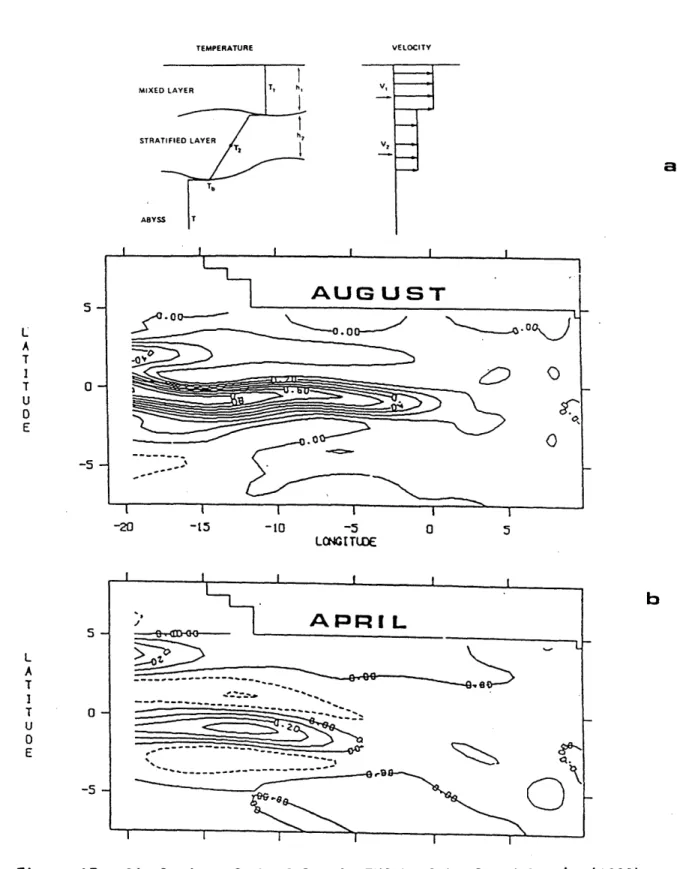
2) 100-J c 4 -28W E 0 20 W -C Io~w 0 19 -ZPG a yet - 2 dyn1g-01 -0.9 196s2 1983 184 -OzpO
Figur 3:Tm vouino zona prssr grdetetiae-ln
force - l pOdb
b
te23*WUC-
Fl.;. 2J~ ~'A'~~
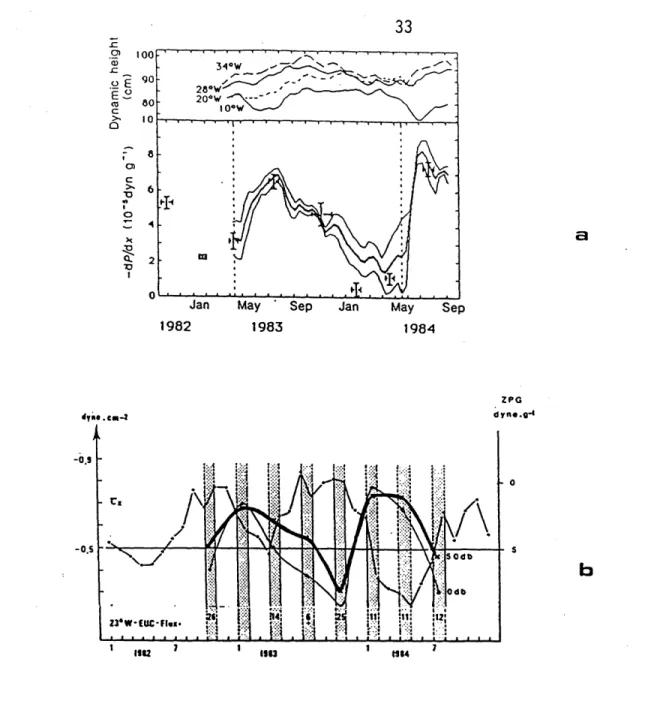
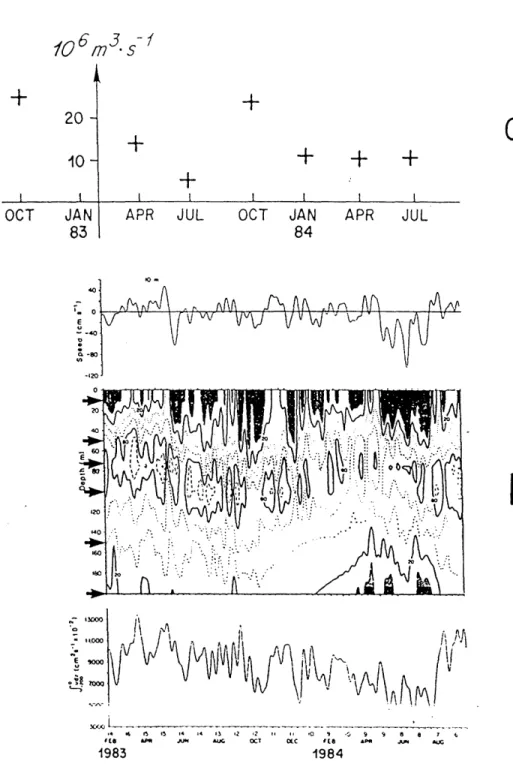
Figure 3: Time evolution of zonal pressure gradient estimates along
teequator
during SEQUAL/FOCAL.
a) Dynamic height (upper panel) and zonal
pressure
gradient
force -px (lower panel between 34.W and 10.W from four
inverted echo sounders.
Points with error bars are from the
hydrocast data (compare with b). Dashed lines indicate the time of onset of the southeast tradewind. (Katz et al., 1986).
b) Thick and thin continuous lines link the point estimates of the zonal pressure gradient +px at respectively 0-dbar and 50-dbar relative to 500 dbar deduced from the hydrographi c sections (compare with a). The interrupted line represents the monthly averaged zonal wind stress at 40OW during 1982-1984. Vertical dotted bands indicate the time of the cruises, and numbers at the bottom represent estimates of the EUC transport during these cruises. (Hisard and Henin, 1987).
of Guinea is
negative as it
is
in
the western and central basin. A
secondary minimum of the positive slope occurs in
winter.
Qualita-tively, such a sequence is
observed by Hisard and Hdnin between fall
1982
and summer
1983,
but
1984
shows a reversed cycle: an unusually
large eastern reversal of the otherwise negative zonal slope of dynamic
height during winter
1984, no reversal during spring 1984 and a
rever-sal similar to the one of fall 1982 in
summer 1984. Again, the signal
is not very well resolved in time and the quantitative determinations
of the zonal slope and of the longitude of the reversal are somewhat
subjective. Nevertheless these
results illustrate how the anomalous
character of 1984 was emphasized in
the eastern basin, where
substanti-ally warmer and more saline waters accumulated during the early months
of the year (Hisard et al., 1986).
In
summary, it
seems established that the ZPG field of the
central and eastern equatorial Atlantic ocean varies seasonally and
interannually in response to variations on similar time scales of the
zonal wind stress. However, the time lag between
the changes in
the
wind and those in the ZPG is not firmly established (estimates range
from one week to two months and opinions differ on what to use as a
measure of "the wind"), and there are indications that the baroclinic
mass adjustment varies in
time in
such a fashion that variations of
the ZPG at depth (in
particular at the levels of the EUC) do not
necessarily mimic those at the surface.
1.3.2 Seasonal variations of the eguatorial ZPG in
the Pacific
In
the huge equatorial Pacific basin, no observational
pro-gram has had both the zonal and temporal coverage necessary for a
reli-able determination of either the annual average or the seasonal
varia-tions of the ZPG as a function of depth and longitude. The closest to
a climatology of the sea surface slope is
given by Meyers (1979), who
studies the annual variation in the longitudinal structure of the depth
of the 140C-isotherm (located below the thermocline) as a proxy for
that of the depth of the thermocline itself, and argues that they
mir-ror adequately the changes in sea level in the central and western
portions of the basin (cf Wyrtki, 1984).
As seen on Figure 4a, the
zonal slope of the 14'C-isotherm is
steepest year-round between 170'W
and 110'W (in
reasonable agreement with the pattern of zonal
wind-stress with longitude of Figure 1). with larger positive values in
August to October, smaller positive values in
May to July and small
scale undulations between January and May. The amplitude of the
sea-sonal variations about the annual mean is
small however and does not
seem to reflect the semi-annual character of the local wind variations.
00
West of 170 W and east of 11OW, the slope is
less but experiences
larger seasonal changes and can reverse sign. Variations west of 170'W
are almost out of phase with those in
the central portion of the ocean,
but compatible with variations in
the local winds (Figure 1), with
maximum slopes in
May-June, negligible or slightly negative slopes in
October-December. East of 110'W, the maximum slope reversal takes
place between June and August, while positive values of the order of
the ones observed in
the center of the basin are found between December
and March. These eastern variations in
the depth of the 14'C-isotherm
may not mirror similar variations in
sea level and surface ZPG, but
again they are consistent with the variations in
local winds shown on
Figure 1. (Given the mixed character of the quantities compared, time
lags of a couple of months are probably not significant.)
In a direct study of the seasonal cycle of the equatorial ZPG in the easternmost Pacific (120'W-95*W; Tsuchiya, 1979), geopoten-tial anomalies with respect to 500 db are computed at 0, 50 and 100 db,
showing as expected a uniform decrease of the zonal gradients with
depth. Lower values in
the spring coincide with weak easterlies (or
westerlies) and higher values in
the summer with strong easterlies.
Zonal coverage however is
not very good and errors are large.
Halpern (1980) argues after Philander (1979) that
varia-tions in
the zonal slope of the Pacific thermocline should actually be
negligible on seasonal time scales and therefore computes a mean sur-face ZPG for the eastern equatorial Pacific using a single XBT section made between 23 April and 2 May 1979 from 153'W to 1107W along the
OASOMA OA11 KAWON ONGWAS G~AD4"A=
a
b
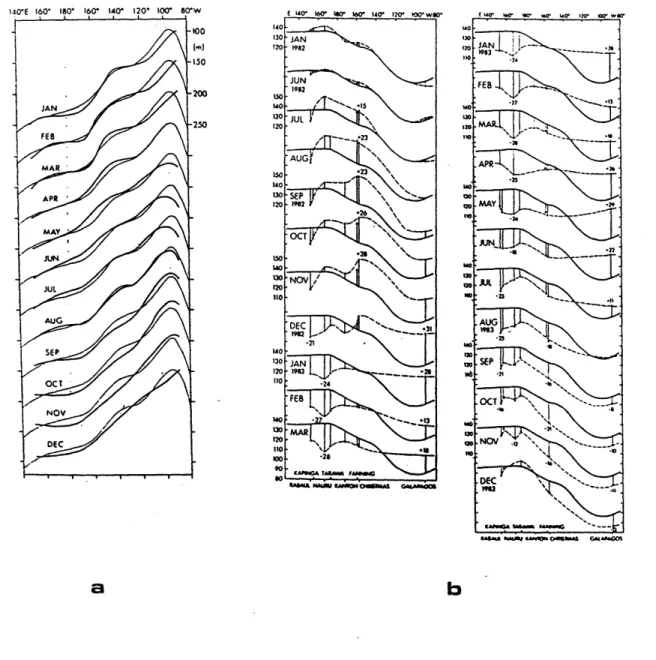
Figure 4: Indirect evidence of zonal pressure gradient variations
alopg the equator in the Pacific.
a) Seasonal scales: climatology of the depth of the 14'C
isotherm [annual mean (light line) and monthly means (heavy
lines)]. (Meyers, 1979).
b)
Interannual scales:
sea surface slope during the 1982-1983
El Ni~ro. Monthly values of directly observed sea level
devia-tions
(dashed lines) are superimposed on the main topography of
the sea surface relative to 500 db (continuous line) (Wyrtki, 1984).