Effect of False Alarm Rate on Pilot Use and Trust of Automation
Under Conditions of Simulated High Riskby
Deborah A. Cafarelli B.A., Physics North Central College, 1986
B.S., Electrical Engineering Northwestern University, 1987
Submitted to the Department of Aeronautics and Astronautics in Partial Fulfillment of the Requirements for the Degree of
Master of Science at the
Massachusetts Institute of Technology September 1998
©) 1998 Deborah A. Cafarelli All rights reserved
The author hereby grants to MIT permission to reproduce and to distribute publicly paper and electronic copies of this thesis document in whole or in part
Signature of Author ... ... ...
Department Aeronautics and Astronautics August 14, 1998
Certified
by ...
.
...
...
. ...
R. John Hansman, Jr. Professor of Aeronautics and Astronautics Thesis Supervisor Accepted by ... ... ... ...
Jaime Peraire Associate Professor of Aeronautics and Astronautics
Chair, Department Graduate Committee HaftN&EI MASSACHUSETTS INSTITUTE OF TECHNOLOGY P 2 2 Z1198( I
Effect of False Alarm Rate on Pilot Use and Trust of Automation
Under Conditions of Simulated High Risk
by
Deborah A. Cafarelli
Submitted to the Department of Aeronautics anJ Astronautics on August 14, 1998 in Partial Fulfillment of the
Requirements for the Degree of
Master of Science in Aeronautics and Astronautics
ABSTRACT
An experimental study was conducted to investigate the relationships between
automation false alarm rate, human trust in automation, and human use of automation, specifically under conditions of simulated high risk. The experiment involved military pilots flying combat and non-combat missions while employing a missile warning sensor with two levels of automation. The experiment was performed in a high fidelity F- 16 simulator with U.S. Air Force F-16 pilots as test subjects. Three sensor false alarm rates were tested. The results showed that the level of missile warning sensor automation preferred by the pilots was strongly dependent on the false alarm rate of the automation. The data demonstrated that as false alarm rate increased, pilot trust of the missile warning sensor decreased, resulting in the pilot preferring a lower level of automation. However, the results also showed that even when pilots expressed little trust in the system, they preferred to use some level of automation rather than turn the system off. This result was attributed to the cost/benefit tradeoff of using the automation, as well as the extreme difficulty and hazard associated with the task. Analysis of the pilot mean reaction time in response to a missile warning sensor alert showed that reaction time increased as the false alarm rate increased, although this effect appeared to be less significant the higher the false alarm rate. Missile hit data indicated that as false alarm rate increased, the number of missiles that hit the pilot's aircraft also increased, demonstrating a degradation in pilot survivability. Missile hit results also indicated that using a higher level of automation improved pilot survivability for the scenarios tested.
Thesis Supervisor: R. John Hansman, Jr.
Acknowledgements
This study was funded by the United States Air Force (USAF) Common Missile Warning System (CMWS) program office (ASC/LNWP). The author would like to thank Lt Col Gregg Sparks and Mr. Pat Roberts of the CMWS program office for the tremendous opportunity to conduct this research. Thanks also go to Majors Mike Stuart and Gary Plumb of the F-1 6 program office (ASC/YPR4) for their support in obtaining F-16 simulator time as well as highly qualified pilot subjects. Mr. Manny Tapia, Mr. Tony Boren, and Mr. Cliff Foster of Lockheed Martin Tactical Aircraft Systems (LMTAS) facilitated the use of the LMTAS F-16 simulator, and their experience and experimental insight were invaluable to the execution of this experiment. Finally, my deepest gratitude goes to my husband, Sergio Cafarelli, for his help with computer processing, and for all his patience, love, and understanding.
Table of Contents
A bstract ... 3Acknowledgments
...
Table of Contents ... 7 Acronyms ... 8 1. Introduction ... 9 2. Background ... 11 2. Previous Research ... 11 2.2 System Example ... 122.2.1 Automation Used Under Conditions of High Risk ... 12
2.2.2 General Description of a Missile Warning Sensor ... 13
2.2.3 Description of Specific Missile Warning Sensor Used in this Study ... 15
2.2.4 Probability of False Alarm vs. False Alarm Rate ... 18
2.2.5 Prediction of the Effects of Varying False Alarm Rate ... 20
3. Experiment Description ... 22
3.1 Objectives ... 22
3.2 Methodology and Procedures ... 22
3.2.1 Experiment Design and Test Matrix ... 22
3.2.1.1 Description of Runs ... 33
3.2.1.1.1 Training Run ... 33
3.2.1.1.2 Combat Run ... 34
3.2.1.2 Profiles ... 36
3.2.2 Data Measures ... 37
3.3 Equipment and Materials ... 38
3.4 Experimental Protocol ... 38
4. Data Analysis and Results ... 41
4.1 Subjects ... 41
4.2 Subjective Measures ... ... 41... 41
4.3 Objective Measures ... ... 5...
5. Conclusions ... 57
References
...
59
Appendix A. Missile & False Alarm Times/Aspect Angles Used in Simulator Profiles..60
Acronyms
AHP Analytical Hierarchy Process
CDS Concept Development Simulator
CMWS Common Missile Warning Sensor
EWS early warning sensor
FA false alarm
HUD head-up display
IR infrared
IP initial point
JND just noticeable difference
LMTAS Lockheed Martin Tactical Aircraft Systems
MFD multi-function display
MWS missile warning sensor
PFAS possible false alarm source
RWR radar warning receiver
SA-xx surface-to-air missile
USAF United States Air Force
1. INTRODUCTION
With today's rapid advancements in technology, the use of automation in system design is increasing at a tremendous rate. Technical issues dominate most of the writing on automation technology, such as how automation functions are implemented, and the characteristics of the associated sensors, controls, and software (Parasuraman and Riley,
1997). Unfortunately, the ability to address human performance issues systematically in design and training has lagged behind the application of automation, and issues have come to light as a result of human casualties.
An investigation into the 1987 collision between an Amtrack passenger train and a Conrail freight train near Baltimore revealed that a warning system designed to alert the Conrail crew when they violated speed limits or track clearances did not sound. The alarm did not sound because the train operators had taped over the alarm buzzer to disable it due to the high rate of false alarms. Despite the publicity surrounding this accident, a later investigation uncovered six other disabled alarm buzzers in other trains, even after the operators had been given twenty-four hours' notice of an inspection (Sorkin, 1988).
During the Viet Nam War, many of the aircraft flown, such as the F-4 and A-7, were equipped with missile warning sensors to help protect the pilot from enemy missiles and anti-aircraft artillery. Interviews with aircrew who flew combat missions in Viet Nam indicate that pilots often flew combat missions with these sensors either turned off, or with the volume turned so low it was inaudible, due to the high false alarm rate of the sensors. They complained that the audio alert was distracting, and interfered with them hearing critical radio communications. Even as recently as the Desert Storm conflict in Iraq, aircrews were still turning off their missile warning sensors due to the intolerable number of false alarms. Anecdotal reports indicate that a number of the casualties suffered during this war were either directly or indirectly related to the fact that aircrews had their alerting systems turned off, and hence, had no warning of the missiles that eventually hit their aircraft.
Based on these experiences, the military is spending a significant amount of effort on reducing the false alarm rates of new and upgraded missile warning systems, as well as in improving the levels of automation designed into these systems. Few studies have been performed which focus on how high risk can affect an operator's decision to use or not use automation. As automation becomes more sophisticated and is given more authority in the operation of complex systems, it is likely that it will play an increasingly prominent role in future incidents such as the ones mentioned above. Therefore, it is important to understand why people choose to use or not use automation under conditions of high risk in order to design future systems which avoid the consequences of autor 'on disuse seen in the past.
2. BACKGROUND
2.1 Preyvious Research
Most of the previous research which has been conducted regarding the relationships between false alarm rate (reliability) and trust and use of automation has been performed in the human psychology domain (Riley, 1994). Some of these results, as well as what exists in the human-machine interaction domain, are summarized below.
Sheridan and Farrell (1974) expressed concern about the changing roles of automation and operators, and included the operator's trust in the automation as one of the four fundamental elements of the operator's role. Muir (1989) conducted experiments demonstrating that operator trust in automation could be measured using a subjective scale, and that a subjective measure of trust in a component correlated with the operator's use of that component. Muir's work ( 1987) led him to hypothesize that machine
behaviors must be observable for trust to grow, and that as trust develops, operators will tend to reduce the amount of sampling (checking the machine's performance). Lee (1992) continued the investigation of trust in supervisory process control, and provided support for the relationship between automation reliability and trust in the automation, as well as the relationship between trust and automation use.
Riley (1994) investigated how operator trust and automation reliability affected the use of automation. He defined trust and reliability in the following way:
* Trust is defined as the operator's subjective estimate of the probability that the automation will be correct in the next action or decision it makes.
* Automation reliability is defined as the actual probability that the automation will be correct in its next action or decision.
Based on these definitions, Riley formulated the following hypotheses to be tested:
* Reliance on automation will increase with greater trust (or decrease with lo wer trust).
* Reliance on automation will increase with greater automation reliability (or decrease with lower automation reliability).
* Trust will increase with greater automation reliability (or decrease with lower reliability)
Riley's results provided support for the hypothesized interrelationships between
automation reliability, trust in automation, and use of automation. His research indicated that both reliability and trust could have a strong influence on use of automation. His results also suggested that very large individual differences exist regarding automation use decisions and the reasoning behind those decisions. It appeared that while there may be numerous factors affecting automation use decisions, people tend to only focus on a small subset of these factors, leading to wide variation among individuals in how and why they use automation. This implied that large samples of subjects are necessary in automation studies to ensure adequate statistical significance.
2.2 System Example
2.2.1 Automation Used under Conditions of High Risk
Very few studies have focussed on how high risk can affect the use of automation. Riley (1994) demonstrated that risk may influence automation use decisions, with less reliance on automation when the possible consequence of errors is more severe and the
automation has proven itself to be unreliable. However, Riley's study was based on a computer categorization game, and did not attempt to simulate a high-risk, operational scenario. An interesting dilemma which humans often face in such scenarios is that
automation could just as well aid in their survival, as put them, or others, at a greater risk of death.
Recent studies have shown that different individuals are susceptible to different types of factors influencing their trust and use of automation. Riley (1994) suggested that an individual's automation use decisions may be influenced by a very small number of factors represented by a subset of the general theory, and different individuals are
influenced by different factors. For example, those subjects who indicated high levels of self confidence in doing the computer task in one of Riley's experiments used the
automation very little in that experiment. These results suggest that the circumstances under which automation is used will affect individuals' trust and use of automation, depending on which factors influence the subjects, and the subjects' individual biases. Based on this premise, it appears that few studies investigating automation use could be applied very far beyond the basic circumstances in which the data was obtained. Many studies should be done and then compared in order to find global trends, if such trends exist. The aim of this study was to look at a specific, high risk, military combat
environment, and observe how individuals alter their trust and use of automation as the reliability of the automation is varied.
With the increasing complexity of cockpit instruments and displays, a significant amount of effort is spent developing highly technical automation to assist the military pilot in performing mission functions. One such function is keeping a lookout for enemy missiles that would threaten the pilot and his aircraft. Various missile warning sensors have been designed to help protect the pilot from these threats by alerting him to their presence in order for him to take appropriate action. The conditions under which missile warning sensors are used satisfies the high risk environment desired for this study.
2.2.2 General Description of Missile Warning System
Missile warning sensors (MWSs) detect missile targets by passively collecting signal energy from the missile. This energy could be in the RADAR, infrared (IR), ultraviolet
(UV), or other spectral region. Typically, RADAR energy comes from the guidance control of a RADAR guided missile. IR energy can come from any part of the missile, including the hard body of the missile or the missile exhaust plume. UV energy comes from the missile exhaust plume.
Some alerting systems have higher levels of automation, and are tied into the countermeasure dispense systems of the aircraft. In this case, one or more levels of automation are represented by the MWS, and additional levels represented by the countermeasure dispense system. Countermeasure dispense systems control the release of projectiles (called countermeasures) around the aircraft in order to decoy enemy missiles away from the aircraft. Missiles target and track aircraft in some of the same spectral regions that MWS systems operate. Very hot projectiles, called flares, are the type of countermeasure commonly used to decoy missiles tracking the aircraft in the IR or UV spectrums. Clouds of thousands of tiny foil-like particles, called chaff, are the type of countermeasure commonly used to decoy missiles tracking the aircraft with RADAR.
Regardless of which spectral region the MWS uses to detect the missile, detection is, in part, based on the energy surpassing a threshold level. The threshold level is designed to help the MWS discriminate the missile from other sources of energy in the spectral band which could appear as targets to the MWS. Examples of other sources which the MWS might detect include airfield and city lights, bomb explosions, and aircraft afterburning engines. If these sources were to exceed the threshold of an MWS, they would trigger a warning. Since these sources are not missiles, the warning would be considered a false alarm. Therefore, the choice of the threshold is critical to the reliability of the sensor, as it determines the sensor's detection and false alarm rates. Adjusting the threshold is always a tradeoff, as raising it will reduce false alarms, but it will also lower the
probability of detection of actual threats. Likewise, lowering the threshold will increase the probability of detection, but it will also increase the false alarm rate.
Previous missile warning sensors in the spectral bands mentioned above have been plagued by high false alarm rates; therefore, it is no surprise that the performance history of these types of sensors, in both operational and training scenarios, reveals pilot
reluctance to trust or use this kind of automation. Considering the high cost to develop and field these systems, as well as the high risk environment for which this type of automation is designed, it seems that further investigation into how reliability influences a pilot's decision to use or not use missile warning sensors would be a useful first step in understanding automation use in high risk environments.
2.2.3 Description of Specific MWS Used in this Study
For this study, an MWS currently under development by the Air Force served as an example of missile warning automation. The MWS had two levels of automation: automatic (auto) and semi-automatic (semi) in addition to the option of turning it off. In the auto mode, the system detected the threat, alerted the pilot, and dispensed
countermeasures without any pilot action. In the semi mode, the system detected the threat and alerted the pilot; however, dispensing of countermeasures required the pilot to consent by activating a switch. In the off mode, the system did nothing.
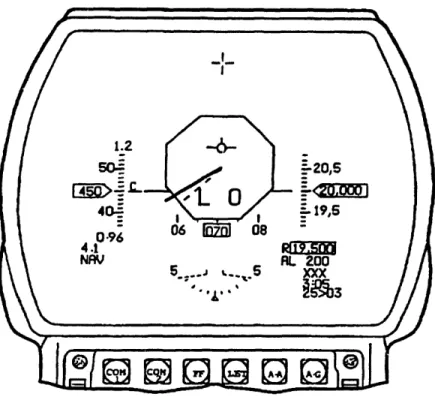
Figure 2.1 shows the head-up display (HUD) symbology that was planned for the MWS under development. The octagon in the center of the display was the main visual cue that the MWS had detected a missile that it considered a threat to the aircraft. The direction from which the highest priority missile was approaching was depicted with a solid line originating from the center of the octagon, representing a God's-eye view. Dashed lines represented any secondary threats, if they existed. Information about the threat missile's elevation was conveyed by a text message within the octagon. If the elevation of the missile was greater than five degrees above the horizon, the text "HI" was shown in the upper half of the octagon. If the elevation of the missile was greater than five degrees below the horizon, the text "LO" was shown in the lower half of the octagon. If the elevation was within five degrees of the horizon, no text message was displayed. All
Figure 2.1. MWS HUD Symbology.
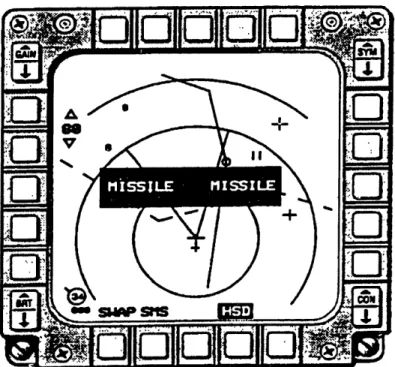
Figure 2.2 shows the MWS symbology planned for the multi-function display (MFD). The text message "Missile Missile" was displayed on the MFD when a missile was detected and classified as a threat to the aircraft by the MWS. The purpose of this
symbology was to ensure that the pilot was alerted visually of a missile threat, even when he was head-down (looking at the MFD). All other symbology shown in Figure 2.2 did not relate to the MWS.
Aural warnings were also generated by the MWS. A four part voice message contained a warning call, missile azimuth (relative to the nose of the aircraft), missile elevation (relative to the horizon), and a countermeasure dispense advisory, if the MWS was in semi mode. A "missile" call was made for any missile threat, priority or secondary. A
Figure 2.2. MWS Text Warning on MFD.
"nose" call was made for threats within 20 degrees of the nose, and a "tail" call was made for threats within 20 degrees of the tail. A "right" call was made for a priority threat 20 to 160 degrees relative azimuth, and a "left" call was made for a priority threat of 200 to 340 degrees relative azimuth. A "lo" call was made for threats greater than five degrees below the horizon, and a "hi" call was made for threats greater than five degrees above the horizon. A "level" call was made for threats within five degrees of the horizon. A "counter" call was made for all threats when the MWS was in the semi-automatic mode. An example message for a missile that approached from the right wing more than five degrees below the horizon in semi-automatic mode was, "Missile, Right, Low, Counter." Table 2.1 summarizes the voice messages generated by the MWS.
Table 2.1. MWS Voice Messages
2.2.4 Probability of False Alarm vs. False Alarm Rate
Automation reliability, as defined earlier, is the actual probability that the automation will be correct in its next action or decision. When considering single-stage alerting systems, automation reliability can be broken down into 4 possible outcomes: correct detection
(true-positive), missed detection (false-negative), false alarm (false-positive), and correct rejection (true-negative). The outcome is based in part on the system threshold level chosen. As mentioned in section 2.2.2, the false alarm rate of a system can be decreased by raising the threshold of an alerting system; however, by doing so, the probability of correct detection will also be decreased. Kuchar and Hansman (1995) discuss alerting threshold issues in greater detail.
Description Voice Message Definition
Warning Call MISSILE Warning for priority and secondary threats.
Direction NOSE Within 20 deg. of nose
(Priority Threat Only) TAIL Within 20 deg. of tail RIGHT Within 70 deg. of 3 o'clock
LEFT Within 70 deg. of 9 o'clock
Elevation HIGH > 5 deg. above horizon
(Priority Threat Only) LEVEL Within 5 deg. of horizon
LOW > 5 deg. below horizon
Dispense Advisory COUNTER Request for consent to
This study focussed primarily on false alarm (false-positive) rate. The relationship between false alarm (FA) rate and probability of FA was first examined. Probability of false alarm can be defined as
NFA
Probability of FA =
NPFAS
where NFA is the number of false alarms, and NpFAS is the number of times the sensor encounters a possible false alarm source (PFAS). FA rate is the number of false alarms per unit time.
FA rate
NFA
Unit Time
FA rate can be related to probability of FA by dividing it by the FA exposure rate, which is the number of total encounters, NPFAS, per unit time:
FA rate NPFAS / Unit Time
FA rate
NFA / Unit Time NpFAS / Unit Time
NFA NPFAS = Probability of FA = Probability ofFA x NPFAS Unit Time
Military specifications concerning MWS false alarms are typically expressed as FA rates. The reason for this is because FA rate is a testable parameter. Determination of the probability of false alarm would require specific information on the probability of
encounters with possible false alarm sources (PFASs). This type of information is dependent on the geographic region of a particular theater of operation. Due to the dynamic nature of industrial and urban expansion, which influence the number of PFASs located in a particular region, current figures concerning the probability of PFAS
encounter are not always readily available, if available at all. This makes it extremely difficult to measure probability of false alarm.
While the FA rate will most definitely be affected by the theater of operation, it is a parameter which can be adequately measured by specifying an environment in which to test. Relevant mission scenarios can be developed over specified terrain, and the false alarm rate measured without knowing exactly how many sources are actually present. Measuring the probability of false alarm of a system requires knowledge about the world which is difficult to obtain or keep current, whereas measuring FA rate has no such requirement. Therefore, for the purpose of this research, the effects of FA rate were studied instead of those of probability of false alarm.
2.2.5 Prediction of the Effects of Varying False Alarm Rate
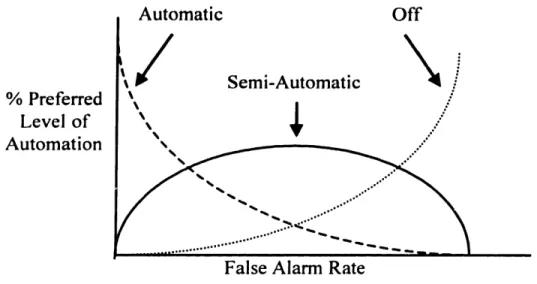
The hypotheses concerning the interrelationships between false alarm rate (reliability), trust in automation, and automation use that were outlined by Riley and discussed in section 2.1 were investigated under conditions of simulated high risk. A hypothetical relationship between preferred level of automation and false alarm (FA) rate is shown in Figure 2.3 below. The three curves represent trend estimates of the percentage of pilots that would prefer each of the two MWS levels of automation, in addition to the option of turning the sensor off, versus varying FA rates. Based on Riley's results (1994), it was
expected that if the FA rate of the system were very low, pilots would have a higher trust in the system; hence, more pilots would run the MWS in the automatic mode. As FA rate increases, Riley's work suggested that pilots would switch from the automatic mode to the semi-automatic mode, and eventually at some FA rate, would turn the system off
Effect of False Alarm Rate on Preferred Level of Automation
% Preferred
Level of
AutomationFalse Alarm Rate
Figure 2.3. Hypothetical Relationship False Alarm Rate
of Preferred Level of Automation vs.
completely. The actual shapes of these curves were not known; therefore, the trends shown in the figure were rough estimates.
In addition to the effects of FA rate on trust and use of automation, the effects of FA rate on human reaction time was also studied. An increase in FA rate was expected to cause a decrease in pilot trust, as mentioned previously. Based on this decrease in trust, it was predicted that the reaction time would increase, due to the pilot spending more time evaluating the validity of the MWS warning. Consequently, an additional hypothesis that was tested was the following:
* Human reaction time to automation warnings will decrease with greater automation reliability (or increase with lower reliability)
3 EXPERIMENT DESCRIPTION
3.1 Objectives
The primary objectives of this project were to study the effects of FA rate (reliability) on pilot trust and automation use, as well as how pilot trust and automation use interrelate.
While it has been documented that as false alarm rate increases, operator trust and use of a system often decreases, this research sought to extend our understanding of this factor to simulated high-risk operational scenarios.
3.2 Methodology and Procedures
3.2.1 Experiment Design and Test Matrix
The experiment consisted of multiple simulator tasks, conducted in one of the Lockheed Martin Tactical Aircraft Systems (LMTAS) high fidelity F-16 simulators at the
company's plant in Ft Worth, TX. Subjective data was obtained through a series of surveys. Objective data was obtained by measuring pilot inputs to the simulator.
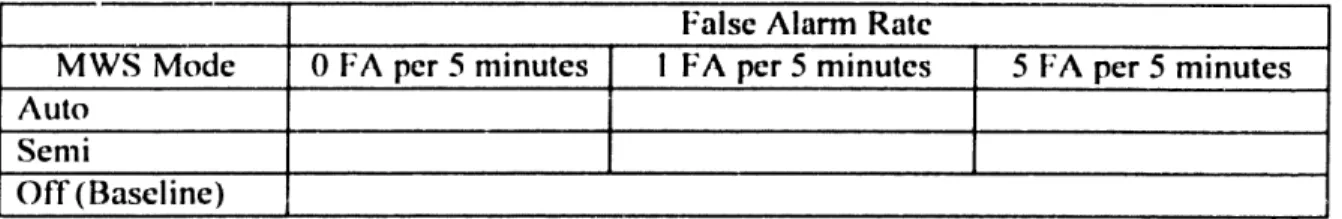
Table 3.1 shows the experiment test matrix that was developed for the simulator study. It includes two levels of MWS automation (auto and semi) as well as off (used as a baseline to represent using no MWS sensor), and three different false alarm rates. The table does not include any training runs. The just noticeable difference (JND) that pilots would be able to discern between various false alarm rates was unknown at the time of experiment planning. Consequently, the values picked for testing were estimates, attempting to ensure pilot differentiation between rates, while at the same time representing three major quality levels of sensors: a perfect sensor, an intermediate sensor, and a poor sensor.
The 0 FA per 5 minutes rate represented a perfect sensor. Compared to 0 FA per 5 minutes, even one false alarm per 5 minutes was thought to be a noticeable difference;
Table 1. E ,periment Test Matrix
False Alarm Rate
MWS Mode 0 FA per 5 minutes I FA per 5 minutes 5 FA per 5 minutes Auto
Semi
Off (Baseline)
sensor with poor performance, based on discussions with numerous military pilots, as well as testers of previous alerting systems. In the experiment, the number of real threats that were presented to the pilot in each run was always five. The number of false alarms that were presented to the pilots varied from zero to one to five per five minutes to achieve the desired false alarm rates listed.
The simulator tasks consisted of operational flight scenarios in which pilots flew multiple missions, or runs, over a specific hostile threat area. Real missile threats as well as false alarms were simulated, triggering the MWS system to declare a tlreat to the aircraft, and. if the sensor was in auto mode, to dispense countermeasures. In either auto or semi mode, the pilot was able to dispense countermeasures by activating a flare consent switch on the aircraft's control stick. All the MWS functions, displays and switchology
described in section 2.2.3 were modeled in the simulator.
The pilots were told that three different sensors were modeled in the simulator, each one having different performance characteristics. They were asked to evaluate the overall usefulness of each sensor system. For motivational purposes, the pilots were told they would be scored on their performance in the simulator. An overview of the experiment and procedures were summarized in a one-page experiment brief, which is reproduced in
Figure 3.1, Pilot Experiment Brief.
Each pilot completed a total of 10 five-minute runs. The first run was always flown with the MWS system off to represent flying without the use of an MWS sensor. This run served as a baseline measure of pilot performance and reaction to the threat scenario.
Experiment Brief
I. We have tried to simulate 3 different combinations of CMWS system performance
characteristics that represent various examples of quality versus cost tradeoffs. In the following
simulator runs, the performance of CMWS will not be perfect, i.e. it may have deficiencies such
as false alarms, etc. We would like you to evaluate the overall usefulness of each system.
Note: The CMWS sensor is still under development, and the actual performance characteristics
are unknown at this time. The performances of the CMWS sensors you will experience today
are theoretical, and none of them should be misinterpreted as the actual system performance
characteristics.
2. For each system, you will fly a brief training mission over friendly territory (no threats) to
become familiar with the qualities ofthat particular system, followed by 2 short (approx. 5
minutes each) missions into a threat area. One of the threat missions will be flown with CMWS in the auto mode and one will be flowni with CMWS in the semi mode. You will be told which
CMWS mode to use for each mission -it is important that you use this mode and DO NOT switch the mode during the flight.
3. You will be given a mission brief explaining the details of your mission (background, objective, aircraft configuration, etc.) which will be the same for each run. In the simulation, you will be able to see and destroy your target, as well as be hit by enemy missiles. If a missile hits you, the entire screen will flash red for 1-2 seconds, then allow you to continue the nrun.
Your overall objectives will be (in order of priority):
-- To survive flying through the threat area (incur the least number of hits)
-- To achieve the mission objective
-- To return with the maximum flares possible
You will be scored.
4. You will be asked to complete a short survey (see Attachment 1: Pilot Sensor Survey)
concerning each sensor after all the runs (3) with that particular sensor. At the completion of all the runs (10) you will be asked to fill out a second survey which has two parts (see Attachment
2: Pilot Experience/Sensor Paired Comparison. The first part asks some general questions
regarding your flying experience to date, and the second part is a "paired comparison" in which
you will evaluate two of the sensors side-by-side for all combinations of pairs (6).
5. If you have any questions about what you have read so far, please ask them now. Once you
have no further questions, please continue by reading the Mission Brief.
i __
Following the baseline run, three different MWS false alarm rates were presented to the pilot subjects as different "sensors," each with "unique performance characteristics." The pilot flew 3 runs with each FA rate. The first run with a particular FA rate was always a training run, simulating a peacetime training mission, during which no simulated missile threats were launched. The training run was immediately followed by two combat runs with that FA rate, one in automatic, one in semi-automatic. In order to maintain control of the experiment, the pilot was told which MWS mode to use for each run, and was not allowed to switch modes during a run. Further explanation of the different types of runs is described later in section 3.2.1 .1, Description of Runs.
Following the completion of all three runs of a particular false alarm rate, one training, one in automatic mode, and one in semi-automatic mode, the pilot was asked to fill out a survey regarding the MWS just flown. The purpose of the survey was to determine what level of trust the pilot had in that particular system as well as how he would use the system if given the choice. his questionnaire is reproduced in Figure 3.2, Pilot Sensor Survey. One of the questions in the Pilot Sensor Survey required the pilot to refer to a Modified Cooper-Harper Rating Scale for Use, shown in Figure 3.3. This rating scale was developed for this experiment to help pilots better quantify their evaluations of use.
At the conclusion of all 10 runs, the pilot was asked to complete a second survey. This survey was comprised of two parts. The first part asked for information concerning the pilot's experience, in order to identify and document information that might be pertinent to the study, such as flying experience, predisposition to automation, etc. The second part was a paired comparison survey, the purpose of which was to determine the levels of preference between the 3 different false alarm rates, represented by the three sensors. This survey IS reproduced in Figures 3.4, Pilot Experience Survey, and 3.5, Paired Comparison Survey.
Attachment I
Pilot Sensor Survey
Name:
1. How much trust do you have in
box under appropriate response.)
the CMWS version you just used? (Place X in
2. Under similar conditions in the real world, I would prefer to fly with this CMWS system in the following mode (Pick one):
] Auto
O Semi
O
off3. Modified Cooper Harper Rating (see diagram next page):
-4. Comments:
I would I would I would I would I would
Never Rarely Sometimes Often Always
Modified Cooper Harper Survey of Use
Pilot compensation not a factor for desired performance Excellent - Pilot compensation not a factor Highly Desireable for desired performance Good
-Negligible Deficiencies
Fair -Some Minimal pilot compensation mildly unpleasant required for desired performance deficiencies 3 Yes Is t useable Deficiencies without No warrant improveme nt improvement Yes
Is the syste Deficiencies
useable with a No
tolerable pilot improvements
e s
s the
system No Improvement
useable (does it Mandatory
mitigate
any risk
Desired Perform
Pilot Adequate Perforr
Decisions
Minor but annoying Desired performance requires deficiencies moderate pilot compensation 4 Moderately Adequate performance requires objectionable considerable pilot compensation 5 deficiencies
Very objectionable Adequate performance requires but tolerable extensive pilot compensation 6 deficiencies
Adequate performance not attainable with max tolerable
Major deficiencies pilot compensation. Risk 7 mitigation not in question
Considerable pilot compensation, Major deficiencies i.e. search effort, is required for 8
minimal risk mitigation Intense pilot compensation, i.e. Major deficiencies search effort, is required for 9
minimal risk mitigation
The system would not
Major deficiencies be used under any circumstances 0
ance = Would use 100% of the time in a threat area.
nance - Would use 50-99% of the time in a threat area.
on = Search Effort
Figure 3.3. Diagram used for Question #3 of Pilot Sensor Survey.
I
- 2
Attachment 2
Pilot Experience/Paired Comparison Survey
Name: Work Address:
Work Phone:
i. Please list all military aircraft flown, and total flight hours in each aircraft.
Aircraft Total Hours
2. Do you have combat experience in any aircraft? If so, please list conflict, aircraft flown, and number of hours.
Conflict Aircraft Total Hours
3. Have you ever had enemy threat missiles fired at you, or seen any fired at other aircraft? If so, please describe events, if possible (unclassified only).
4. Do you have any experience with missile warning sensors, and if so, please place an X in the appropriate box below:
I would I would I would I would I would
Never Rarely Sometimes Often Always
trust them trust them trust them trust them trust them
5.
Plaels=n=pcaizdfih=riig
~.
ihe epn colTs
io col e
5. Please list any specialized flight training, i.e. Fighter Weapons School, Test Pilot School, Red
Flag, etc.
6. Comments:
. .. .. _
---7. Please place an X in the appropriate box below for each paired sensor comparison. No Sensor better Sensor A better
1
Ir
I
i I ! i I I i ! u ' ! I ! ' i I ..I i S °r-Sensor Ahulelv m-h much1T better Ightiv same ruchlv H better I I much I ah-sotelvI
better etter bter better better bett h er
No Sensor better Sensor B better
No I I I I I I I I Sensor
|Sensor I I I I I I I I| I I I I I I I Isor |
ahbolutel4 mu h better sightl same sIthll hetter much ahbslutel'
better hbetter better te hetter hette
No Sensor better Sensor C better I I
No I I Sensor
S e nsor
|I I I I I 1 I I I I I I i I I i C
ahbolutcly much better sdightv same sightly better much absolutcl. b etter better better ber tbeter better
Sensor A better Sensor B better
Sensor
I
I I
I S e n sorabsolutelv much better slightly same shghtly better much absolutelv
better ber eter bater better better
Sensor A better Sensor C better
Sensor Sensor
absolutely much better sltghtly same slightly better much absolutely better better better better betner better
Sensor B better Sensor C better
Sensor I 1 I I I I I I I I I I I 1 I SensorS
B I I I I I I I I I I I I I
absolutely much
better better better slightlybetter slightlybetter
better much absolutely
better better
Figure 3.5. Paired Comparison Survey
-i
I
In order to offset any bias created by the order in which the pilots were exposed to the various test matrix blocks, the pilots were divided into four groups, with each group progressing through the matrix in a different order. Based on good counterbalancing design, the ideal number of pilots desired for this experiment was multiples of four, in order to divide them evenly into the groups. Listed below is a description of' the four groups. The order of runs for all four groups is listed in Table 3.2.
Group A - Trust decaying/Auto. This group started in the auto mode with the best FA rate (O FA/5 min.) and experienced progressively worse FA rates.
Group B - Trust decaying/Semi. This group started in the semi mode with the best FA rate (O FA/5 min.) and experienced progressively worse FA rates.
Group C - Trust improving/Auto. This group started in the auto mode with the worst FA rate (5 FA/5 min.) and experienced progressively better FA rates.
Group D - Trust improving/Semi. This group started in the semi mode with the worst FA rate (5 FA/5 min.) and experienced progressively better FA rates.
It was important, for the purposes of this study, that the pilot was able to distinguish a false alarm from a real threat. In reality, a pilot might be able to visually verify missiles shot at his own aircraft; however, it would be more likely that his wingman would spot one fired at him first. The visuals were limited in the simulator, since there was a screen only in front of the cockpit, not to the sides or the rear, making visual verification
difficult, if not impossible, unless the missile came directly from the front. Therefore, in order to avoid pilot confusion regarding the reliability of the system in use, a 'superior" wingman, one who the pilots were told rarely made a mistake, was employed to call out all real threats. The wingman's call always occurred 2.4 seconds after the
semi-Table 3.2. Order of Runs Group A Run Run Run Run Run Run Run Run Run Run I: No sensor (baseline) 2: Training - Sensor A 3: Combat - Sensor A / Auto 4: Combat - Sensor A / Semi 5: Training - Sensor B 6: Combat - Sensor B / Auto 7: Combat - Sensor B / Semi 8: Training - Sensor C 9: Combat - Sensor C / Auto
I O:Combat - Sensor C / Semi Group C
Run 1: No sensor (baseline) Run 2: Training - Sensor C Run 3: Combat - Sensor C / Auto Run 4: Combat - Sensor C / Semi Run 5: Training - Sensor B Run 6: Combat - Sensor B / Auto Run 7: Combat - Sensor B / Semi Run 8: Training - Sensor A Run 9: Combat - Sensor A / Auto Run I O:Combat - Sensor A / Semi
Group B
Run 1: No sensor (baseline) Run 2: Training - Sensor A Run 3: Combat - Sensor A / Semi Run 4: Combat - Sensor A / Auto Run 5: Training - Sensor B Run 6: Combat - Sensor B / Semi Run 7: Combat - Sensor B / Auto Run 8: Training - Sensor C Run 9: Combat - Sensor C / Semi Run I 0:Combat - Sensor C / Auto
Group D Run Run Run Run Run Run Run Run Run Run I: No sensor (baseline) 2: Training - Sensor C 3: Combat - Sensor C / Semi 4: Combat - Sensor C / Auto 5: Training - Sensor B 6: Combat - Sensor B / Semi 7: Combat - Sensor B / Auto 8: Training - Sensor A 9: Combat - Sensor A / Semi
lO:Combat - Sensor A / Auto
To provide motivation and realism, under certain circumstances, it was possible for a missile to hit the pilot. The "hit criteria" was that if flares were not dispensed prior to 1.5 seconds before missile impact, then the pilot was hit. The pilot was not hit if either he or the automation dispensed the flares in time. The pilot started each run with a typical flare load of 30 flares. Each time the MWS declared a missile threat in the automatic mode, two flares were dispensed. Each time the pilot activated the consent switch in either automatic or semi-automatic mode, two flares were dispensed. The number of flares provided was not meant to limit the pilot so much as to add realism. Even in automatic mode with the highest FA rate sensor (resulting in 10 declares), the pilot had enough flares to survive the mission (10x2 = 20 flares). However, the pilots were not told how
-many flares it would take to defeat the "real" missile shots. They were only told that the program was set to dispense two flares at a time. While it was not the objective to have pilots run out of flares, it was possible for them to do so if they hit the consent switch enough times.
The time of flight of all the missiles was 6 seconds, and the MWS declare always
occurred 1.6 seconds after missile launch. The probability of declaration of a real missile was ; therefore, in automatic mode, the pilot was always protected, unless he ran out of flares. In semi-automatic mode, the pilot had 2.9 seconds from the beginning of the declare, and 0.5 seconds from the start of the wingman's call to activate the aft flare switch on the stick in order to dispense flares and be protected. The timeline of events is summarized in Figure 3.6. 0 1 1.6 2 3 4 4.5 5 6 (sec) LA ile hits aft (if coved) Flare must be dispensed to decoy missile
Figure 3.6. Timing of Simulator Events
In the case of a missile hit, the entire simulator screen would flash red for approximately one to two seconds, then return the pilot to the run wherever he left off prior to being hit. Feedback was provided to the pilot for two reasons. The first intent was to assist in demonstrating the accuracy of the automation by reinforcing when a declare by the MWS alerted him to a valid missile shot. The second intent was to inform him if he or the automation were able to dispense flares in time to decoy the missile. Both pieces of
The first demonstrated reliability, or accuracy, of the automation, and the second demonstrated either the reliability of the automation or the proficiency of the pilot at dispensing flares in time to avoid a missile hit.
Pilot reaction time, for the purposes of this experiment, was defined as the time between when the MWS alerted the pilot and when the pilot was able to successfully initiate a flare dispense. The reaction time was measured in the simulator by recording the times of each MWS declare and the times at which the flare consent switch on the stick was
depressed. The reaction time for each MWS declare could be calculated by subtracting the time at which the pilot depressed the consent switch from the time of the MWS declare.
3.2.1.1 Description of Runs 3.2.1.1.1 Training Run
Training runs were used to help the pilots establish subjective sensor reliability baselines. The objective of the training run was for the pilot to develop a perceived level of trust in the particular sensor he was using as fast as possible. This was done by exposing the pilot to the false alarm rate of a particular sensor over "friendly territory" in an attempt to give him some isolated experience with it before complicating the scenario with real threats. This would be analogous to what happens in reality, as weapon systems are typically used during training flights for quite a long time before a pilot actually goes into combat with them. According to pilots assigned to the 46'h Test Wing, Eglin Air Force
Base, FL, the time when the false alarm rate of an MWS makes the biggest impression on a pilot is when he knows he is in an area where there are no threats (such as over the U.S.) The pilots were not told what the FA rate of the sensors were directly. Each pilot formed his own subjective estimate.
During the training runs, the pilot flew over the same terrain as he would during the combat runs. He was allowed to use the training runs for whatever purpose he chose,
including practicing the combat mission run. False alarms were simulated at the
appropriate rate depending on which sensor the pilot was using, referenced as A, B. or C. The pilot simply observed any alerts the system gave him, if any, and began to develop some level of'"assumed trust" in the system. The MWS was set in the auto mode for the training run.
3.2.1.1.2 Combat Run
This run was the type used for objective data collection. Its purpose was to give the pilot a realistic sense of using the sensor during engagement in a threat area, while keeping variables to a minimum. The pilot flew a route to accomplish a specific mission objective. Various threat missiles were fired at him during the mission. The pilot was able to evaluate the system's usefulness at alerting him to a real threat versus distracting him with a false alarm and possibly wasting flares. These runs also continued to develop the pilot's trust in the particular system, a subjective measure collected with a quick post-run survey. Other desired data measures were preferred MWS setting, number of flares dispensed, and time to consent (semi mode only).
The objectives of the combat missions were covered in a Mission Brief, shown in Figure 3.7. This written brief provided the pilots with background about the conflict, which was set in Iraq, and explained their primary mission, which was to bomb an airfield target. Additional information concerning weather and the need to visually confirm that the target was destroyed forced the pilots to fly at a low altitude into the threat zone. It also outlined the type of missile threats they should expect to see, based on intelligence reports. The brief described the configuration of the aircraft, including the number and kind of bombs carried. Pilots were told the number of flares that were loaded, and how many flares were dispensed with each dispense command. The pilots were also told they would have a wingman, and that the wingman was very dependable at detecting enemy missiles. They were provided a diagram of the profile they should fly, which is described in further detail in the following section.
MISSION BRIEF
The U.S. is leading a multi-national air campaign against Iraq for non-compliance with United Nations resolutions. It is day 4 of the conflict.
Intel reports indicate an enemy aircraft is being loaded with chemical and biological weapons for an intended drop on allied forces. Your mission objective is to destroy the enemy aircraft (and/or airfield) prior to its launch from the airfield. (A hit with a new
prototype MK-84 will ncutralize/incinerate the chem/bio agents.) You are part of a two-ship, and it is critical to your mission that you, or your wingman, visually verify that the target has been destroyed. Additional allied aircraft will be launched after your takeoff
with the same primary target in the event that your mission is unsuccessful.
A weather front has moved in over the entire area, and dense cloud cover produces 0 visibility from 5-50K feet. The flight profile has already been planned, and Attachment I is the output from the computer planning tool. A lineup card with TOT and aircraft
configuration (2 MK-84s on stations 3 and 7. and an ALQ- 184 on station 5) is provided
for your convenience (see Attachment 2). The EWS has been completely knocked out, so expect a low radar threat; however, there have been reports of numerous encounters with
advanced enemy IR missiles, such as SA- I 6s and SA- I 8s, over the entire threat area.
Your wingman is a longtime friend. You have flown many combat missions with him already, and he has a sharp eye for enemy missiles. You have never known him to make
an error calling a missile shot, and he has saved your neck more than once.
If you have any questions, you may ask them now. Otherwise, fly safely, and GOOD
LUCK!
3.2.1.2 Profiles
A diagram of the general route that the pilots flew is shown in Figure 3.8. The longitude (in degrees and minutes) and latitude (in degrees and minutes) are listed at each point.
with designations of N for north and W for west. The heading (in degrees). distance between points (in nautical miles). and time between points (in minutes:sconds) is listed in the "arrow box" next to each leg of the profile. The requested airspeed was 480 knots
(ground speed) for the first and third legs. and 540 knots (ground speed) for the second
leg. 'Ihese arc typical airspeeds used in bombing runs.
Figure 3.8. Flight Profile N 34 53.6 TARGET AW 11 7 54.3 IP 13.1 X :39 0 P'7 - W ll /1./ ENTI Vw O l
For each run. the entry. initial point (IP). target. and egress points were the same to
provide simplification of simulator programming. he pilots were able to visually see the
IP. target. and egress landmarks. which were depicted in the simulator as a bridge,. the middle hanger of three hangars next to an airfield. and a factory complex. respectively.
It was highly probable that the pilots would react to the declarations in significantly
difficrcnt ways. since combat flying procedures allow fbr a certain amount of flexibility. 'Iherclfore. in order to maintain consistency with regard to the way declarations were presented to the pilot. including lalse alarms and real threats. all declarations were
delined hby a run time and aspect angle. A table of the run times and aspect angles of'cach
declaration presented for each profile is listed in Appendix A.
3.2.2 Data Measures
Tihe primary dependent measures were pilot subjectivc estimates of their trust and preferred MWS mode of operation. Data was collected by administering a survey (see Figure 3.2) to the pilots after they completed the final run with a particular false alarm rate. resulting in the pilot completing the survey after the 4th. Th . and 10'h runs. A
modified Cooper-llarper Rating Scale for Use was developed in order to help quantify the pilots' responses for further evaluation (see Figure 3.3).
A paired comparison survey was used to collect data needed for application of the Analytic Hierarchy Process (AHP). an experimental tool for determining the relative preferences between multiple alternatives (see Figure 3.5). In this study. the alternatives were the three sensors representing the different false alarm rates. A description of how the AHP can be applied to Human Factors analysis is outlined in Yang and Hansman (1995). The AHP data was collected by administering the paired comparison survey after all the simulator runs had been completed.
The objective data taken for each profile included a computer printout of run times for each simulator event. The events for which the run times were recorded include missile launches, false launches, MWS declarations, flare consent switch actions (semi-automatic
mode only), flare releases, and missile hits. Survival rate could be determined from the missile hit results. If the pilot completed a run without any missile hits, then he had survived. If he had one or more hits, then he had not survived.
3.3 Equipment and Materials
The particular simulator used was an F-16 Concept Development Simulator (CDS), comprised of an F-16C cockpit with most of the appropriate hardware, including throttle, stick, IIIJ),. and two Multi-function Displays (MFDs). A few of the other switches and gauges found in an operational F-16 cockpit were simulated with pictures, however, all hardware relevant to pilot operation of the MWS was present. State-of-the-art 401'6
IUI) software. an upgrade to current F-16 block 40 HUD software, was also modeled in the simulator. This software included all the developmental MWS pilot/vehicle
interfaces, both visual and aural, described in section 2.2.3. The cockpit was located in a small room, approximately 15'x 15', with a projection screen on the wall about 4' in frornt of the cockpit. The room was similar to a tiny theater, and, in fact, was sometimes
referred to as the "theater in the round." Figure 3.9 shows a picture of the simulator room, and Figure 3. 10 shows a close-up of the simulator cockpit.
3.4 Experimental Protocol
Each pilot received instruction on the MWS operation, symbology and warning cues. In addition, each was briefed on the CDS capabilities and limitations. Next, the pilot was briefed on the simulation tasks, procedures. and profiles. This information was pre-written in order to minimize the variation of instruction between pilots. The subject was first handed a one-page experiment bief, explaining the overall procedures of the
experiment (see Figure 3. 1). The experiment brief referenced two surveys that the pilots would be asked to complete at various times throughout the experiment, and copies of these surveys were provided to the pilot for his review and clarification (see Figures 3.2, 3.3, 3.4, and 3.5). Once the pilot was satisfied that he understood the procedures of the
Figure 3.9. F-16 Concept )evclopment Simulator Room
This brief provided him with background about the specific mission he was about to fly, as well as details he needed to successfully fly the mission, such as the configuration of his aircraft and a description of the target.
Each pilot was allowed hands-on familiarization and practice in the simulator prior to beginning the first data run. The first run was started when the pilot was satisfied that he knew the requirements of the tasks to be performed.
4 Data Analysis and Results
4.1 Subjects
A total of twelve pilots participated in this study, resulting in three pilots per
counterbalancing group. All test subjects were U.S. Air Force pilots currently trained and qualified in the F-16 Fighting Falcon aircraft. All test subjects were male, although this result was not by design.
A background survey was administered to each pilot at the conclusion of the study to determine the specific nature of his aeronautical experience, i.e. operational, combat, aircraft hours/type, etc. In short, the survey revealed extensive training and flying experience in the F-16, as well as numerous other aircraft. The average subject flight time in the F-16 was over 1500 hours. The average subject flight time for all aircraft combined was over 2100 hours. At the same time, the pilots showed diversification, representing 8 organizations throughout the Air Force.
4.2 Subjective Measures
One of the primary subjective dependent measures was pilot trust in the MWS for each false alarm rate. Trust data was obtained from the Pilot Sensor Surveys, which were administered to the pilots after they completed all three runs with a particular false alarm rate. This resulted in the pilot completing the survey after the 4t, 7t, and 10 rns. For
each of the three FA rates, the number of pilots responding with a particular trust level was tallied, and the results are presented in the bar chart shown in Figure 4.1. "Level of pilot trust" refers to the answer pilots gave to question #1 of the survey.
The data show that as false alarm rate increases (reliability decreases), pilot trust in the automation decreases. For the 0 FA/5 min. sensor, six pilots said they would "always" trust the system and six said they would "often" trust the system. For the 1 FA/5 min. sensor, three pilots said they would "always" trust the system, six said they would "often"
Figure 4.1. The Effect of False Alarm Rate on Pilot Trust of Automation
trust it, and three said they would "sometimes" trust it. For the 5 FA/5 min. sensor, three pilots said they would "often" trust the system, four said they would "sometimes" trust it, three said they would "rarely" trust it, and two said they would "never" trust it.
Having established a negative correlation between FA rate and pilot trust, the effect FA rate had on preferred level of automation was next investigated. Preferred mode data was also obtained from the Pilot Sensor Surveys administered to the pilots after they
completed all three runs with a particular false alarm rate. For each of the three FA rates, the number of pilots responding with a particular preferred mode was tallied, and the results are presented in the bar chart shown in Figure 4.2.
How Often Pilots Said They Would Trust Each MWS
6 5 (n 4-0 .0 E 2 1 O
Always Often Sometimes Rarely Never
Level of Pilot Trust w
Figure 4.2. Preferred Level of Automation vs. False Alarm Rate
As mentioned earlier, the JND of the FA rate was unknown at the time of the experiment; therefore, to better ensure that pilots could differentiate between false alarm rates, the data was collected for three rates thought to be easiiy distinguishable. Experimental resources also limited the number of false alarm rates that could be tested, considering the availability of the simulator and access to qualified pilots. The three rates were chosen to estimate the performance of a perfect sensor (O FA/5 min.), an intermediate sensor
(1 FA/5 min.), and a poor sensor (5 FA/5 min.). While one or more pilots preferred every level of automation, when flying with the poor sensor (5 FA/5 min.), only two out of twelve pilots preferred the automation off.
The data show that if the trends continued at the same rates, they would appear to be consistent with the trends of the hypothesized curves presented in section 2.2.5. For this particular scenario, however, the FA rate tested was not high enough to convince more
than two pilots to turn the automation off. If the trends were extrapolated at the same rates, the data suggest that almost all of the pilots would have turned the system off at a FA rate of approximately 10 to 12 FA/5 minutes.
It is interesting to note that even using the "perfect sensor" (0 FA/5 min. rate), two of the twelve pilots preferred the semi-automatic mode. One factor that may have contributed to this behavior is the effect of individual self-confidence in manually performing the task noted by Riley (1994). The two pilots that preferred the semi mode may have felt that they could better defeat the missiles and accomplish the mission by taking advantage of the MWS warning, but manually dispensing the flares. Hit rate results presented later in this report show that no pilots were hit in either auto or semi mode when flying with the perfect sensor, indicating that pilots survived as well when dispensing flares manually as they did when the automation dispensed the flares with this particular sensor.
Another factor that may explain why two of the pilots preferred the semi mode with the perfect sensor is related to previous pilot experiences with false alarm plagued warning systems, such as the radar warning receiver (RWR). Any new MWS will have to overcome the negative presupposition that it, like its predecessors, has too many false alarms, even before they know what the FA rate is or before they use it. This suspicious attitude can be seen in the following comments made by the pilots regarding the 0 FA rate sensor.
"The simulation worked great. However, it would be interesting to see how a real system would work. I imagine a LOT more false alarms."
"The reliability of this system will have to be very high. False alarm rate must be < 5%. Any more, and the system will be ignored."
Overall, it is evident from Figure 4.2 that the preferred level of automation shows a strong dependence on FA rate. As FA rate increased, the pilots chose lower levels of automation. As mentioned previously, caution should be used to avoid applying these results very far past the particular circumstances of this experiment. The extent of the findings to be reported in this document concerning the data in Figure 4.2 is simply that the trends of the preferred automation levels appear to be c -nsistent with those predicted. No conclusions were drawn regarding the specific FA rate values tested in this study, since doing so for such a limited set of circumstances was not very useful. Should similar testing be done in the future, the results can hopefully be integrated, and eventually
enough data be obtained to support conclusions regarding specific FA rate values.
More quantitative results concerning MWS usefulness were obtained from the responses to the modified Cooper-Harper Rating Scale for Use. Since the ratings are non-ordinal, the median was used for analysis instead of the mean. The median ratings for each false alarm rate are plotted in Figure 4.3.
This modified scale, based on the well-known Cooper-Harper scale for aircraft flying qualities, was designed for this experiment to enable pilots to express how useful a particular MWS was in a more quantitative manner. On this scale, the smaller the numerical rating, the more useful the system is, one being the best rating a system could obtain. It is evident from the data that as FA rate increased, the median modified Cooper-Harper rating increased as well, equating to a decrease in usefulness. The median rating for the 0 FA/5 min. sensor is 2. Referring back to Figure 3.3, this corresponds to a good sensor with negligible deficiencies, which agrees with the pilot preferred auto mode. The median rating for the 1 FA/5 min. sensor is 4, corresponding to a system where desired performance is still attainable, but with minor annoying deficiencies. This rating is also consistent with the results for pilot preferred mode. For this sensor, the majority of pilots preferred auto mode; however, more pilots preferred semi mode for this sensor than they did for the perfect sensor. Finally, the median rating for the 5 FA/5 min. sensor was 7. This corresponds to a useable system, but one that has major deficiencies. This rating is
Figure 4.3. The Effect of FA Rate on Median Modified Cooper-Harper Ratings (Lower ratings indicate more usefulness)
consistent with the results obtained from the pilot preferred mode data, which showed that a majority of pilots preferred the semi mode for this sensor.
The correlation of pilot preferred mode and pilot trust was investigated next. For every instance that the pilots preferred a particular level of automation, the number of pilots that indicated each level of trust was tallied. For example, there were 21 instances when the pilots preferred the auto mode. Out of those 21 times when the pilot preferred auto mode, there were seven times that the pilot also indicated that he would always trust the system, eight times he indicated that he would often trust the system, and six times he indicated he would sometimes trust the system. The same types of numbers were tallied for the semi and off modes, and the data presented in Figure 4.4. From the figure, it is clear that as the self-assessed trust of the MWS decreases, the preferred level of automation also
Median Cooper Harper Ratings
21 3 3 4-m 5 A 6-n o C 7-.M 8 S 9. 10 0 1 2 3 4 5 6
False Alarm Rate (FA/5 Min)
I
0----Figure 4.4. The Effect of Trust on Automation Use
As can be seen from the data, the highest trust levels correspond to the use of auto mode and slightly lower trust levels correspond to the use of semi mode. The only time pilots preferred the system off was when they never trusted the system. This may indicate a willingness to use automation under these circumstances, such that they would prefer using at least some level of MWS automation, as long as there is a reasonable chance that it may be correct. This type of behavior is predicted when the automation user has little confidence in his own ability to perform the task (Riley, 1994). Most informed pilots would agree that the chances of seeing a missile shot with the naked eye in time to dispense countermeasures and perform counter maneuvers are very small. Hence if the automation does not work. the outlook is dismal for the pilot anyway. Pilot comments support this view:
Preferred MWS Mode Within Trust Levels
9 8 7 0 6
e-04
.0 E 3z
2Always Often Sometimes Rarely Never
Level of Trust