HAL Id: hal-00906744
https://hal.archives-ouvertes.fr/hal-00906744
Submitted on 7 Mar 2014
HAL is a multi-disciplinary open access
archive for the deposit and dissemination of
sci-entific research documents, whether they are
pub-lished or not. The documents may come from
teaching and research institutions in France or
abroad, or from public or private research centers.
L’archive ouverte pluridisciplinaire HAL, est
destinée au dépôt et à la diffusion de documents
scientifiques de niveau recherche, publiés ou non,
émanant des établissements d’enseignement et de
recherche français ou étrangers, des laboratoires
publics ou privés.
Spatio-temporal registration of electro-anatomical
mappings with functional data for CRT optimization
François Tavard, Antoine Simon, Alfredo Hernandez, Julian Betancur, Erwan
Donal, Christophe Leclercq, Mireille Garreau
To cite this version:
François Tavard, Antoine Simon, Alfredo Hernandez, Julian Betancur, Erwan Donal, et al..
Spatio-temporal registration of electro-anatomical mappings with functional data for CRT optimization.
IEEE Computing in Cardiology, Sep 2012, Krakow, Poland. pp.161 - 164. �hal-00906744�
Spatio-Temporal Registration of Electro-Anatomical Mappings with Functional
Data for CRT Optimization
Franc¸ois Tavard
1,2, Antoine Simon
1,2, Alfredo I Hern´andez
1,2, Juli´an Betancur
1,2, Erwan Donal
1,2,3,
Christophe Leclercq
1,2,3, Mireille Garreau
1,21
INSERM, U1099, Rennes, France
2Universit´e de Rennes 1, LTSI, Rennes, France
3
CHU Rennes, Service de cardiologie et maladies vasculaires, Rennes, France
Abstract
This work is based on the registration and fusion of multimodality data for cardiac resynchronization therapy (CRT) optimization. The goal is to provide local descrip-tors of the electro-mechanical (EM) coupling of the heart, using anatomical, electrical and mechanical data acquired from CT-scan volumes (CT), speckle tracking echocardio-graphy (STE) and electro-anatomical mapping (EAM). In previous works, we have presented registration methods to place EAM, CT and STE in the same geometrical reference system.
In order to extract EM descriptors, data resulting from EAM and STE should be synchronized. This is done ac-cording to the ECGs acquired during both acquisitions. However, the number of ECG derivations as well as the cardiac frequencies differ in both acquisitions. In this work, the selection of the most appropriate ECG deriva-tion acquired with EAM is based on the computaderiva-tion of the cross-correlation between the three ECGs from EAM and the one from the STE acquisition. A non-linear map-ping (using dynamic time warmap-ping) is estimated between the two signals to handle the differences in cardiac fre-quencies. This whole process enables to represent useful descriptors for CRT resulting from EAM, STE and CT data in the same spatio-temporal reference system. Results are presented on three patients undergoing CRT.
1.
Introduction
Cardiac Resynchronization Therapy (CRT) has been ac-cepted as a therapeutic option in heart failure patients who remain highly symptomatic despite optimized medi-cal treatment. However, 30% of the patients do not respond to the therapy [1]. Therefore, imaging modalities including echocardiography or magnetic resonance imaging, aiming for mechanical dyssynchrony estimation, have been pro-posed to improve patient selection criteria and lead
place-ment [1, 2]. The most challenging tasks to carry out re-main both the identification of the most effective pacing sites and the guidance of the left ventricular (LV) lead im-plantation using a venous access.
Our goal is to better plan the placement of CRT leads using anatomical, functional and electrical data ac-quired with cardiac Computed Tomography (CT) imaging, Speckle Tracking Echocadiography (STE) and Electro-Anatomical Maps (EAM) respectively1. In previous works, we proposed to solve geometrical registration prob-lems between CT and EAM data by a semi-interactive method [3] rather than mainly used simultaneous acqui-sitions [4] and between CT and STE data by geometrical method using the entire cardiac cycle [5] rather than land-mark methods [6]. These two methods give a common 3D space for the three modalities.
We here propose to combine STE and EAM to compute local electro-mechanical delays (local EMDs). To achieve this goal, strain signals from STE and electrical data from EAM are to be temporally registered. For this purpose the ECGs acquired during both acquisitions are considered. However, the acquisitions in both modalities are quite dif-ferent in term of derivation and present non-linear differ-ences in cardiac frequencies. We propose a method to syn-chronize STE and EAM data based on cross-correlation and dynamic time warping (DTW).
This paper first describes the mechanical and electrical data considered. Secondly, we give the outlines of our reg-istration methods. The temporal regreg-istration of EAM and STE is then detailed step by step, leading to a discussion on the local EM coupling extracted for three patients and illustrated by quantitative 12 segments bullseye maps. Fi-nally conclusions and future works are proposed.
1Our work is part of the projects IMOP: ANR CIC-IT n◦04
Figure 1. Global strategy for the fusion of anatomical, electrical and mechanical data.
2.
Global strategy and data processing
The global strategy is to define a global spatial and tem-poral reference to integrate EAM, STE and CT before ap-plying fusion process to extract local EM descriptors (Fig. 1). We give below a brief description of the acquired data and the proposed registration methods.Minimum of strain. STE are acquired on 2 and
4-chamber apical views over a cardiac cycle, along with a single ECG derivation. On each view, the strain is com-puted on 6 anatomical segments (giving 12 segments in total). The mechanical information used is the delay from the beginning of the QRS to the minimum of strain, which matches the maximum of contraction of the considered segment. We will refer to this measure as “global electro-mechanical delays” (global EMDs) by opposition to local EMDs.
Local activation time and voltage. During the EAM
acquisition, a moving probe scans the endocardium wall and a signal of the electrical activity or electrogram (EGM) is acquired on sparse measurement points, along with three derivations of the ECG (DI, V1, aVF). From EGMs, the electrical informations extracted are: (i) the local activa-tion times (LAT) i.e. the time from a fixed temporal ref-erence (usually sinusal activation) to the maximum of the electrical activity. LAT represent the delay to reach lo-cal activation; (ii) the voltage i.e. the signal’s peak-to-peak amplitude. Voltage characterizes the amount of my-ocardium cells locally contracting.
Spatial registration methods have been proposed in
our previous works. The registration of EAM and CT im-ages is based on the automatic alignment of apex and great axis of surfaces extracted from both acquisitions, and on the manual rotation of the EAM surface around its great axis. LAT acquired by EAM are then projected on a LV model surface [3] (modelled from CT segmented surfaces [7]). A validation of this step has been done by checking that the stimulation lead position (given by angiography) matches the first activated point (given by EAM).
We have proposed a registration method for STE and CT based on a geometrical metric and a priori consideration [5]. A second method has been recently proposed for this registration which relies on a Fourier contour description
and on Dynamic Time Warping (DTW) [8, 9] to handle the non-linearities between both temporal bases.
3.
Extraction of local electro-mechanical
delays
In this section we describe the two step method for tem-poral registration (signals synchronization and time warp-ing) and the computation of local EMDs.
3.1.
Temporal registration
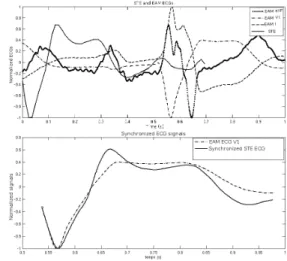
Signals synchronization. ECGs acquired in both modalities are used to synchronize the strain signals from STE and the EGMs from EAM. First the maximum of cross-correlation gives us the ECG derivation from EAM best suiting the ECG from STE. Then we use this maxi-mum to synchronize both ECGs giving a unique time ref-erence as shown on Fig. 2.
Figure 2. Top: ECG signals acquired in EAM (three derivations) and STE. Bottom: EAM ECG derivation choice (in this example V1) and synchronization by maxi-mum of correlation.
Time warping. Both time spaces tST E and tEAM
will be defined bytST E1. . . tST EnandtEAM1. . . tEAMm.
DTW enables to measure similarities between two quences which may vary in time or dynamics. The se-quences are then warped non-linearly in the time dimen-sion. For this purpose, DTW is based on the search for a warping functionF = {(i1, j1), (i2, j2), . . . , (iN, jN)}
which is a sequence ofN couples of(tEAM, tST E) such
that a distanceD(F ) is minimized. This distance is
de-fined to best match both ECGs signals along the car-diac cycle: D(F ) = PNn=1d(in, jn).w(in, jn), where
d(in, jn) = d(tST Ei, tEAMj) =
dECGST Ei dtST E −
dECGEAMj dtEAM
introduced to compensate the variation of the path length:
w(in, jn) = (in− in−1+ (jn− jn−1)). By using the first
derivative of the ECG signals, priority for time warping is given to the ECG shapes and not its values. Some classical restrictions on the warping function are added in order to preserve the structures of both cardiac cycles: monotony, continuity, boundary conditions (i1 = 1, iN = tST En, j1 = 1 and jN = tEAMm) and slope constraint (to favour
a (+1, +1) direction in the time space see Fig. 3-Top). Moreover, the search domain has been restricted using a combination of commonly used Itakura’s parallelogram and Sakoe’s ribbon (Fig. 3-Bottom). Finally, the corre-spondence between both time sequences is obtained by finding the minimum path D(F ) through dynamic
pro-gramming.
3.2.
Definition of local EMDs
With both modalities in the same 3D+t space, we are able to reach local EM coupling. By opposition to global EMDs, we propose a new indicator of the EM coupling: local EMD. It is defined as the time from local activation
tLAT to local minimum of strain tstrain. It represents
the time δEM D from the electrical stimuli to the
maxi-mum of contraction. δEM D = tstrain − t0LAT where
t0
LAT ∈ [tST E1. . . tST En] (after DTW is applied).
4.
Results and discussion
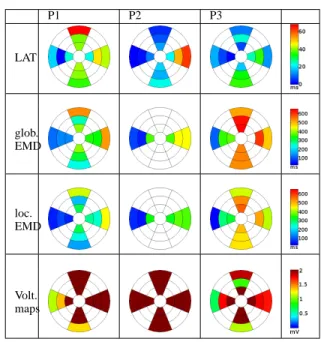
Local EMDs are computed on the 12 segments on which strain is measured. In this study, we present results of EMD for three patients P1, P2 and P3. For patient P2, only the 4-chamber view was available, reducing the number of segments to six. Results are presented on 12 segments bullseye (Fig. 5) and described below.
Local activation time. First activated segments are
lo-cated on the septal wall and the latest activated segments on the lateral or anterior wall. The entire electrical activa-tion of the LV is propagated in approximately 60 ms for patients P1 and P2 and in about 40 ms for patient P3.
Global electro-mechanical delays. Since the reference
here is the ECG, those delays are a combination of (i) acti-vation time delays inter-segments (the delays generated by the electrical propagation) and (ii) the electrical and me-chanical delays intra-segments (the delays generated by the local electrical impulse, the mechanical response and contraction). For these patients, the shortest global EMD are found on the septal wall which is not always the case for patients suffering from ventricular asynchronism. For the other segments, global EMD are greater (between 100 and 550 ms) and even greater than the systolic time for pa-tient P3 (the maximum of contraction occurs after the aorta valve closure).
Local electro-mechanical delays. Unlike global EMD
which combine inter and intra-segment delays, local EMD only consider the intra-segment electrical and mechanical delays, therefore better describing the local behaviour of the LV wall.
By analysing local EMD and local activation time, pa-tient P2 stands out compared to papa-tients P1 and P3: (i) patient P2: the local EMD appears quite homogeneous with low values. These low local EMDs could show a good electrical propagation in the corresponding segments and / or a good contraction response to the electrical stim-uli. The lateral medium and lateral basal segments show a lack of inter-segment electrical propagation with high value activation times (local activation time map). In a CRT scheme, this is an important fact: if those segment were to be stimulated, the mechanical response should give an efficient contraction.
(ii) patients P1 and P3: the local EMD are of higher val-ues, this is also an important fact, for it is likely that those segments do not offer a good contraction, even with an ear-lier electrical stimulation.
Voltage maps. Compared to the voltage map for patient
P2 for which every value is above 2mV (showing a nice re-cruitment of cardiac muscular cells), the maps for patients P1 and P3 show low voltage segments. This is a comple-mentary information to local EMDs even if local EMDs maps are more reliable for acquisition technique reasons.
Patient response to CRT. Presented results show the
importance of combining local electrical data to STE me-chanical data. The goal of CRT is to correct inter-segments electrical delays considering an efficient intra-segment ac-tivation. This intra-segment activation is characterized by local EMDs.
In our CRT scheme, we look for a predictive response of the patients to the probe implantation. The actual quality of the response to CRT is given by clinical follow-up for these patients:
• Patient P1 went from a 18% left ventricle ejection frac-tion (LVEF) to 25% after implantafrac-tion giving a slightly better condition.
• Patient P2 respond to CRT with a 60% LVEF after CRT implantation (against 35% before) with no longer signs of asynchronism.
• The response to CRT of patient P3 is moderate. His LVEF went from under 20% to 35%.
The high response to CRT of patient P2 is matching the analysis made with local EMDs. The fact that the latest segment is being stimulated explains the high delay cor-rection and the synchronism of the LV after implantation.
5.
Conclusion
We have proposed a new method for the fusion of elec-trical (from EAM) and mechanical (from STE) data on an anatomical LV surface (here computed from CT-scan). To
Figure 3. Left: DTW between two signalsU and V .
Right: restriction domain on the search space.
Figure 4. Localization of anatomical segments on a 12 segments bullseye. P1 P2 P3 LAT glob. EMD loc. EMD Volt. maps
Figure 5. 12 segments bullseye for 3 patients (columns) of local activation times (LAT) in ms, global and local EMD in ms and voltage maps in mV (lines).
represent data in a common 3D+t referential and to extract descriptors useful to CRT, electrical and mechanical infor-mation are registered geometrically and temporally. Local EMDs are extracted and visualized on bullseyes. Results on three patients are presented along with discussion on the links between the local EMD values and the response of patients to CRT showing the importance of local EMDs versus global EMDs.
In CRT the understanding of the local EM coupling of the LV is necessary to better localize the implantation probe site. We show the importance of EAM, a modality offering a local access to electrical information. Even if this modality cannot be used easily in routine acquisition, other ways to compute local electro-mechanical delays, for instance from surface ECGs [10], should be a key to CRT optimization.
References
[1] Morgan J, Delgado V. Lead positioning for cardiac resyn-chronization therapy: techniques and priorities. Europace 2009;11(suppl 5):v22–v28.
[2] Chung E.S. et al. Results of the predictors of response to CRT trial. Circulation 2008;117(20):2608–2616.
[3] Tavard F. et al. Data fusion of left ventricle electro-anatomical mapping and multislice computerized tomogra-phy. In ICIP. ISBN 978-1-4244-5653-6, 2009; 1725–1728. [4] Rhode K, Sermesant M. Modeling and registration for electrophysiology procedures based on three-dimensional imaging. Current Cardiovascular Imaging Reports 2011; 4:116–126.
[5] Tavard F. et al. Fusion of electro-anatomical mapping and speckle tracking echography for the characterization of lo-cal electro-mechanilo-cal delays in CRT optimization. In CinC. 2010; 401–404.
[6] Huang X. et al. Dynamic 2D ultrasound and 3D CT im-age registration of the beating heart. IEEE Transactions on Medical Imaging January 2009;28(8):1179–1189. [7] Fleureau J. et al. Assessment of global cardiac function in
MSCT imaging using fuzzy connectedness segmentation. Computers in Cardiology 2008; 725–728.
[8] Tavard F. et al. Dynamic registration of cardiac US and CT data using fourier descriptors and dynamic time warping. In upcoming IPTA. 2012; .
[9] Itakura F. Minimum prediction residual principle applied to speech recognition. Acoustics Speech and Signal Process-ing IEEE Transactions on 1975;23(1):67–72.
[10] Berenfeld O. Toward discerning the mechanisms of atrial fibrillation from surface electrocardiogram and spectral analysis. Journal of Electrocardiology 2010;43(6):509 – 514. ISSN 0022-0736.
Address for correspondence:
Garreau Mireille: [email protected] LTSI, Bˆat. 22 Campus Beaulieu, 35000 Rennes FRANCE