Volume 37(1)
Spring/printemps 2011
Digital Learners in Higher Education: Generation is Not the Issue
Apprenants numériques en enseignement supérieur : la génération n’est pas
en cause
Mark Bullen, British Columbia Institute of Technology Tannis Morgan, Justice Institute of British Columbia Adnan Qayyum, University of Ottawa
Abstract
Generation is often used to explain and rationalize the use of information and communication technologies (ICTs) in higher education. However, a comprehensive review of the research and popular literature on the topic and an empirical study at one postsecondary institution in Canada suggest there are no meaningful generational differences in how learners say they use ICTs or their perceived behavioural characteristics. The study also concluded that the post-secondary students at the institution in question use a limited set of ICTs and their use is driven by three key issues: familiarity, cost, and immediacy. The findings are based on focus group interviews with 69 students and survey responses from a random sample of 438 second year students in 14 different programs in five schools in the institution. The results of this investigation add to a growing body of research that questions the popular view that generation can be used to explain the use of ICTs in higher education.
Résumé
On utilise souvent les générations pour expliquer et justifier l’utilisation des technologies de l’information et de la communication (TIC) dans l’enseignement supérieur. Cependant, un examen complet de la documentation scientifique et populaire à ce sujet, de même qu’une étude empirique réalisée dans une institution postsecondaire canadienne suggèrent qu’il n’existe aucune différence générationnelle significative dans la façon dont les apprenants affirment utiliser les TIC ni dans les caractéristiques comportementales perçues. L’étude a également conclu que les étudiants de niveau postsecondaire de l’institution en question utilisent une gamme limitée de technologies de l’information et de la communication et que leur usage est déterminé par trois critères : la familiarité, le coût et l’instantanéité. Les conclusions s’appuient sur des entrevues de groupe réalisées auprès de 69 étudiants et sur des réponses de sondage tirées d’un échantillon aléatoire de 438 étudiants de deuxième année dans 14 programmes différents, dans cinq départements de l’institution. Les résultats de cette enquête s’ajoutent aux études de
plus en plus nombreuses qui remettent en question l’opinion populaire voulant que l’on puisse utiliser les générations pour expliquer l’utilisation des TIC en éducation supérieure.
Introduction
The idea that the generation born after 1982 is fundamentally different than previous generations has become so firmly entrenched that it is treated as a self-evident truth.1 Futurists and
commentators argue that because the members of this generation have been immersed in a networked world of digital technology, they behave differently, have different social characteristics, different ways of using and making sense of information, different ways of learning, and different expectations about life and learning (Howe & Strauss, 2000; Oblinger & Oblinger, 2005; Palfrey & Gasser, 2008; Prensky, 2001a, 2001b, 2005; Tapscott, 1998, 2009). These claims have potentially significant and costly implications for educational institutions (Rickes, 2009) as they are being urged to make significant changes to how they are organized, how they teach, and how learning technologies should be used (Conway, Radford, & Williams, 2009).
The key claims in the net generation discourse emerge from non-scholarly literature. Some appear in the popular or lay press, while others are found in proprietary research funded by and conducted for private business. Still others can be found in quasi-academic publications that have the appearance of academic or scholarly quality but turn out not to be informed by empirical research. We believe there is a place for all these types of publications. Often speculative discourse will open up new avenues of inquiry and it can serve a valuable role in stimulating critical and creative thinking. Unfortunately, in our view, the educational community has not adequately discriminated between the different types of publications nor subjected them to the appropriate level of critical scrutiny.
In 2008, we undertook a study to test some of the most prevalent claims, to determine whether or not the students in one Canadian postsecondary institution fit the profile of the net generation learner as portrayed in the literature, and to try to understand how these learners were using various information and communication technologies (ICTs). Our research found that there is no empirically-sound basis for most of the claims that have been made about the net generation. More specifically, the study suggests that there are no meaningful differences between net generation and non-net generation students at this institution in terms of their use of technology, or in their behavioural characteristics and learning preferences. Our findings are consistent with the conclusions of other researchers (Bennett, Maton, & Kervin, 2008; Guo, Dobson, & Petrina, 2008; Jones & Cross, 2009; Kennedy et al., 2007, 2009; Kvavik, 2005; Margaryan & Littlejohn, 2008; Pedró, 2009; Reeves & Oh, 2007; Selwyn, 2009). We also found that the students’ use of ICTs is very instrumental and driven primarily by the needs of their programs. The students at this institution make use of a limited set of technologies based on three key issues: familiarity, cost, and immediacy. This article summarizes our analysis of the net generation literature and presents the results of a study conducted at a western Canadian postsecondary institution.
1 A variety of terms have been used to describe this generation: Digital Natives, Millennials, Generation Y, and the net generation are some of the most common. We have chosen to use net generation, a term originally coined by Tapscott (1998).
The Net Generation Literature
If we look at what has been written about the net generation, we can see three types of claims: claims about ICT use, claims about the impact of ICT use (particularly on learning), and claims about the distinctive personal and behavioural characteristics of this generation.
Claims About ICT Use
Claims about ICT use are the least contentious, as simple observation reveals the extent to which digital technologies are being used by people of all ages. To support these observations,
numerous surveys have confirmed that the use of digital technology is growing and that younger people tend to use these technologies more than older people (Jones & Fox, 2009).
Claims About the Impact of ICT Use
Claims about the impact of the use of digital technology are more contentious both because the claims are more bold and because the evidence to support them is often absent or of dubious quality. Prensky (2001a, 2001b, 2005), Tapscott (1998, 2009) and, to a lesser extent, Palfrey and Gasser (2008) have all claimed that the ubiquity of digital technologies and the net generation's intensive use of these technologies is affecting how the net generation thinks, interacts, and makes sense of the world. The following assertions are typical of the claims in popular literature about the impact on this generation of being immersed in digital technology:
Digital Natives are breaking new creative ground. The most creative young people are interacting with news, works of entertainment, and other information in ways that were unimaginable a few years ago. These young people are not passive consumers of media that is broadcast to them, but rather active participants in the making of meaning in their culture. (Palfrey & Gasser, 2008, p. 131)
They accept little at face value...unlike the TV generation which had no viable means to interact with media content, The N-Generation has the tools to challenge ideas, people, statements - anything. These youth love to argue and debate…they are also learning to think critically as well. (Tapscott, 2009, p. 88)
Prensky (2001a, 2001b) makes similar claims but goes even further, arguing that the pervasive use of these technologies is actually changing the physical structure of this generation’s brains, which allows them, among other things, to multitask effectively:
It is now clear that as a result of this ubiquitous environment and the sheer volume of their interaction with it, today’s students think and process information
fundamentally differently from their predecessors. These differences go far further and deeper than most educators suspect or realize....They like to parallel process and multi-task. They prefer their graphics before their text rather than the opposite. They prefer random access (like hypertext). They function best when networked. They thrive on instant gratification and frequent rewards. They prefer games to “serious” work. (pp. 1-2)
There is something intuitively appealing about these claims. It does seem to make sense that using these technologies intensively should have some impact, but to date, there is no convincing evidence to support these claims. Tapscott's (1998, 2009) work has the strongest empirical base.
His 1998 work is based on discussions with about 300 children ranging in age from 4 to 20, balanced in terms of gender, geography, and socio-economic status. However, he provides no details as to how these participants were recruited, how the balance was achieved, and whether or not the sample is representative. Furthermore, all the discussions were held in an online discussion forum, which would tend to skew the sample to participants who were already predisposed to use online communication technologies.
Tapscott (2009) continues to push the idea that this is a unique generation and argues that his claims of 1998 have been substantiated. But again, the limited methodological information that he provides does not allow us to judge adequately the validity of his claims. What we do know is the following:
• Data was gathered from a sample of 7685 randomly selected Internet users, stratified to avoid gender or socioeconomic bias.
• Interviews were conducted using an online questionnaire. • A Facebook group was used to collect over 200 stories.
• Discussions conducted on a global online network, TakingITGlobal, were analyzed. While the sample is large and the sources varied, only people already using digital technologies were surveyed, which suggests a biased sample. If one of the main goals of the research was to determine how engaged this generation is with digital technology and whether there are
generational differences, then a sample that included non-users of the technology would have been more appropriate.
Prensky (2001a, 2001b) provides no empirical support for most of his claims, although he does point to brain research to support his notion that technology use affects the physical structure of the brain. The specific effects of the pervasive use of digital technologies on multitasking ability, the need for instant gratification, and the preference for random access and graphics over
conventional text are not supported.
Palfrey and Gasser (2008) also provide few methodological details. They describe their
methodology in two paragraphs by saying they “conducted original research…a series of focus groups and interviews” and that they “spoke in detail to young people around the world” (p. 13). When we tried to obtain more details from the authors, we were referred to an article published after the book that reported on a study of youth and their attitudes towards copyright (Palfrey, Gasser, Simun, & Barnes 2009). This study was based on data from 69 students in the Boston area and the authors state, “We do not aim to make generalizable statements about youth perceptions of those issues at a larger scale” (p. 83).
In many cases, it is also difficult to connect specific claims to the data that is presented. For example, although Tapscott (2009) and Palfrey and Gasser (2008) have a large amount of data, it is not clear how this data supports their suggestion that the net generation either has good critical thinking skills or approaches information with a critical eye. Furthermore, this claim is
contradicted by a British study, which found that young Internet users are unsophisticated in their information-searching technique and do not critically evaluate the information they retrieve (University College of London, 2008).
Claims About the Characteristics of the Net Generation
The personal characteristics of the net generation have been the subject of numerous books and articles, but like the claims about the impact of ICT use, they are not well-supported by research. The research that is used to support the claims is often proprietary, meaning the authors are under no obligation to release methodological details and the studies have not been subjected to the normal academic peer review process.
One of the more widely-cited references in support of the claims about the net generation's distinct characteristics is Howe and Strauss’s Millennials Rising: The Next Great Generation (2000). They state: "Over the next decade, the Millennial Generation will entirely recast the image of youth from downbeat and alienated to upbeat and engaged – with potentially seismic consequences for America” (p. 4). But only two surveys form the empirical base for their claims. The first is a survey of 200 elementary school, middle school and high school teachers in Fairfax County, Virginia; the second is a survey of 660 students from the public high schools in the same county. Based on this data, from a very geographically limited population, they assert this entire generation is:
Beginning to manifest a wide array of positive social habits that older Americans no longer associate with youth, including a new focus on teamwork, achievement, modesty, and good conduct...look closely at the dramatic changes now unfolding in the attitudes and behaviours of today's youth, the 18 and unders of the year 2000. The evidence is overwhelming - and just starting to attract notice. (p. 4) Tapscott (2009) also makes some sweeping statements about the characteristics of the net generation. He proposes what he calls his eight net generation norms: freedom, customization, integrity, scrutiny, collaboration, entertainment, innovation, and speed. However, as mentioned earlier, Tapscott’s research was privately funded, and he does not provide the full details of his methodology that would allow for a proper assessment. It is not clear how he arrived at these eight norms.
Oblinger and Oblinger (2005) have probably done the most to legitimize the notion that this generation has unique personal and behavioural characteristics because their book was published by the well-known EDUCAUSE organization and made available as a free download. It is an edited volume of 14 chapters that are, for the most part, based on a mixture of speculation and anecdotal reports. They echo much of what Howe and Strauss (2000) say about this generation. Drawing on the work of Howe and Strauss (2000), Prensky (2001a, 2001b), Seely-Brown (2002), and Tapscott (1998), they argue that the net generation is digitally literate, connected, social, and has a preference for experiential learning and immediate feedback. They go further and suggest that there are clear educational implications of these characteristics, arguing that they point to a preference for team-based, collaborative, and structured learning experiences that are socially meaningful and use visual and kinesethic approaches.
Interestingly, the one chapter in Oblinger and Oblinger (2005) that is based on original and methodologically-sound research contradicts many of these claims. Kvavik (2005) presents results from a major survey of undergraduate students in the United States (4,374 students from 13 institutions in five states). The results suggest that the students have basic office suite skills and can use email and the Internet with ease but are not able to use the more advanced features
and may not be aware of these features. He found that students only have a moderate preference for the use of technology in their classes and he concludes that there is a need for further training in the use of information technology for educational purposes.
In summary, the claims about the net generation fall into three categories: the widespread and intensive use of digital technologies; the impact of this use on how this generation accesses and uses information, how they interact socially, and how they learn; and the unique behavioural characteristics and learning styles of this generation. With the exception of the first category (widespread and intensive use) our review of the popular and academic literature shows that there is no empirical support for the most prevalent claims in the other two categories. Furthermore, other literature reviews confirm our findings and the methodologically-sound research tends to contradict the claims.
The Study
Our interest in the net generation literature stemmed from institutional technology initiatives that were guided by claims about student use of technology. We recognized that since our own context as an applied polytechnic attracted a different student demographic than the often described American colleges and universities, it was necessary to get a better understanding of whether our own students fit a net generation profile. Therefore, our study was guided by the following research questions:
• How accurate are some of the more prevalent claims about net generation learners? • Do the students at this Canadian postsecondary institution fit the typical profile of the net
generation learner?
• How are the learners at this institution using various information and communication technologies (ICT)?
There were two parts to our study. In the first part, we interviewed students to gain insights into their formal and informal use of ICTs. In the second part, data from the interviews were then used to develop a survey. The survey contained psychological and behavioural items designed to measure personal factors related to students’ communication outside of class and to determine the extent to which students fit the typical net generation profile.
Institutional Context
The study was carried out at a public technical and trades training institute in Western Canada that offers two-year diplomas and Bachelor’s degrees and will soon be offering applied Master’s degrees. Teaching and applied learning, through industry partnerships, are important
characteristics of the institution’s educational programs, and technology is an important part of the teaching and learning experience.
There are approximately 43,000 students in the institution, and about 30,000 of these are
classified as part time studies students, meaning they are studying in the evenings or by distance education. Full time students are predominantly in the 18-24 year-old category (72%) and part time students, predominantly in the 25-44 year-old category (61%).
Interview Methods
Semi-structured interviews were held with 69 students over 29 sessions. Interview sessions were undertaken in formal focus groups and informal sessions in the social spaces of the Institute (sports fields, cafeterias, library). In the selection of both focus groups and interviews, we adopted maximum variation sampling of schools and programs. Table 1 lists the number of students interviewed in each school. Sixteen interviews with faculty were also conducted to provide context for student interviews.
There were eight student interview questions (see Appendix A), and most interviews were about 30 minutes in length. Questions focused on how and where students communicate with
classmates and with instructors and what their technology needs were for their studies. Table 1: Number of Students Interviewed, by School
School Number of Students Interviewed
Business 7
Computing & Academic Studies 8 Construction & the Environment 12
Health Sciences 14
Manufacturing, Electronics and
Industrial Products 23
Transportation 5
TOTAL 69
All interviews and focus groups were digitally recorded and then transcribed. Most interviews were conducted by two researchers. Data included interview transcripts, interview notes, and program information.
Three researchers read the interview transcripts and interview notes. We then began to code the student interview transcripts using the net generation descriptors (see Appendix B). However, since the interview questions were not designed to elicit specific responses around net generation descriptors, we adopted an open and axial coding strategy (Miles & Huberman, 1994) for the transcripts. Themes were generated and presented in a matrix format to develop assertions about student technology use and needs across programs.
Interview Findings
Data analysis provided important insights about the students, their formal and informal use of technology, and the extent to which they can be characterized as net generation. The data can be summarized into three themes, described below.
Limited Toolkit
Despite a vast array of institutionally-supported and freely available (Web 2.0) tools, the student 'toolkit' was, in our view, surprisingly limited. Student technological tools could be distinguished as belonging to one of two sets: general communication tools, or program-specific technical
tools. Frequently cited general communication tools were: email, instant messaging, mobile phones and Facebook, with face-to-face as a preferred communication option. Program-specific tools included technical software, such as AutoCAD. Some, but not all, program-specific software was provided by the institution. In some cases, students were required to purchase it themselves.
Within this limited toolkit, the selection of the tool was driven by the following characteristics of the technology:
Familiarity. The choice of tool was selected according to how well it matched the students’ particular communication needs. Tools such as instant messaging, email, and Facebook were used because they were well-known to students and easy to use. Familiarity with the tool also facilitated its transition from a social and informal use to an academic one. For example, students we interviewed in two programs used Facebook for group work because it does not require any institutional set up and approval (i.e., is self-organizing) and because it has more of an
“academic” identity than MySpace.
Cost. Mobile phone text and voice messaging were also frequently mentioned communication tools, but their use was determined by the mobile phone plan that the student had.
Immediacy. Both instant messaging (e.g., MSN) and mobile phones were selected for the immediacy that they provided. Instant messaging was often a first choice, with some students mentioning that if classmates were not online, they would phone them and tell them to go online. Instant messaging was used as a method of communication during class, in both productive and unproductive ways. While it sometimes served as a distraction, students also pointed to instant messaging as a way of communicating about course topics during class without disrupting the instructor and as a way of seeking help without appearing unknowledgeable in front of
classmates or the instructor. Context Sensitivity
While there was no evidence to suggest that students have a deep knowledge of technology, interviews revealed that students use technology in very context-sensitive ways. In other words, students have a good understanding of what technology can and cannot do for them given a specific context. The most illustrative example is student use of email.
Contrary to the current discourse that suggests that students use email with instructors because they think it is the preferred communication tool of an older generation, the data revealed that student selection of email as a communication tool is much more nuanced. In fact, students never mentioned age as influencing the use of email. Students said they used email with instructors in situations that demanded more formality or where it was desirable to maintain a certain distance. Additionally, despite the popularity of instant messaging as a communication tool with
classmates, email was also frequently listed as a channel (as were cell phones and face-to-face). Students chose between email and instant messaging in terms of communicating with a group or one-on-one. Email was seen as a useful communication tool when a message needed to be sent to a group, or for longer messages. It was also cited as useful for file sharing. Interestingly, when another tool, such as Facebook, was being used for group communication, email was then seen to be a useful one-on-one tool. This suggests that within an identified set of tools, students were able to select which was better suited to a given task.
Relationship of ICT Needs to the Nature of a Program
In the interviews, students were asked to identify any needs (ICT or other) that, if met, would help their learning. We were surprised to learn that students rarely identified ICTs as a need, and, for the most part, focused on basic physical and environmental constraints. In other words, if their basic needs were not being met, ICTs were not the focus of their concerns.
Physical or environmental needs included better lighting, more lab hours, more windows, better Internet access in some locations, and extended library hours. Time was also a frequently
mentioned need; the intensive nature of the programs demands that they spend most of their days on campus in class. However, there was also evidence that two recent infrastructure investments – the wireless network and smart classrooms – were being put to good use.
Data analysis also showed that there is considerable variation in needs across programs. For example, while students in the automotive program felt that their needs were being met very well for the most part, students in the architecture program pointed to a lack of essential tools such as large-scale printers and scanners.
Survey Methods
The survey was created in a three-step process: a question inventory was created, it was reviewed for content validity, and it was pilot-tested for usability. The results of the pilot test were used to assess reliability.
An item inventory was created based on the variables within the research question. Key characteristics of the net generation were synthesized from a comprehensive review of the literature. Our review identified the following characteristics:
• Digitally literate • Connected • Multitasking
• Preference for experiential learning • Preference for group or teamwork • Preference for images over text • Need for structure in learning • Social
• Community-minded • Goal-oriented
In the second stage, these items were reviewed for clarity and relevance. Five researchers and practitioners in educational technology, uninvolved in the research, reviewed the survey in the Spring of 2008. They were asked to rank and judge the items for clarity and relevance to the topic of each section of the survey. These topics were indicated in explanatory notes throughout the survey. After feedback from these reviewers, items were removed or edited.
From this process, the resulting survey had four sections:
• section two included behavioural items about what students do to address academic and administrative questions
• section three included behavioural items about student communication habits, including use of ICTs
• section four included mainly attitudinal items about students’ study preferences, perception of peers, instructors, and their programs
A four-point Likert scale was used for all survey questions about students’ behaviour and attitude. In section two, the scale was defined in terms of relative frequency of use with 1 on the scale being equivalent to “never,” 2 equivalent to “seldom,” 3 equivalent to “often,” and 4 to “always.” In section three, usage was specified in terms of number of times used per month: “never” - 0 times per month, “seldom” - 1-4 times per month, “often” - 5-10 times per month, and “always” - more than 10 times per month. The section four scale ranged from “Strongly Disagree” (1) to “Strongly Agree” (4).
It is important to note that the items dealing with the characteristics of the net generation were a subset of the survey and were scattered throughout the survey.
Survey Data Collection
A spreadsheet of all courses offered during the Fall semester of 2008 was obtained and all level one and two courses were removed, as these were courses taken mainly by first-year students. These first-year students were removed from the sample because the survey was being
administered early in a new academic year. Most first-year students would have little experience at the institution to draw on to complete the survey.
Initially 16 courses were randomly selected. Instructors from these courses were asked via email to participate in this research project. A follow-up email was sent to non-responding instructors four days later. Seven of the 16 instructors consented to participate. During the second round of sampling, an additional 11 courses were selected and instructors contacted. Seven of these instructors also consented to participate. The final list of the 14 courses surveyed is indicated in Table 2, in the order in which they were surveyed.
Table 2: Courses Where the Survey was Administered
Course Title (and Program) School
Number of Respondents 1. Introduction to Mineral Processing
(Mining and Mineral Exploration)
Manufacturing, Electronics and
Industrial Processes 27 2. Applied Physiology 2 (Nuclear
Medicine) Health Sciences 8
3. Object Oriented Programming in C++
(Computer Systems) Computing and Academic Studies 36 4. Design of Steel Structures (Civil
Engineering)
Construction and the
Environment 6
5. Heating, Ventilating and Air
Conditioning (Building Engineering)
Construction and the
Environment 93
6. Technical Communication 2 for Electronics (Electrical and Computing Engineering)
Manufacturing, Electronics and
Industrial Processes 21 7. ArcGIS 3: Customization and Modeling
(Geographic Information Systems)
Construction and the
Environment 33
8. Business Planning Principles
(Marketing Management) Business 79
9. Management Accounting
Administration (Business Management) Business 22 10. Transportation Economics
(International Trade and
Transportation) Business 20
11. Video Production (Broadcast and
Media Communications: Television) Business 35
12. Systematic Inquiry Research (Nursing) Health Sciences 23 13. Sanitation for Food Processing (Food
Management) Health Sciences 13
14. 3D Computer Rendering for Interior
Design (Interior Design) Construction and the Environment 22
Of the 14 courses, four were from the School of Business, four from the School of Construction and the Environment, three from the School of Health Sciences, two from the School of
Manufacturing, Electronics and Industrial Processes, and one from the School of Computing and Academic Studies. No courses were selected from the School of Transportation. There was a 95% response rate for the selected students.
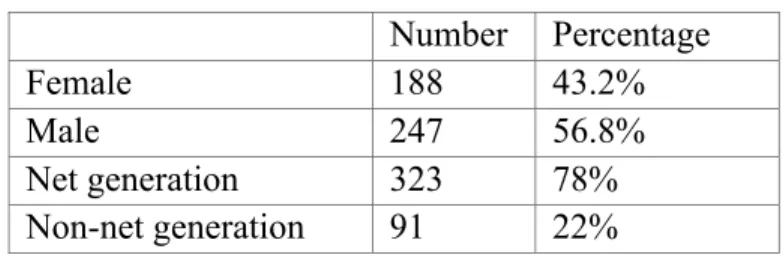
As Table 3 shows, males and net generation-aged students dominated the sample. The average age of the sample was 24.1 years.
Table 3: Gender and Age
Number Percentage Female 188 43.2% Male 247 56.8% Net generation 323 78% Non-net generation 91 22% Survey Findings
The sample was divided into net generation students (born in 1982 or later) and non-net generation students (born before 1982). There were 11 items on the survey dealing with net generation characteristics. As well, there were two items that sought to determine student preferences for communication with instructors and peers.
Net Generation Characteristics
T-tests and Mann Whitney tests were conducted to test for significance of generational differences in behaviour. Independent t-tests were used to test for significance of group differences when generation was the independent variable and specific generational
characteristics were the dependent variable. Mann-Whitney tests were used to test for group differences when ICT use was the dependent variable as data for ICT was ordinal, not interval. SPSS does not calculate an effect size for this test, so it was calculated manually by converting the z-score into r using the following equation (Rosenthal, 1991, p.19):
€
r = Z N
Effect size was calculated for t-tests using the following equation (Rosenthal, 1991, p.19):
r =
Comparison of the two groups on the 11 items revealed some small differences on a few items, but overall, no meaningful differences on any items were found. The following is a summary of the results for each of the 11 items, grouped by characteristic.
• Digitally literate
Item #1: I am comfortable using computers, the Internet and other information and communication technologies for a variety of purposes. (Item 20a)
On average, net generation students were just as comfortable (M=3.74, SD=0.56) as non-net generation students (M=3.74, SD=0.61) I n using computers, the Internet, and other
information and communication technologies for a variety of purposes. The difference between the two groups was not statistically significant t(396)=0.38, p>.05.
• Connected
Item #2: I feel like I am always connected to friends because of technologies such as cell phones and the Internet. (Item 16e)
On average, net generation students felt more connected (M=3.30, SD=0.84) to friends because of cell phones and the Internet than non-net generation students (M=2.94,
SD=0.99). This difference between the two groupswasstatistically significant t (408)=2.86, p<.05. This represented a small effect size r=.18. In other words, whether someone was net generation or not explained the 3.2% variance in how connected students felt to friends. • Multitasking
Item #3: I am used to doing several tasks at the same time. (Item 14e)
On average, net generation students were more used to multitasking (M=3.13, SD=0.83) than non-net generation students (M=2.86, SD=0.86). This difference between the two groups was statistically significant t(405)=2.86, p<.01. However, this represented a small effect size r=.14. In other words, whether someone was net generation or not explained the 2.0% variance about student multitasking.
• Experiential learning
Item #4: I prefer to learn by exploring and trying things out for myself. (Item14c)
On average, net generation students (M=3.14, SD=0.82) preferred to learn by exploring and trying things out for themselves more than non-net generation students did (M=3.08,
SD=0.83). This difference between the two groups was not statistically significant t(405))=0.69, p>.05.
• Structure
Item #5: I prefer to get clear instructions and information before I try something new. (Item 14d)
On average, net generation students (M=3.28, SD=0.79) preferred to get clear instructions and information less than non-net generation students did (M=3.34, SD=0.80). This difference between the two groups was not statistically significant t(407)= -0.41, p>.05.
• Social/group work
Item #6: I prefer to work in groups when doing my school work. (14aR)
On average, net generation students (M=2.14, SD=0.88) preferred to work in groups when doing school work more than non-net generation students did (M=1.87, SD=0.78). This difference between the two groups was statistically significant t(408)=2.56, p<.05. However, this represented a small effect size r=.13. In other words, whether someone was net
generation or not explained the 1.7% variance about students’ preference to work in groups. • Social
Item #7: I enjoy meeting new people. (20b)
On average, net generation students (M=3.44, SD=0.74) enjoyed meeting new people more than non-net generation students did (M=3.27, SD=0.75). This difference between the two groups was not statistically significant t(395)=1.64, p>.05.
Item #8: I enjoy talking about myself to people I meet. (20c)
On average, net generation students (M=2.81, SD=0.88) enjoyed talking about themselves to people more than non-net generation students (M=2.69, SD=0.95). This difference between the two groups was not statistically significant t(388)=1.00, p>.05.
• Goal-oriented
Item #9: I have clear goals in life. (20d)
On average, net generation students (M=2.97, SD=0.88) had clear goals in life less often than non-net generation students did (M=3.09, SD=0.80). This difference between the two groups was not statistically significant t(392)= -1.01, p>.05.
• Preference for text
Item #10: I enjoy reading. (20e)
On average, net generation students (M=2.78, SD=1.03 ) enjoyed reading less than non-net generation students did (M=3.10, SD=0.93). This difference between the two groups was statistically significant t(392)= -2.82, p<.05. However, this represented a small effect size, r=.14. In other words, whether someone was net generation or not explained the 2.0% variance about whether students enjoyed reading.
• Community-minded
Item #11: I get involved in projects and activities that make a difference to society. (20f) On average, net generation students (M=2.61, SD=0.95) got involved in projects and activities that make a difference to society less often than non-net generation students did (M=2.71, SD=0.99). This difference between the two groups was not statistically significant t (391)= -1.11, p>.05.
Communication Preferences
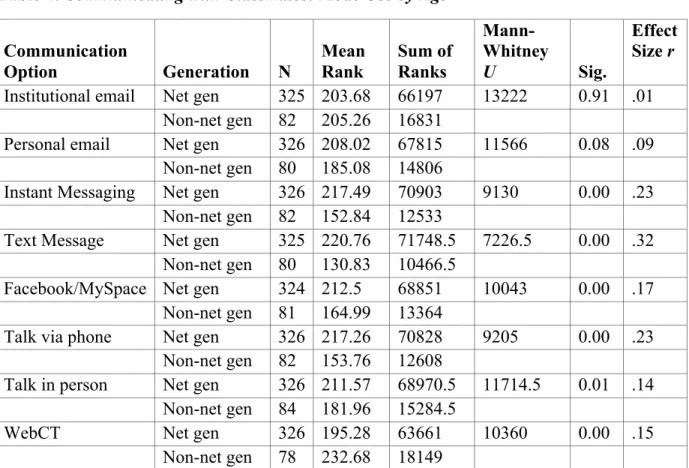
While we found no meaningful differences between net generation and non-net generation students on the characteristics drawn from the literature, we did find some interesting differences in communication preferences. There was no significant difference between net generation and non-net generation students in their pattern of email use. This was the case for institutional and personal email (p>.05, see Table 4). There was a significant association between generation and use of instant messaging, text messaging, Facebook, and WebCT. However, there was also a difference between the groups for options not always associated with modern ICTs: talking via phone and talking in person (p<.05). This complicates the claim that net generation students are more likely to use ICTs than non-net generation students. It is notable that the effect size of generation for ICT use was highest for synchronous communication options such as text messaging, phone, and instant messaging.
Table 4: Communicating with Classmates: Mode Use by Age Communication Option Generation N Mean Rank Sum of Ranks Mann-Whitney U Sig. Effect Size r Institutional email Net gen 325 203.68 66197 13222 0.91 .01
Non-net gen 82 205.26 16831
Personal email Net gen 326 208.02 67815 11566 0.08 .09 Non-net gen 80 185.08 14806
Instant Messaging Net gen 326 217.49 70903 9130 0.00 .23 Non-net gen 82 152.84 12533
Text Message Net gen 325 220.76 71748.5 7226.5 0.00 .32 Non-net gen 80 130.83 10466.5
Facebook/MySpace Net gen 324 212.5 68851 10043 0.00 .17 Non-net gen 81 164.99 13364
Talk via phone Net gen 326 217.26 70828 9205 0.00 .23 Non-net gen 82 153.76 12608
Talk in person Net gen 326 211.57 68970.5 11714.5 0.01 .14 Non-net gen 84 181.96 15284.5
WebCT Net gen 326 195.28 63661 10360 0.00 .15
However, descriptive statistics combined with frequency counts indicate that the most often used mode of communication with peers is talking in person, far higher than the most commonly used ICT, personal email (Table 5). In other words, net generation learners are not using any ICT more than face-to-face communication when interacting with peers. This is also the case for non-net generation.
Table 5: Communicating with Classmates: Frequency of Mode Use How often do you use each of the
following to communicate with classmates about courses?
Net gen
median Non-net gen median Overall median
a. Institutional email account 2 2 2
b. Personal email account 4 3 4
c. Instant messaging 3 1.5 3
d. Text message via cell phones 3 2 3
e. Facebook/MySpace 2 1 2
f. Talking via phone 3 3 3
g. Talking in person 4 4 4
h. WebCT 1 1 1
(Scale: Times used per month. 1=0 times; 2=1-4 times; 3=5-10 times; 4=more than 10 times)
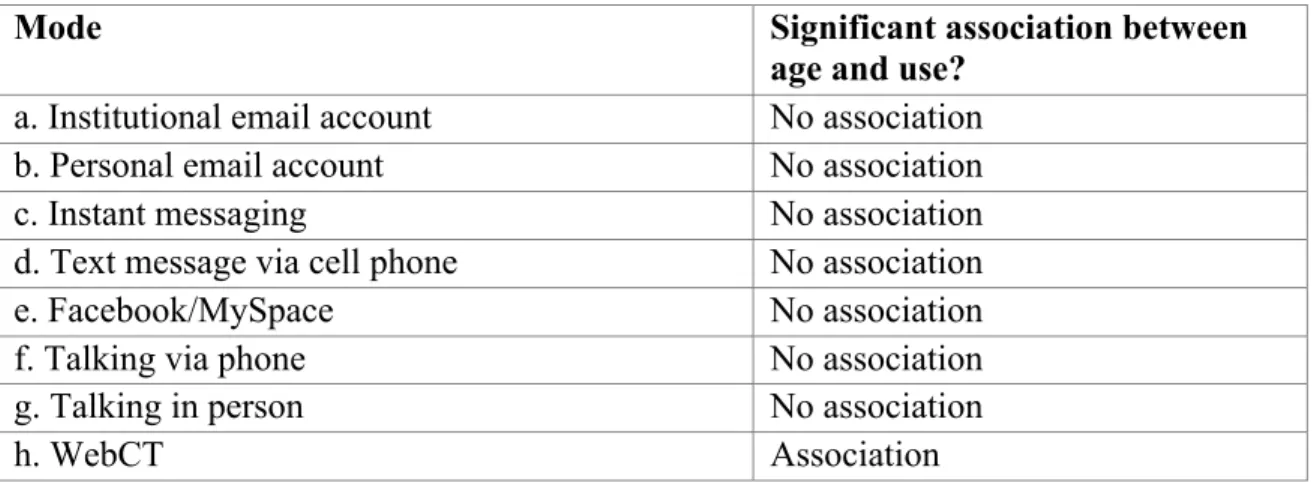
Net generation learners are more likely to use certain ICT-based applications with peers, but not with instructors. Only the use of WebCT to communicate with instructors was significantly associated with age, with non-net generation students indicating a higher frequency of use (1.77) than non-net generation students (1.40) (Tables 6 and 7).
Table 6: Communicating with Instructors: Mode Use by Age
Mode Significant association between
age and use? a. Institutional email account No association
b. Personal email account No association
c. Instant messaging No association
d. Text message via cell phone No association
e. Facebook/MySpace No association
f. Talking via phone No association
g. Talking in person No association
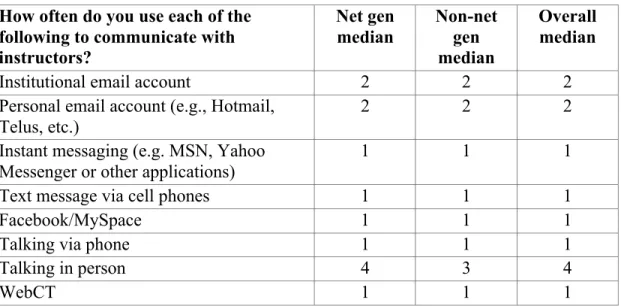
The descriptive statistics indicate that talking in person is by far the most common mode to communicate with instructors for both groups, although more so for net generation students than non-net generation (Table 7).
Table 7: Communicating with Instructors: Frequency of Mode Use How often do you use each of the
following to communicate with instructors? Net gen median Non-net gen median Overall median
Institutional email account 2 2 2
Personal email account (e.g., Hotmail, Telus, etc.)
2 2 2
Instant messaging (e.g. MSN, Yahoo Messenger or other applications)
1 1 1
Text message via cell phones 1 1 1
Facebook/MySpace 1 1 1
Talking via phone 1 1 1
Talking in person 4 3 4
WebCT 1 1 1
(Scale: Times used per month. 1=0 times; 2=1-4 times; 3=5-10 times; 4=more than 10 times)
Discussion
The findings of this study and our review of the literature add to a growing body of research that calls into question the prevailing discourse around the net generation and the notion that
generation can be used to explain and rationalize the use of ICTs in higher education. Our findings are consistent with those of other researchers (Bennett et al., 2008; Guo et al., 2008; Jones & Cross, 2009; Kennedy et al, 2007, 2009; Kvavik, 2005; Margaryan & Littlejohn, 2008; Pedró, 2009; Reeves & Oh, 2007; Selwyn, 2009) who also suggest that we need to be much more critical of the claims made about the distinctiveness of this generation and much more cautious about implementing changes to our postsecondary institutions based on these claims.
Generation Is Not the Issue, Context Is
One of the most significant findings of this study is that there is not a generational divide in the student body of this post-secondary institution, at least at the second year level. When compared according to the most commonly-cited net generation characteristics, students born before and after 1982 are not significantly different. This is not an argument for maintaining the status quo at post-secondary institutions. Rather, it means that we need to avoid the temptation to base our decisions on generational stereotypes and instead seek a deeper understandings of how students are using technology and what role it plays in learning and teaching in higher education
(Kennedy, Judd, Dalgarnot, & Waycott, 2010). When we combine the survey data with our
student interviews, it becomes clear that context is the key issue. We need to be providing faculty and students with ICTs that are specific to context and content. As an example, students told us
that some basic technology (hardware and software) needs were not being met while there was an institute-wide initiative to implement and promote the use of collaboration tools (e.g., blogs, communities of practice, e-portfolios) to develop communication, meta-cognition,
and interpersonal skills. While these skills are highly relevant to any graduate, the program structures and cohort models at the institution require 25 to 35 weekly classroom hours. As a result, some of these communication tools are largely used to duplicate existing face-to-face collaboration. As the teaching and learning needs vary widely across our institutions, future ICT investments should proceed on a program-by-program basis, based on the teaching and learning plans of the individual departments.
Enterprise vs. Non-institutionally Supported Technologies
Students felt the infrastructure that was put in place as a result of a recently-completed
institutional initiative was effective and necessary. However, we question whether some of the software provided to students is providing an appropriate return on investment since students are relying heavily on limited freely-available tools, rather than using some of the institutionally-provided ones. What this means is that we need to consider carefully investment in enterprise-wide ICT solutions in light of the growing availability and use of relatively easy-to-use web-based tools. These open source or free technologies (e.g., Web 2.0) offer much of the
functionality required for programs to offer student videos, demonstrations, and presentations. IT departments should recognize that these tools are needed, even though they might not integrate well with current systems and have no centralized support.2 Therefore, in order to provide an infrastructure that facilitates access to different applications, institutions might need to be open to a balanced selection of institutional tools and freely available tools.
Conclusion
While our study found that the use of some ICTs was ubiquitous (e.g., mobile phones, email, and instant messaging) we did not find any evidence to support claims that digital literacy,
connectedness, a need for immediacy, and a preference for experiential learning were characteristics of a particular generation of learners. Our findings are consistent with the conclusions of other researchers (Bennett et al., 2008; Guo et al., 2008; Jones & Cross, 2009; Kennedy et al., 2007, 2009; Kvavik, 2005; Margaryan & Littlejohn, 2008; Pedró, 2009; Reeves & Oh, 2007; Selwyn, 2009).
Additionally, given the diversity of programs at our post-secondary institutions, it is important to ensure that ICT decisions meet the specific needs at the program level and to resist the
temptation to make institute-wide ICT decisions that may not be appropriate for all programs. Above all, we need to move away from the simplistic and unsubstantiated generational
stereotyping and develop a more nuanced understanding of the issues associated with social and educational uses of ICTs in higher education.
2 We also acknowledge that in Canada, concerns about student information sitting on US-located servers have discouraged institutions from recommending many of the free Web 2.0 solutions, since it makes students vulnerable to the Patriot Act.
Phase two of our research will attempt to do this by focusing on the interplay between social and educational uses of ICTs.3 Our research will be expanded to a Canadian research-intensive university and a European online university and we will be investigating whether post-secondary students distinguish their social and educational use of ICTs and what impact, if any, their social use has on institutional learning environments. It will add to a growing body of research that is moving beyond simplistic dichotomies and helping to develop a more sophisticated
understanding of how different groups of postsecondary students are using technology (Bennett & Maton, 2010; Jones & Healing, 2010; Kennedy et al., 2010).
References
Bennett, S., & Maton, K. (2010). Beyond the ‘digital natives’ debate: Towards a more nuanced understanding of students’ technology experiences. Journal of Computer-Assisted
Learning, 26, 321-331.
Bennett, S., Maton, K., & Kervin, L. (2008). The ‘digital natives’ debate: A critical review of the evidence. British Journal of Educational Technology, 39(5), 775-786.
Bullen, M., Morgan, T., Belfer, K., & Qayyum, A. (2009). The net generation in higher
education: Rhetoric and reality. International Journal of Excellence in E-Learning, 2(1). Conway, L.S., Radford, M.L., & Williams, J.D. (2009). Engaging net gen students in virtual
reference: Reinventing services to meet their information behaviors and communication preferences. Unpublished paper.
Guo, R.X., Dobson, T., & Petrina, S. (2008). Digital natives, digital immigrants: An analysis of ICT competence in teacher education. Journal of Educational Computing Research, 38(3), 235-254.
Howe, N., & Strauss, W. (2000). Millenials rising: The next great generation. New York: Random House.
Jones, C., & Cross, S. (2009). Is there a net generation coming to University? In ALT-C 2009 “In dreams begins responsibility”: Choice, evidence and change, 8-10 September 2009,
Manchester, UK.
Jones, C., & Healing, G. (2010). Net generation students: Agency and choice and the new technologies. Journal of Computer-Assisted Learning, 26, 344-356.
Jones, S., & Fox, S. (2009). Generations online in 2009. Washington, DC: Pew Internet and American Life Project. Retrieved November 2009, from
http://www.pewinternet.org/Reports/2009/Generations-Online-in-2009.aspx
Kennedy, G., Dalgarnot, B., Gray, K., Judd, T., Waycott, J., Bennett, S., Maton, K., Krause, K., Bishop, A., Chang, R., & Churchward, R. (2007). The net generation are not big users of Web 2.0 technologies: Preliminary findings. In ICT: Providing choices for learners and learning. Proceedings ascilite Singapore 2007.
Kennedy, G., Dalgarnot, B., Gray, K., Judd, T., Waycott, J., Bennett, S., Maton, K., Krause, K., Bishop, A., Chang, R. & Churchward, R. (2009). Educating the net generation: A
handbook of findings for practice and policy. University of Melbourne.
Kennedy, G., Judd, T., Dalgarnot, B., & Waycott, J. (2010). Beyond natives and immigrants: exploring types of net generation students. Journal of Computer-Assisted Learning, 26, 332-343. 332..343
Kvavik, R.B. (2005). Convenience, communications, and control: How students use technology. In D.G. Oblinger, & J.L Oblinger (Eds.), Educating the net generation, pp. 7.1-7-20. Boulder, CO: EDUCAUSE.
Margaryan, A., & Littlejohn, A. (2008). Are digital natives a myth or reality?: Students’ use of technologies for learning. Unpublished paper.
Miles, M., & Huberman, M. (1994). Qualitative data analysis: An expanded sourcebook. Thousand Oaks, CA: Sage.
Oblinger, D.G., & Oblinger, J.L. (Eds.). (2005). Educating the net generation. Boulder, CO: EDUCAUSE.
Palfrey, J., & Gasser, U. (2008). Born digital: Understanding the first generation of digital natives. Philadelphia, PA: Basic Books.
Palfrey, J., Gasser, U., Simun, M., & Barnes, R.F. (2009). Youth, creativity and copyright in the digital age. International Journal of Learning & Media, 1(2), 79-97.
Pedró, F. (2009). New millennium learners in higher education: Evidence and policy implications. Paris: OECD-CERI.
Prensky, M. (2001a). Digital natives, digital immigrants. On the Horizon, 9(5). Prensky, M. (2001b ). Digital natives, digital immigrants, part II: Do they really think
differently? On the Horizon, 9(6).
Prensky, M. (2005). Listen to the Natives. Educational Leadership, 63(4), 8-13.
Reeves, T., & Oh, E. (2007). Generational differences. In J.M. Spector, M.D. Merrill, J. van Merrienboer, & M.P. Driscoll (Eds.), Handbook of research on educational
communications and technology, 295-303.
Rickes, P. C. (2009). Make way for the millenials!: How today’s students are shaping higher education spaces. Planning for Higher Education, 37(2), 7–17.
Rosenthal, R. (1991). Meta-analytic procedures for social research. Newbury Park, CA: Sage. Seely-Brown, J. (2002). Growing up digital. USDLA Journal, 16(2).
Selwyn, N. (2009). The digital native: Myth and reality. Aslib Proceedings: New Information Perspectives, 61(4), 364-379.
Tapscott, D. (1998). Growing up digital: The rise of the net generation. Toronto: McGraw-Hill. Tapscott, D. (2009). Grown up digital: How the net generation is changing your world. Toronto:
McGraw-Hill.
University College London (2008). Information Behaviour of the Researcher of the Future. Retrieved from http://www.ucl.ac.uk/infostudies/research/ciber/downloads/ggexecutive.pdf
Appendix A -‐ Student Interview Questions
1. Through what channels do you communicate with classmates? 2. Name four topics you communicate about?
3. Where are you when you communicate with classmates?
4. Describe what channels you use to communicate with your instructor?
5. Does the instructor require or encourage you to communicate with classmates? 6. When you have a problem or issue in your courses what do you do?
7. What communication options would help you learn in your courses?
8. If you could have anything for your program that would help you with your learning, what would it be?
Appendix B -‐ Net Generation Descriptors
Digitally Literate (DL)• Able to intuitively use a variety of IT devices and navigate the Internet. • Comfortable using technology but may have a shallow understanding • Visually literate
• More likely to use the Internet for research than a library Connected (C)
• The particular device may change but they are always connected Multitaskers (MT)
• The move quickly from one activity to another, sometimes performing several simultaneously
Need for Immediacy (I)
• They demand fast responses – more value on speed than accuracy Experiential (E)
• Prefer to learn by doing rather than being told what to do • Discovery learners
Social (S)
• Gravitate towards activities that involve social interaction • Open to diversity
• Social nature aligns with preference for team work Teamwork (TW)
• Prefer to learn and work in teams • Depend heavily on peers
Structure (ST)
• Goal-oriented
• Prefer structure over ambiguity Visual and Kinesthetic (VS)
• Prefer images over text
• Don’t like reading large amounts of text Community-minded (CM)
• Prefer to work on “things that matter”
Authors
Mark Bullen, Ph.D. is the Dean of the Learning and Teaching Centre at the British Columbia Institute of Technology in Vancouver, Canada. He is the project director for the Digital Learners in Higher Education research project and Editor of the Journal of Distance Education. Email: mark_bullen@bcit.ca.
Tannis Morgan, Ph.D. is an Educational Technology Specialist at the Justice Institute in Vancouver, Canada. She is the lead researcher for the Digital Learners in Higher Education research project (http://digitallearners.ca). Email: tmorgan@jibc.ca.
Adnan Qayyum, Ph.D. is a Senior Fellow at the University of Ottawa’s Centre on Governance. Email: aqayyum@uottawa.ca.