HAL Id: hal-01950825
https://hal.univ-lorraine.fr/hal-01950825
Submitted on 25 Apr 2019HAL is a multi-disciplinary open access archive for the deposit and dissemination of sci-entific research documents, whether they are pub-lished or not. The documents may come from teaching and research institutions in France or abroad, or from public or private research centers.
L’archive ouverte pluridisciplinaire HAL, est destinée au dépôt et à la diffusion de documents scientifiques de niveau recherche, publiés ou non, émanant des établissements d’enseignement et de recherche français ou étrangers, des laboratoires publics ou privés.
Single-shot multi-level all-optical magnetization
switching mediated by spin-polarized hot electron
transport
Satoshi Iihama, Yong Xu, Marwan Deb, Grégory Malinowski, Michel Hehn, J.
Gorchon, Eric Fullerton, Stéphane Mangin
To cite this version:
Satoshi Iihama, Yong Xu, Marwan Deb, Grégory Malinowski, Michel Hehn, et al.. Single-shot multi-level all-optical magnetization switching mediated by spin-polarized hot electron transport. Advanced Materials, Wiley-VCH Verlag, 2018, 30 (51), pp.1804004. �10.1002/adma.201804004�. �hal-01950825�
1 DOI: 10.1002/((please add manuscript number))
Article type: Communication
Single-shot multi-level all-optical magnetization switching mediated by spin-polarized hot electron transport
Satoshi Iihama, Yong Xu, Marwan Deb, Grégory Malinowski, Michel Hehn, Jon Gorchon, Eric E. Fullerton, and Stéphane Mangin*
((Optional Dedication))
Dr. S. Iihama, Dr. Y. Xu, Dr. M. Deb, Dr. G. Malinowski, Prof. M. Hehn, Dr. J. Gorchon, Prof. E. E. Fullerton, Prof. S. Mangin
Institut Jean Lamour, UMR CNRS 7198, Université de Lorraine, 54506 Vandoeuvre-lés-Nancy, France
E-mail: [email protected] Dr. S. Iihama
National Institute of Advanced Industrial Science and Technology (AIST), Tsukuba, Ibaraki, 305-8568, Japan
Prof. E. E. Fullerton
Center for Memory and Recording Research, University of California San Diego, 9500 Gilman Drive, La Jolla California 92093-0401, USA
Keywords: All-optical magnetization switching, magnetic recording, ultrafast transfer of angular momentum
All-optical ultrafast magnetization switching in magnetic material thin film without the assistance of an applied external magnetic field is being explored for future ultrafast and energy-efficient magnetic storage and memories. It has been shown that femto-second light pulses induce magnetization reversal in a large variety of magnetic materials. However, so far, only GdFeCo-based ferrimagnetic thin films exhibit magnetization switching via a single optical pulse. Here it is demonstrated the single-pulse switching of Co/Pt multilayers within a magnetic spin-valve structure ([Co/Pt] / Cu / GdFeCo) and further showed that the four possible magnetic configurations of the spin valve can be accessed using a sequence of single femto-second light pulses. Our experimental study reveals that the magnetization final state of the ferromagnetic [Co/Pt] layer is determined by spin-polarized hot electrons generated by the light pulse interactions with the GdFeCo layer. This work provides a new approach to
2
deterministically switch ferromagnetic layers and a pathway to engineering materials for opto-magnetic multi-bit recording.
The possibilities of deterministically manipulating magnetization solely with ultra-short light pulses have attracted a growing attention over the past ten years leading to
numerous ultra-fast and low-energy data storage concepts [1-9]. In 2007, all-optical switching
(AOS) of magnetization using femtosecond (fs) laser pulses in GdFeCo ferrimagnet was first discovered [1]. Later on, it was shown that the magnetization in GdFeCo can be switched by a
single fs-laser pulse independently of the light helicity [2,3] referred to as all-optical
helicity-independent switching (AO-HIS) and has only been observed for GdFeCo-based materials. The AO-HIS has been described by a thermal-driven switching mechanism attributed to the transient ferromagnetic like states and the transfer of angular momentum between Gd sub-lattice and FeCo sub-sub-lattice [2,3,17-20]. Very recently, this type of switching has not only been
observed in the case of light pulses but also for electron pulses [7-9]. In contrast to AO-HIS, in
the case of all-optical helicity-dependent switching (AO-HDS), the final state of
magnetization is determined by the circular polarization of the light. AO-HDS has been observed for a large variety of magnetic material such as ferrimagnetic alloy, ferrimagnetic multilayer, ferromagnet thin films and granular recording media [4,5,10-15]. However, so far
multiple pulses are necessary to fully deterministically switch the magnetization for AO-HDS
[10, 16]
. The use of single-pulse switching would be interesting because it is ultra-fast and energy-efficient, however restriction to Gd-based materials limits potential spintronic devices application. Furthermore, in order to move toward ultrafast-spintronic applications, one needs to study and understand the fundamental mechanism not only for single layers as it has been done in most study so far but also in more complex structures like spin valve structures, a key building block of modern spintronics. Selective magnetization switching in spin-valve
3
memories [21-23]. Here we demonstrate that the four possible magnetic configurations of a
magnetic spin-valve structure ([Co/Pt] / Cu / GdFeCo) shown schematically in Figure 1, where both layers are magnetically decoupled, can be accessed using a sequence of single femto-second light pulses. We show that a single laser pulse is able to switch the
magnetization of either the GdFeCo layer alone or the magnetizations of both GdFeCo and [Co/Pt] layers, depending on the optical pulse intensity. We attribute this magnetic
configuration control of the multilayer to, in part, a result of the ultrafast magnetization dynamics in spin-valve structure as well as ultrafast non-local transfer of angular momentum between layers [24-29]. Indeed, ultrafast quenching of magnetization in ferromagnetic or
ferrimagnetic layers creates spin-polarized hot electrons that propagate in the metallic spacer layer and transfer the angular momentum to the other magnetic layer. We believe the
switching of the [Co/Pt] layer results from a combination of optical excitation and the transfer of spin-polarized hot electron currents generated via the demagnetization of the GdFeCo layers.
Schematic illustration of the Ta (5 nm) /Gd23.3(FeCo)76.7 (5 nm) /Cu (9.3 nm) /[Co (0.6
nm)/Pt (1.0 nm)]4 /Ta (5 nm) /Glass substrate spin valve structure namely GdFeCo/Cu
/[Co/Pt] is shown in Figure 1a. The GdFeCo and [Co/Pt] layers exhibit perpendicular
magnetic anisotropy (PMA) and are magnetically separated by a 9.3-nm continuous Cu layer. The ferrimagnetic GdFeCo layer is FeCo rich at room temperature for this composition as the net magnetization of the alloy is parallel to the magnetization of FeCo sublattice and
antiparallel to the magnetization of the Gd sublattice. Using magnetic fields, four remanent magnetic configurations can be reached: Two configurations where the magnetization of the two layers are parallel P+ and P- when the two magnetizations are along the positive and negative field direction, respectively, and two configurations where the two magnetizations are antiparallel AP+ and AP- when the magnetization of the [Co/Pt] is along the positive and negative field direction, respectively. Figure 1b shows the magneto-optic Kerr effect (MOKE)
4
signal (K) as a function of the applied magnetic field (H) applied perpendicular to film plane.
The reversal that appears at low magnetic field is attributed to the GdFeCo reversal. This could be confirmed by the magnetization curves (See supporting information, sec A). Minor loops in blue and red in Figure 1b show that the two layers are magnetically decoupled (i.e. the minor loop is centered about zero applied field). In Figure 2 we show how the four remanent magnetic configurations (P+, AP+, AP- and P-) can be accessed using single 35-fs light pulses under zero applied field. Starting with a saturated sample in the P- state (left most configuration in Figure 2) one can switch both magnetic layers to the corresponding P+ state by sending a relatively intense pulse of 0.5 J where a region of roughly 30 m in diameter is reversed. Then exposing the sample to a moderate light pulse of 0.2 J only triggers the reversal of the GdFeCo magnetization putting the sample into the AP+ state. A second 0.2-J pulse again reverses the GdFeCo layer returning the system to the P+ state. Applying a 0.5-J then reverses both magnetic layers back to the original P- state. Finally, a 0.2-J pulse again reverses the GdFeCo layer yielding the AP- state. Somewhat surprisingly if the AP+ or AP- state is excited by a 0.5-J pulse only the GdFeCo layer is reversed and the [Co/Pt] layer remains unperturbed. To summarize, 0.5-J pulses switch both layers from P+ to P- and back again while 0.2 J pulses are sufficient to only switch the GdFeCo layer leaving the [Co/Pt] layer unperturbed. The P+ to P- and P-to-P+ transitions clearly shows that the [Co/Pt] layer can be switched by a single 35 fs pulse.
In order to get insights on the energy and configurational changes of the switching of the [Co/Pt]/Cu/GdFeCo structures, we have studied the influence of the pump energy within the beam spot. Indeed, since the beam intensity follows a Gaussian profile, we can explore, with a single pulse, a range of energies. In Figure 3a starting from an initial state in the P+ configuration, 35-fs single pulses of a given pump energy irradiated the sample consecutively with a typical time between two pulses of 2 seconds. The same experiment has been
5
reproduced for 8 different pump energies ranging from 0.08 J to 0.36 J (three energies are shown in Figure 3a). The spatial distribution of the magnetic configuration has been measured after each pulse. From Figure 3a we can define up to four threshold radii (ri) measured from
the center of the optical excitation region whose values depend on the pump energy and allow us to distinguish five different responses to the initial magnetic configuration and light
interaction. The radius r1 corresponds to the threshold for the onset of AO-HIS of the GdFeCo
layer while leaving the [Co/Pt] layer unperturbed. Thus for r>r1 the magnetization is
unperturbed by the light while for r<r1 the GdFeCo layer reverses its magnetization with each
pulse from P+ to AP+ or AP+ to P+. This can be seen clearly for 0.08 J pulses in Figure 3a where only within the radius r=r1 there is a switching of the GdFeCo. For increasing pulse
energy of 0.2 J pulses (Figure 3a) two new radii appear. With each pulse the outer ring corresponds to r1 where only the GdFeCo reverses. Near the center of the beam there is a
region for r<r3 where both the GdFeCo and [Co/Pt] layers reverse from P+ to P- and then
back with each pulse. There is a second radius, r2, where starting from P+ the GdFeCo magnetization is switched between r1>r>r3 to the AP+ configuration after the first pulse. Then
for subsequent pulses there is a narrow region r2>r>r3 where the light has no effect with
further pulses. For yet higher pulse energy such as 0.32 J as shown in Figure 3 where for r<r4 the energy density is sufficiently high that both layers demagnetize forming random
domain states. From images like those shown in Figure 3a and corresponding line scans that quantify the magnetic contrast both the magnetic configurations and corresponding threshold radii can be determined and are shown in Figure 3b for various pulse energies. The solid lines in Figure 3b are fits assuming a Gaussian spatial distribution of the pump energy, i.e., Fpi =
2Ep / (w02) exp(-2ri2/w02), where Fpi, ri and 2w0 are threshold fluence, threshold radius, and
1/e2 spot size, respectively. From the fitting of our experimental data (from Figure 3b), we are
6
11.8mJ/cm2 and Fp4 = 28.4 mJ/cm2 that correspond to radii r1 through r4. We note that the
range of fluences for which single shot switching is observed is the highest ever reported. In our films switching fluences cover a whole decade (3.1 – 28.4 mJ/cm2), whereas in GdFeCo
single layers doubling the AOS threshold fluence would lead to multidomain creation [30, 31].
We believe this behavior might be related to the higher Curie temperature of the [Co/Pt] layer and the dynamic coupling between the layers.
For low fluences (r1>r>r2) we observe that only the GdFeCo switches with each pulse
as has been observed as in single GdFeCo films. At these fluences the [Co/Pt] layer is not sufficiently excited to be perturbed. This behavior is expected from the extensive literature of AO-HIS on GdFeCo films [32]. The narrow region r2>r>r3 where once the sample is in the
antiparallel configuration no changes occur after next pulse indicates some subtle interplay between layers that prefers the antiparallel configuration. However, we do not have a detailed explanation of this interaction at present. We will focus much of the remainder of the
discussion on the region r3>r>r4 where we observe the simultaneous reversal of the GdFeCo
and [Co/Pt] layers by single pulses. We believe that in this region, GdFeCo is switching by itself via the AO-HIS but in addition there is single shot deterministic reversal of the ferromagnetic layer through a combination of optical excitation and a dynamic coupling mechanism between the layers. We will discuss possible coupling mechanisms below and discuss additional experiments to test the validity of these mechanisms. The first possible explanation is the presence of a static exchange coupling, which has been reported to be at the origin of the single shot AOS of a [Co/Pt] bilayer coupled to a GdFeCo layer [34]. In this study
the final state of the [Co/Pt] layer is determined by the sign of the interlayer coupling. For our samples, the minor loops of the GdFeCo magnetization reversal show no measurable
exchange coupling between the two magnetic layers (Figure 1). The fact that we can
independently switch the GdFeCo layer and the energy required for AO-HIS of the GdFeCo layer from P+ to AP+ and from AP+ to P+ are identical, also suggest there is no exchange
7
coupling via the Cu interlayer present in our sample. Moreover we observed this single-shot AO-HIS of the GdFeCo and [Co/Pt] layers for up to a 30 nm-thick Cu spacer layer (See supporting information, sec C) where no exchange coupling is expected. A second possible explanation could be the presence of some dipolar coupling. While there are no dipolar fields arising from an ideal uniformly magnetized film, there are dipolar fields generated from domain states and inhomogeneous magnetization. For circular domains such as shown in Figure 2 the dipolar fields are strongest at the boundary and may be responsible for the narrow region r2>r>r3. To explore the role of dipolar coupling we studied samples with a
different GdFeCo alloy concentration such that the net magnetization of the ferrimagnetic GdFeCo would be in the direction of the transition-metal sublattice (i.e. “FeCo-rich”) or the rare-earth sublattice (i.e. “Gd-rich”). Figure 4 shows AOS in spin-valve structure of the FeCo-rich sample (Figure 4a) and the Gd-rich (Figure 4b) GdFeCo. Since MOKE measurements are mostly sensitive to FeCo sublattice moment (as opposed to the total moment), magnetic contrast values in antiparallel configuration of the magnetization are higher than that in parallel configuration in Gd-rich GdFeCo as shown in Figure 4b. Single-shot AO-HIS of the GdFeCo and [Co/Pt] layers is observed for both GdFeCo concentrations. However, the final magnetic state reached by the GdFeCo and [Co/Pt] layers corresponds to a parallel alignment of the FeCo sublattice and the Co/Pt magnetizations independently of the GdFeCo concentration and net magnetization as shown schematically in Figure 4c and d. Thus, dipolar interactions (at room temperature) are unlikely to explain the final state of the magnetization of the GdFeCo and [Co/Pt] layers. Having ruled out indirect and dipolar coupling we believe the final state of the ferromagnetic [Co/Pt] layer is determined by spin-polarized hot electrons generated by the light pulse interactions with the GdFeCo layer in addition to local heating of the [Co/Pt] layer. To explain the single pulse AO-HIS of the [Co/Pt] layer, we assumed that the ultrafast laser heating after interacting with the GdFeCo layer is generating a hot electron spin polarized current (i.e. superdiffusive spin currents)
8
parallel to Gd moment which will ultimately transfer its angular momentum to the [Co/Pt] layer and in combination with optical excitation determines the final state of magnetization (schematically shown in Figure 4c and 4d.). Recent experiments on spin currents generated by the interaction between a light pulse and a GdFeCo layer [29] observed, as a function of time
after optical excitation, first positive and then negative spin generations in the conduction band. The authors attribute the positive part of the spin generation to demagnetization of the transition-metal sublattice and estimate the majority of the negative spin is coming from slower demagnetization of the Gd sublattice. They also suggest a potential contribution to the negative spin current to the spin-dependent Seebeck effect. Both contributions result in the longer time spin currents being parallel to the Gd sublattice, as shown in Figure 4c and 4d, that will be transferred and absorbed by the [Co/Pt] layer. If the Co/Pt layer is excited by both the optical pulse and the hot electrons [33], the transfer of the hot electron angular momentum
could be sufficient to determine the final state of the magnetization of [Co/Pt] as it cools. Thus, it is expected that the longer time spin-polarized currents that are parallel to the Gd sublattice will determine the final state. At the same time, GdFeCo layer is also reversed as a result of the AO-HIS mechanism. Thus, even though the [Co/Pt] layer final state
magnetization is determined by the Gd sublattice, the FeCo sublattice and the [Co/Pt] magnetization are always parallel in the final state. This mechanism might also contribute to the recent single shot AOS demonstrated in Co/Gd bilayer system [35], in which non-local
transfer of angular momentum might reverse the magnetization of Co since the exchange interaction between Gd and Co exists only at the interface.
To explore the validity of the above spin polarized hot electron transport model to explain the [Co/Pt] magnetization switching, we have grown several spin-valve structures where we have modified the Cu interlayer. First GdFeCo / Cu / [Co/Pt] spin-valve have been grown with different Cu thicknesses ranging from 5 nm to 80 nm. Single-pulse [Co/Pt] switching could be observed up to 30-nm Cu interlayers. The loss of the [Co/Pt] reversal is
9
attributed to the limited spin-diffusion length of the hot electrons in the Cu layer, estimated to 13 nm by Schellekens et al.[26]. On other way to reduce the spin polarization of the hot
electrons consists to insert 1 to 5 nm Pt layer in the Cu spacer layer (shown schematically in
Figure 5a). Pt has a significantly shorter spin diffusion length than Cu and is on the order of a
few nanometers [26]. While the average magnetic properties of samples with and without Pt
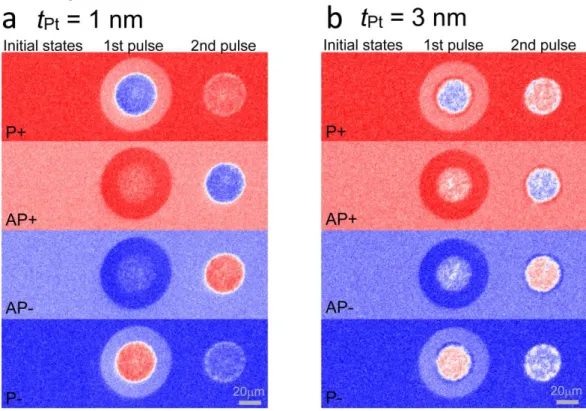
layer are very similar (see magnetization curves in supporting information, sec. E) it is expected that the Pt layers will depolarize the hot electrons before reaching the [Co/Pt] layer. This should limit the ability to deterministically switch the [Co/Pt] layer. Figure 5b shows the MOKE images after the irradiation of fs-laser pulses for the samples with different Pt
thicknesses tPt. For tPt = 0 nm we see the P+ to P- and back to P+ switching as described
earlier and the [Co/Pt] layer is 100% switched. With increasing Pt thickness, the magnetic contrast around center of the spot gradually decreases indicating the samples are transitioning from AO-HIS to demagnetizing with increasing Pt. By analyzing the magnetic contrast values in details, we plot in Figure 5c the change in magnetization of the [Co/Pt] layer with
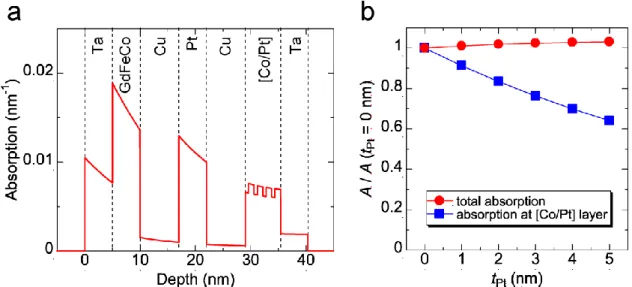
increasing Pt thickness. We see that with increasing Pt thickness the samples transition from deterministic switching to demagnetization where the GdFeCo and [Co/Pt] layers break into small domains. The decay length obtained by exponential fitting was ~ 2 nm as shown in Figure 5c (See detail of the analysis in supporting information, sec. F). This decay length is consistent with a previous report for the spin diffusion length of hot electron in Pt layer (3 nm) [23,26] and is quite a bit shorter than penetration depth of light in Pt layer ~ 13 nm
calculated from imaginary part of the refractive index of 2.85+i 4.96 for the wavelength of 800 nm. Thus, the magnetization of [Co/Pt] after irradiation of fs-laser pulse changes with increasing Pt thickness more drastically than the change in light absorption and temperature. Moreover, we also performed light absorption calculation. It was found that total light
absorption (i.e., temperature rising) in the sample was not changed significantly with different Pt thickness, (see supporting information, Sec. G). Based on these studies, we conclude that
10
magnetization switching of the GdFeCo / Cu / [Co/Pt] is mediated by spin-polarized hot electron transport.
In this study, we demonstrated that we could access the four remanent magnetic configurations in GdFeCo / Cu / [Co/Pt] spin-valve structures, without applied field using single femto-second pulses. After studying the effect of the GdFeCo concentration and of the spacer layer we concluded that the final state of the magnetization switching of [Co/Pt] is mediated by spin-polarized hot electron transport. The final state is consistent with the
expected spin polarization being parallel to Gd moment in the GdFeCo layer due to the slower demagnetization of Gd compared to the one of the FeCo spins. These hot spin-polarized electrons transfer their angular momenta which, in combination with optical heating, are able to deterministically switch the magnetization of [Co/Pt]. This conclusion is supported by inserting Pt layers inside the Cu spacer layer of the spin-valve to depolarize the optically-induced spin current resulting in the thermal demagnetization of the [Co/Pt] layer. This work provides a new approach to deterministically single-pulse switch ferromagnetic layers and a pathway to engineering materials for opto-magnetic multi-bit recording using spin-valve structures.
Experimental Section
Sample preparation:
All samples were prepared by physical vapor deposition. Base pressure used to deposit multilayer film was about 1×10⁻⁷ Torr. Basic stacking structures used in this study for the
spin-valve structure are as follows,
Glass sub. / Ta (5) / [Pt(1)/Co(0.6)]4 / Cu (tCu) / Gdx(Fe87Co13)1-x (5) / Ta (5), (thickness in
nm)
Cu thickness was varied from 5 nm to 80 nm. Gd composition was varied from 21.9% to 27.2%.
11
Stacking structures of the reference sample for the Pt layer insertion are as follows,
Glass sub. / Ta (5) / [Pt(1)/Co(0.6)]4 / Cu (7) / Pt (tPt) / Cu (7) / Gd23.3Fe66.7Co10 (5) / Ta(5).
AOS measurement:
Ti: sapphire fs laser source and regenerative amplifier are used for the pump laser beam in AOS measurement. Wavelength, pulse duration and repetition rate of the fs laser are 800 nm, 35 fs, and 5 kHz, respectively. The 1/e2 spot size 2w0 is ~50 µm. No external magnetic field is
applied during measurement. Four different magnetic configurations are realized by using permanent magnet before taking images. MOKE images were obtained from the other side of the film. LED light source with the wavelength of 628 nm was used for taking MOKE images.
Data analysis:
The movies of MOKE images during irradiation of fs-laser pulses were taken by CCD camera. After taking movies, the images of each slice were subtracted from the initial slice of the movies to exclude the background of the images. And then, average brightness values of the initial images were added to each subtracted images. The median and mean filters were applied to reduce noise in the images. The gray scale brightness values were converted to the color (lower, middle, and higher values are converted to blue, white, and red).
Supporting Information
Supporting Information is available from the Wiley Online Library or from the author.
Acknowledgements
S. I. would like to thank the Japan Society for the Promotion of Science (JSPS) for a Grant-in-Aid for JSPS Fellows (28-7881). We would like to thank Crosby Chang and Stephane Suire for their assistance of SQUID-VSM measurement. This work was supported by the ANR-NSF Project, 13-IS04-0008-01, COMAG, 15-CE24-0009 UMAMI and by the ANR-Labcom Project LSTNM, by the Institut Carnot ICEEL for the project « Optic-switch » and
12
Matelas and by the French PIA project ‘Lorraine Université d’Excellence’, reference ANR-15-IDEX-04-LUE. Experiments were performed using equipment from the TUBE. Davm funded by FEDER (EU), ANR, Région Grand Est and Metropole Grand Nancy.
Received: ((will be filled in by the editorial staff)) Revised: ((will be filled in by the editorial staff)) Published online: ((will be filled in by the editorial staff))
References
[1] C. D. Stanciu, F. Hansteen, A. V. Kimel, A. Kirilyuk, A. Tsukamoto, A. Itoh, Th. Rasing, Phys. Rev. Lett. 2007, 99, 047601
[2] I. Radu, K. Vahaplar, C. Stamm, T. Kachel, N. Pontius, H. A. Durr, T. A. Ostler, J. Barker, R. F. L. Evans, R. W. Chantrell, A. Tsukamoto, A. Itoh, A. Kirilyuk, Th Rasing, A. V. Kimel, Nature 2011, 472, 207
[3] T. A. Ostler, J. Barker, R. F. L. Evans, R. W. Chantrell, U. Atxitia, O. Chubykalo-Fesenko, S. El Moussaoui, L. Le Guyader, E. Mengotti, L. J. Heyderman, F. Nolting, A. Tsukamoto, A. Itoh, D. Afanasiev, B. A. Ivanov, A. M. Kalashnikova, K. Vahaplar, J. Mentink, A. Kirilyuk, Th. Rasing, A. V. Kimel, Nat. Commun. 2012, 3, 666
[4] S. Mangin, M. Gottwald, C. -H. Lambert, D. Steil, V. Uhlír, L. Pang, M. Hehn, S. Alebrand, M. Cinchetti, G. Malinowski, Y. Fainman, M. Aeschlimann, E. E. Fullerton, Nat. Mater. 2014, 13, 286
[5] C. -H. Lambert, S. Mangin, B. S. D. Ch. S. Varaprasad, Y. K. Takahashi, M. Hehn, M. Cinchetti, G. Malinowski, K. Hono, Y. Fainman, M. Aeschlimann, E. E. Fullerton, Science
2014, 345, 1337
[6] A. Stupakiewicz, K. Szerenos, D. Afanasiev, A. Kirilyuk, A. V. Kimel, Nature 2017, 542, 71
[7] R. B. Wilson, J. Gorchon, Y. Yang, C. -H. Lambert, S. Salahuddin, J. Bokor, Phys. Rev. B 2017, 95, 180409(R)
13
[8] Y. Xu, M. Deb, G. Malinowski, M. Hehn, W. Zhao, S. Mangin, Adv. Mater. 2017, 29, 1703474
[9] Y. Yang, R. B. Wilson, J. Gorchon, C. -H. Lambert, S. Salahuddin, J. Bokor, Sci. Adv.
2017, 3, e1603117
[10] M. S. El Hadri, P. Pirro, C. -H. Lambert, S. Petit-Watelot, Y. Quessab, M. Hehn, F. Montaigne, G. Malinowski, S. Mangin, Phys. Rev. B 2016, 94, 064412
[11] D. Sander, S. O. Valenzuela, D. Makarov, C. H. Marrows, E. E. Fullerton, P. Fischer, J. McCord, P. Vavassori, S. Mangin, P. Pirro, B. Hillebrands, A. D. Kent, T. Jungwirth, O. Gutfleisch, C. G. Kim, A. Berger, J. Phys. D: Appl. Phys. 2017, 50, 363001
[12] M. S. El Hadri, M. Hehn, G. Malinowski, S. Mangin, J. Phys. D: Appl. Phys. 2017, 50, 133002
[13] Y. K. Takahashi, R. Medapalli, S. Kasai, J. Wang, K. Ishioka, S. H. Wee, O. Hellwig, K. Hono, E. E. Fullerton, Phys. Rev. Appl. 2016, 6, 054004
[14] M. O. A. Ellis, E. E. Fullerton, Roy W. Chantrell, Sci. Rep. 2016, 6, 30522
[15] M. S. El Hadri, M. Hehn, P. Pirro, C. -H. Lambert, G. Malinowski, E. E. Fullerton, S. Mangin, Phys. Rev. B 2016, 94, 064419
[16] J. Gorchon, Y. Yang, J. Bokor, Phys. Rev. B 2016, 94, 020409(R)
[17] N. Bergeard, V. López-Flores, V. Halté, M. Hehn, C. Stamm, N. Pontius, E. Beaurepaire, C. Boeglin, Nat. Commun. 2014, 5, 3466
[18] C. E. Graves, A. H. Reid, T. Wang, B. Wu, S. de Jong, K. Vahaplar, I. Radu, D. P. Bernstein, M. Messerschmidt, L. Müller, R. Coffee, M. Bionta, S. W. Epp, R. Hartmann, N. Kimmel, G. Hauser, A. Hartmann, P. Holl, H. Gorke, J. H. Mentink, A. Tsukamoto, A. Fognini, J. J. Turner, W. F. Schlotter, D. Rolles, H. Soltau, L. Strüder, Y. Acremann, A. V. Kimel, A. Kirilyuk, Th. Rasing, J. Stöhr, A. O. Scherz, and H. A. Dürr, Nat. Mater. 2013, 12, 293
14
[19] S. Wienholdt, D. Hinzke, K. Carva, P. M. Oppeneer, U. Nowak, Phys. Rev. B 2013, 88, 020406(R)
[20] J. H. Mentink, J. Hellsvik, D. V. Afanasiev, B. A. Ivanov, A. Kirilyuk, A. V. Kimel, O. Eriksson, M. I. Katsnelson, Th. Rasing, Phys. Rev. Lett. 2012, 108, 057202
[21] R. Lavrijsen, J.-H. Lee, A. Fernández-Pacheco, D. C. M. C. Petit, R. Mansell, R. P. Cowburn, Nature 2013, 493, 647
[22] S. Zhang, J. Zhang, A. A. Baker, S. Wang, G. Yu, T. Hesjedal, Sci. Rep. 2014, 4, 6109 [23] H. Suto, K. Kudo, T. Nagasawa, T. Kanao, K. Mizushima, R. Sato, Jpn. J. Appl. Phys.
2016, 55, 119204
[24] G. Malinowski, F. D. Longa, J. H. H. Rietjens, P. V. Paluskar, R. Huijink, H. J. M. Swagten, B. Koopmans, Nat. Phys. 2008, 4, 855
[25] D. Rudolf, C. La-O-Vorakiat, M. Battiato, R. Adam, J. M. Shaw, E. Turgut, P. Maldonado, S. Mathias, P. Grychtol, H. T. Nembach, T. J. Silva, M. Aeschlimann, H. C. Kapteyn, M. M. Murnane, C. M. Schneider, P. M. Oppeneer, Nat. Commun. 2012, 3, 1037 [26] A. J. Schellekens, K. C. Kuiper, R. R. J. C. de Wit, B. Koopmans, Nat. Commun. 2014, 5, 4333
[27] G. -M. Choi, B. -C. Min, K. -J. Lee, D. G. Cahill, Nat. Commun. 2014, 10, 1038 [28] G. -M. Choi, C. -H. Moon, B. -C. Min, K. -J. Lee, D. G. Cahill, Nat. Phys. 2015, 11, 576
[29] G. -M. Choi, B. -C. Min, Phys. Rev. B 2018, 97, 014410
[30] K. Vahaplar, A. M. Kalashnikova, A. V. Kimel, S. Gerlach, D. Hinzke, U. Nowak, R. Chantrell, A. Tsukamoto, A. Itoh, A. Kirilyuk, Th. Rasing, Phys. Rev. B 2012, 85, 104402 [31] J. Gorchon, R. B. Wilson, Y. Yang, A. Pattabi, J. Y. Chen, L. He, J. P. Wang, M. Li, J. Bokor, Phys. Rev. B 2016, 94, 184406
15
[33] N. Bergeard, M. Hehn, S. Mangin, G. Lengaigne, F. Montaigne, M. L. M. Lalieu, B. Koopmans, G. Malinowski, Phys. Rev. Lett. 2016, 117, 147203
[34] J. Gorchon, C. -H. Lambert, Y. Yang, A. Pattabi, R. B. Wilson, S. Salahuddin, J. Bokor, Appl. Phys. Lett. 2017, 111, 042401
[35] M. L. M. Lalieu, M. J. G. Peeters, S. R. R. Haenen, R. Lavrijsen, B. Koopmans, Phys. Rev. B 2017, 96, 220411(R)
Figure 1. (Properties of the GdFeCo / Cu / [Co/Pt] spin valve structure. a) Schematic
representation of the Glass sub. / Ta (5 nm) / Gd23.3(FeCo)76.7 (5 nm) / Cu(9.3 nm) / [Co(0.6
nm)/Pt(1.0 nm)]4 / Ta (5 nm) sample where the GdFeCo and [Co/Pt] magnetic layers have
perpendicular anisotropy and are separated by a 9.3 nm thick Cu layer. b) Normalized magneto-optic Kerr rotation (K) as a function of the magnetic field (H) applied
perpendicularly to the film plane. Red and blue open symbols are minor loops corresponding to the magnetization reversal of GdFeCo which are perfectly centered around the zero field axis.)
16
Figure 2. (Multi-level switching of GdFeCo /Cu/[Co/Pt] spin valve structure using 35-fs
single light pulses. a) Experimental demonstration of magnetic configurations obtained consecutively after single optical pulses. Starting from a saturated state P- (resp. P+) a single intense pulse (0.5 J) induce a switching into the P+ state (resp. P-). A single moderate light pulse (0.2 J) induces a transition from a P- state (resp. P+) to an AP- (resp. AP+) state. All the measurements demonstrate that the GdFeCo layer switching can be obtained using a single moderate light pulse (0.2 J) whereas the complete switching of both layer is obtained for single intense pulse (0.5 J). b) Normalized averaged magnetic contrast obtained along the black line shown in a), averaged within the width of 5 m. The four different levels allow to quantitatively define the four magnetic states (P+, P-, AP+, AP-) which can be reached using a sequence of single 35-fs laser pulses.)
17
Figure 3. (Single pulse all-optical switching as a function of pump energy for Gd23.3(FeCo)76.7
/ Cu(9.3) / [Co/Pt]4 sample. a) MOKE images obtained after four consecutive 35-fs pulses of
various pump energy (the time between two pulses is 2 seconds). The same experiments has been repeated with different pump energy ranging from 0.08 to 0.36 J. b) Threshold radius (ri) such that for r> r1: there is no light effect, r1>r>r2 AO-HIS single pulse GdFeCo layer
reversal. r2>r>r3 Starting from P+ the GdFeCo magnetization is switched once to reach an
AP+ configuration and then light pulses have no effect; r3>r>r4: AO-HIS is observed for both
18
Figure 4. (All-Optical Switching in GdFeCo / Cu / [Co/Pt] spin-valves with different GdFeCo
concentration. a) AOS results for FeCo-rich Gd23.3(FeCo)76.7 (5 nm)/ Cu(9.3 nm) / [Co/Pt]4
sample. b) AOS results for Gd-rich Gd26.4(FeCo)73.6 (5 nm) / Cu(10 nm) / [Co/Pt]4 sample.
Since MOKE is more sensitive to the FeCo magnetic sublattice, the magnetic contrast signals of AP+ states are larger than that of P+ state in the case of spin-valve sample with Gd-rich GdFeCo. Schematic illustration of spin-polarized hot electron transport induced
magnetization switching for c), FeCo-rich and d), Gd-rich GdFeCo / Cu / [Co/Pt] spin valve structures.)
19
Figure 5. (Evolution of the Co/Pt magnetization switching on Pt insertion layers in Cu. a)
Schematic illustration of the role of the Pt spin scattering layer inserted in the Cu spacer layer. b) MOKE images after irradiation of consecutive single fs-laser pulses on GdFeCo / Cu (7) / Pt (tPt) / Cu (7) / [Co/Pt] samples and GdFeCo / Cu (15) / [Co/Pt] sample (tPt = 0 nm). c) The
changes in magnetization of [Co/Pt] around the center of the spot estimated from magnetic contrast are plotted as a function of Pt thicknesses. 100 % indicates completely switched and 50 % indicates full demagnetization. Solid curve is an exponential fitting and decay length obtained from fitting is ~ 2 nm.)
20
The table of contents entry should be 50−60 words long, and the first phrase should be
bold. The entry should be written in the present tense and impersonal style.
Keyword: All-optical magnetization switching, magnetic recording, ultrafast transfer of angular momentum
Satoshi Iihama, Yong Xu, Marwan Deb, Grégory Malinowski, Michel Hehn, Jon Gorchon, Eric E. Fullerton, and Stéphane Mangin*
Single-shot multi-level all-optical magnetization switching mediated by spin-polarized hot electron transport
ToC figure ((Please choose one size: 55 mm broad × 50 mm high or 110 mm broad × 20 mm high. Please do not use any other dimensions))
21
((Supporting Information can be included here using this template))
Copyright WILEY-VCH Verlag GmbH & Co. KGaA, 69469 Weinheim, Germany, 2016.
Supporting Information
Single-shot multi-level all-optical magnetization switching mediated by spin-polarized hot electron transport
Satoshi Iihama, Yong Xu, Marwan Deb, Grégory Malinowski, Michel Hehn, Jon Gorchon, Eric E. Fullerton, and Stéphane Mangin*
Table of contents A. Magnetic property
B. Details of magnetic contrast vs radius plot and evaluation of threshold radius C. Cu thickness dependence of AOS in GdFeCo / Cu / [Co/Pt] spin valve D. Details of the magnetic contrast analysis for the complex domain structure E. Comparison of magnetic property of samples with and without Pt layer
F. Details of the analysis for the results with different Pt spin scattering layer thickness G. Absorption profile calculation with different Pt thickness
A. Magnetic property
Figure S1a shows out-of-plane magnetization curves for a GdFeCo / Cu / [Co/Pt] spin-valve sample and a single [Co/Pt] film. It was found that the smaller coercive field in the spin-valve
corresponds to the magnetization reversal of GdFeCo. In addition, the signal of the GdFeCo layer is larger for the MOKE than the magnetometry measurements as MOKE is mainly sensitive to the magnetic signal of the transition metal (FeCo) sublattice whereas magnetometry measures the total magnetization. Figure S1b shows in-plane magnetization curve for the single [Co/Pt] film. Saturation field is about 7 kOe, and saturation magnetization is ~ 1450 emu/cm3 (volume was estimated by total thickness of Co). The effective uniaxial perpendicular magnetic anisotropy constant was evaluated to be ~ 5 Merg/cm3.
Figure S1: a, Magnetic curves for GdFeCo / Cu / [Co/Pt] sample and [Co/Pt] sample measured by SQUID-VSM. b, In-plane magnetization curve for [Co/Pt] film. Slope correction was performed to subtract diamagnetic contribution of the substrate and sample holder.
22
B. Details of magnetic contrast vs radius plot and evaluation of threshold radius
To quantify the radius dependence of the magnetic configuration, magnetic contrast vs radius analysis was performed as mentioned in the main text. The magnetic contrast along the green circles (as shown in Fig. S2a) were taken and averaged. Figure S2b shows averaged magnetic contrast are plotted as a function of radius. The threshold radius r1 and r2 was evaluated by the intercept between
after 1st pulse and . The r3, r4 were evaluated by the intercepts between after
1st pulse and (r3) or (r4). Each value evaluated are shown
in Figure S2b and S2c.
Figure S2: a, Analysis of magnetic contrast vs radius plot. Magnetic contrast values along the green circle lines with different radius of the circles were taken and averaged. b, c, Averaged magnetic contrast values plotted as a function of radius (b: Ep = 0.32 J, c: Ep = 0.16 J). b and c show the magnetic contrast when initial configuration is P+ and AP+, respectively.
C. Cu thickness dependence of AOS in GdFeCo / Cu / [Co/Pt] spin valve
Figure S3a shows AOS in the case of a spin-valve structure with a 30-nm-thick Cu layer. Even for the two magnetic layers separated by 30-nm-thick Cu layer, single shot switching in both layer was observed. Figure S3b shows threshold radius of the two domains (reversing GdFeCo only and both layer) are plotted as a function of pump energy. The energy required for switching both layer
increasing with increasing Cu thickness. The threshold energy density for reversing GdFeCo layer and both layers are plotted as a function of Cu thickness as shown in Fig. S3c. Although threshold energy density for reversing the GdFeCo layer doesn’t significantly depend on Cu thickness, threshold energy density for reversing both layer increases with increasing Cu thickness. One possibility to explain this
23
trend is the spin depolarization in the Cu layer. Another possibility is that light absorption in [Co/Pt] decreases with increasing Cu thickness and then the temperature rising required for switching increases with increasing Cu thickness.
Figure S3: a, AOS results in Gd23.3(FeCo)76.7 / Cu(30) / [Co/Pt]4 sample. b, Threshold radius for reversing GdFeCo (open symbols) and both layer (solid symbols) in Gd23.3(FeCo)76.7 / Cu(tCu) / [Co/Pt]4 sample. Solid curves are the fitted results assuming Gaussian distributions of pump laser. c, Threshold energy densities for reversing GdFeCo (open symbols) and both layer (solid symbols) obtained from the analysis shown in b are plotted as a function of Cu thickness. Different shapes of the symbols represent the values taken at different spot sizes. Solid curves are the guide to eye representing experimental trends.
24
D. Details of the magnetic contrast analysis for the complex domain structure
Figure S4 shows complexity of the domain structure obtained in the case that initial configuration is antiparallel for FeCo-rich GdFeCo / Cu / [Co/Pt] spin-valve structure. Figure S4a shows MOKE images obtained after irradiation of several fs-laser pulses. Single-shot switching of only the GdFeCo layer around rim of the spot and complicated domain structure around center of the spot were observed. The color of the contrast around center of the spot is either dark red or dark blue, which means magnetic configuration is either P+ or P-. Figure S4b shows that magnetic contrast where different areas are analyzed. The magnetic contrast values are plotted as a function of time and shown in bottom panel. At area A, the first fs-pulse reversed the GdFeCo parallel to [Co/Pt] and then both layer reversed in parallel after the subsequent pulses. Also, in the areas B and C, the second and third fs-pulse reversed the GdFeCo parallel to [Co/Pt] and then both layer reversed after the
subsequent pulses. This means that once magnetic configuration becomes parallel, both layer reversed in parallel subsequently.
Figure S4: Analysis of the magnetic contrast for different areas when the magnetic configuration is initially antiparallel. a, AOS results for Gd23.3(FeCo)76.7 / Cu (9.3) / [Co/Pt] sample. MOKE images after irradiation of several fs-laser pulses when initial magnetic configuration is antiparallel. b, Magnetic contrast values of three different areas A, B, and C, which are around center of the spot are analyzed. Magnetic contrast inside green circle area are plotted as a function of time as shown in bottom panel.
25
E. Comparison of magnetic property for samples with and without Pt layer
Figure S5 shows comparison of magnetization curves for spin-valve structure with and without the Pt spin-scattering layer. Magnetization curves for the two samples are nearly identical.
Figure S5: Comparison of magnetization curves for GdFeCo / Cu (9.3) / [Co/Pt] and GdFeCo / Cu (7) / Pt (3) / Cu (7) / [Co/Pt] samples.
F. Details of the analysis for the results with different Pt spin scattering layer thickness
Figure S6a and S6b shows comparison of AOS for the sample with 1-nm-thick Pt and 3-nm-thick Pt layers inserted. In the case of sample with the 1-nm-3-nm-thick Pt insertion layer, the magnetic contrast around center of the spot is similar to single shot switching. On the other hand, in the case of sample with 3-nm-thick Pt layer inserted, the magnetic contrast around center of the spot indicated the sample has demagnetized into random domains.
26
MOKE images after several fs-laser pulses are irradiated for the sample with b, 1 nm and c, 3 nm thick Pt layer insertion. Pump energy used in this experiment is 0.4 J.
In order to clarify the difference in behavior among the samples with different Pt thickness, the change of magnetic contrast after irradiation of fs-laser pulse is analyzed. Figure S7 shows magnetic contrast values are plotted as a function of radius for the samples with different Pt
thicknesses. The maximum change of the magnetic contrast after irradiation of fs-laser pulse decreases with increasing Pt thickness. The change of magnetic contrast is coming from reversing the GdFeCo and reversing the [Co/Pt] or from demagnetizing the [Co/Pt] layer. The normalized change in magnetization of [Co/Pt] is estimated and plotted in Fig. S8. Figure S8a shows the maximum change of magnetic contrast ( ) evaluated, amplitude of GdFeCo layer ( ) and [Co/Pt] layer ( ). Assuming completely reversing the GdFeCo layer enables us to quantify the magnetization change in the [Co/Pt] layer. Figure S8b shows the change in magnetization of the [Co/Pt] layer plotted as a function of Pt thickness. The vertical scale of 1 indicates completely reversing and 0.5 indicates demagnetizing. The exponential trend with increasing Pt thickness was observed, which corresponds with the expected spin-polarization decays in the Pt layers. The spin diffusion length was evaluated by the exponential fit, which is found to be ~ 2 nm.
Figure S7: Average magnetic contrast values as a function of radius with different Pt layer thicknesses. Solid lines are the average values of the initial states and symbols are the values after 1st fs-laser pulse is irradiated.
Figure S8: a, Illustration of maximum change of magnetic contrast ( ) and the amplitude of magnetic contrast for GdFeCo layer ( ) and [Co/Pt] layer ( ). To estimate how large magnetization in [Co/Pt] is changed, GdFeCo is assumed to be completely reversed. b, Normalized maximum change of magnetic contrast in [Co/Pt] after irradiation of fs-laser pulse in GdFeCo / Cu / Pt (tPt) / Cu / [Co/Pt] sample. 1 indicates [Co/Pt] completely reversed and 0.5 indicates demagnetizing. Green solid curve is exponential fit.
27
G. Absorption profile calculation with different Pt thickness
To estimate the change in the temperature rise with different Pt thicknesses in the spin valve structure, light absorption calculations using the transfer matrix method were performed. Figure S9a shows light absorption calculated for the spin valve structure with a 5-nm-thick Pt layer inserted. Light intensity is absorbed by Pt layer, therefore light absorption and temperature rise is expected for
different Pt thicknesses. Figure S9b shows normalized light absorption as a function of Pt thickness. Whereas light absorption at [Co/Pt] layer decreases with increasing Pt thickness, total light absorption does not depend significantly on the Pt thickness. Temperature at slow time scale is determined by total light absorption rather than light absorption at [Co/Pt] because temperature is already equilibrated due to metallic multilayer. Thus, almost the same total light absorption with different Pt thickness does not explain the Pt thickness dependence of magnetic contrast.
Figure S9: a, Light absorption profile calculated for spin valve structure in the case that Pt layer is inserted in the Cu layer. b, Normalized light absorption as a function of Pt layer thickness. Total absorption and absorption at [Co/Pt] layer are shown.
![Figure 1. (Properties of the GdFeCo / Cu / [Co/Pt] spin valve structure. a) Schematic representation of the Glass sub](https://thumb-eu.123doks.com/thumbv2/123doknet/14439374.516633/16.892.113.745.534.875/figure-properties-gdfeco-valve-structure-schematic-representation-glass.webp)


![Figure S3: a, AOS results in Gd 23.3 (FeCo) 76.7 / Cu(30) / [Co/Pt] 4 sample](https://thumb-eu.123doks.com/thumbv2/123doknet/14439374.516633/24.892.157.733.175.936/figure-aos-results-gd-feco-co-pt-sample.webp)
![Figure S4 shows complexity of the domain structure obtained in the case that initial configuration is antiparallel for FeCo-rich GdFeCo / Cu / [Co/Pt] spin-valve structure](https://thumb-eu.123doks.com/thumbv2/123doknet/14439374.516633/25.892.187.714.422.1004/figure-complexity-structure-obtained-initial-configuration-antiparallel-structure.webp)
![Figure S8: a, Illustration of maximum change of magnetic contrast ( ) and the amplitude of magnetic contrast for GdFeCo layer ( ) and [Co/Pt] layer ( )](https://thumb-eu.123doks.com/thumbv2/123doknet/14439374.516633/27.892.124.772.746.1024/figure-illustration-maximum-magnetic-contrast-amplitude-magnetic-contrast.webp)