HAL Id: hal-00079716
https://hal-insu.archives-ouvertes.fr/hal-00079716
Submitted on 13 Jun 2006
HAL is a multi-disciplinary open access
archive for the deposit and dissemination of sci-entific research documents, whether they are pub-lished or not. The documents may come from teaching and research institutions in France or abroad, or from public or private research centers.
L’archive ouverte pluridisciplinaire HAL, est destinée au dépôt et à la diffusion de documents scientifiques de niveau recherche, publiés ou non, émanant des établissements d’enseignement et de recherche français ou étrangers, des laboratoires publics ou privés.
Can electrical resistivity tomography describe soil
structure evolution?
Anatja Samouëlian, Guy Richard, Isabelle Cousin, Alain Tabbagh, Ary
Bruand
To cite this version:
Anatja Samouëlian, Guy Richard, Isabelle Cousin, Alain Tabbagh, Ary Bruand. Can electrical resis-tivity tomography describe soil structure evolution?. 16th Triennial Conference of the ISTRO, 2003, Brisbane, Australia. �hal-00079716�
Can electrical resistivity tomography describe soil structure
evolution?
Anatja Samouëlian1, Guy Richard2, Isabelle Cousin1, Alain Tabbagh3, Ary Bruand4 1) INRA, Unité de Science du Sol Orléans, BP 20619, 45166 Olivet, Cedex, France
2) INRA, Unité d’Agronomie, Rue Fernand Christ, 02007 Laon Cedex, France ([email protected]) 3) UMR 7619 “Sisyphe”, Case 105, 4 place Jussieu, 75005 Paris, France
4) ISTO, Université d’Orléans, Géosciences, BP 6759, 45067 Orléans Cedex 2, France.
ABSTRACT
Variations of soil structure is significant for the understanding of water and gas transfer in soil profiles. In the context of arable land, soil structure can be compacted due to either agriculture operation (wheel tracks), or hardsetting and crusting processes. As a consequence, soil porosity is reduced which may lead to decrease water infiltration and to anoxic conditions. Porosity can be increased by cracks formation due to swelling and shrinking phenomenon.
We present here a laboratory experiment based on soil electrical characteristics. Electrical resistivity allows a non destructive three dimensional and dynamical analysis of the soil structure. Our main objective is to detect cracks in the soil. Cracks form an electrical resistant object and the contrast of resistivity between air and soil is large enough to be detected.
Our sample is an undisturbed soil block 240mm*170mm*160mm with an initial structure compacted by wheel traffic. Successive artificial cracks are generated. Electrodes built with 2 mm ceramic cups permit a good electrical contact at the soil surface whatever its water content. They are installed 15 mm apart and the electrical resistivity is monitored using a dipole-dipole and wenner multi-electrodes 2D imaging method which gives a picture of the subsurface resistivity.
The interpreted resistivity sections show the major soil structure. The electrical response changes with the cracks formation. The structure information extracted from the electrical map is in good agreement with the artificially man-made cracks. These first results demonstrate the relevance of high resolution electrical imaging of the soil profile. Further experiments need to be carried out in order to monitor natural soil structure evolution during wetting-drying cycles.
INTRODUCTION
In the context of arable land, soil can be compacted by traffic, hardsetting and crusting processes. With new agricultural practices such as reduced tillage or no-tillage, soil structure mostly regenerates via natural processes: such as swelling and shrinking or freezing and thawing phenomenon or biological process. We are focusing the study on the soil structure evolution due to climate effects, and more especially the ability for soil to recover porosity by crack formation due to desiccation period.
Up to now, a soil cracking patterns was commonly characterized either by measuring manually in the field the crack geometry that forms at the soil surface (Blackwell et al., 1985; Ringrose-Voase and Sanidad, 1996), or automatically by using two-dimensional image analysis (Bullock and Murphy, 1980; Hallaire, 1984; Hartge and Bachmann, 2000).
The assumption was usually made that the soil consists in simple structures which justified the use of either a one- or a two- dimensional analysis. However the tensile and shearing stresses vary in a soil with depth. Therefore, the cracks network analysis requires a non-destructive tool. Electrical resistivity tomography is a geophysical investigation tool which permitted a temporal and spatial monitoring of the subsurface. This technique is already useful in geological survey (Griffiths and Barker, 1993), in environmental works (Chambers et al., 1999; Guérin et al., 2002), in hydrological context (Dannowski and Yaramanci, 1999; Göbel et al., 1993; Hagrey and Michaelsen, 1999; Kemna et al., 2002). Electrical resistivity depends on the electrical resistivity of : the solid constituent, the fluid content, the porosity and the degree of saturation. Common electrical resistivity surveys are used to detect object larger than decimetric.
The aim of this study is to adapt this method to detect small heterogeneities related to the soil structure and especially to cracks developing. Since a crack is air-filled, it should be easy to detectable due to infinite electrical resistivity of air. We presented here a first experiment to test the feasibility of electrical resistivity tomography to detect resistivity anomalies at the centimeter scale.
MATERIEL AND METHOD
SOIL
The experiments were conducted in the laboratory on an air-dried loess soil block (24 × 17 × 16 cm3
) (19.2% clay, 73.9% silt 3.8% sand 1.7 organic substances). It exhibited a massive structure resulting from severe compaction by wheels traffic in wet condition. We used intentionally a simplistic physical crack model because this experiment consists in a feasibility test. The initial stage A, was without crack. Then artificially cracks were made by sawing the soil block. A 2-mm crack width with respectively varying depths, 1 to 4 cm deep, constitute four cracking stage (B to E). The experiment lasted 4 hours and the volumetric water content remained stable 0.09 cm3cm-3, the variation of resistivity was then related to the structure evolution.
PRINCIPLE OF 2D ELECTRICAL PROFILE ACQUISITION
The electrical resistivity methods allow a current to circulate through the ground between a pair of electrodes (A and B), and the potential difference is measured with another pair of electrodes (M and N), providing a measure of the electrical resistance of the soil system. The depth of penetration increases with the distance between the AB electrodes. Apparent electrical resistivity is calculated as the product of the electrical resistance (measured between the M and N electrodes), with the geometrical factor (specific to the electrode array configuration AMNB). When the soil is not electrically homogeneous, the current lines and equipotential surfaces are distorted.
In order to detect the crack presence, position, and extension, electrical resistivity measurement were done by a 2D vertical pseudo-section. As shown figure 1, we disposed in-line 15 electrodes separated by a constant distance “a” equal to 1.5 cm. The first four electrodes 1-2-3-4 were connected as AMNB (station1). A second measurement was performed by disconnecting and moving the array by a single electrode spacing “a” along the in-line measurement. Then a second profile was recorded by connecting the electrodes in a way that AMNB occupied electrode position 1-3-5-7 (station2). The array was then moved by a 2a spacing. The process was repeated by increasing the electrode spacing each time by a multiple N of the initial electrode spacing. The resistivity values were attributed to the geometric centre point of the experimental array.
Figure 1. The measurement sequence for building up a pseudo-section.
MICRO-ELECTRODES DEVELOPMENT
The low quality contact between the drying soil and classical electrodes and the unusually close electrode spacing imposed to build up new small electrode (2 mm diameter). The Cu/CuSO4 electrode
permitted a wet punctual electrical contact with the soil surface.
RESISTIVITY INVERSION
The apparent resistivity measurement corresponds to a volumetric measurement and provides qualitative information. Quantitative information requires a mathematical inversion of the apparent resistivity into interpreted resistivity. We used an automated inversion software Res2Dinv (Loke and Barker, 1996) for the numerical inversion. Res2dinv is the software the widely used in electrical survey (Acworth, 1999; Andrews et al., 1995; Olayinka and Yaramanci, 2000)
RESULTS
APPARENT RESISTIVITY PSEUDO-SECTION
For a better demonstration of the expected increased in resistivity caused by the crack formation between the electrode 8 and 9, the apparent resistivity anomaly [1] was calculated.
(
)
A a, A a, X a, aρ
ρ
ρ
ρ
=
−
Δ
[1]
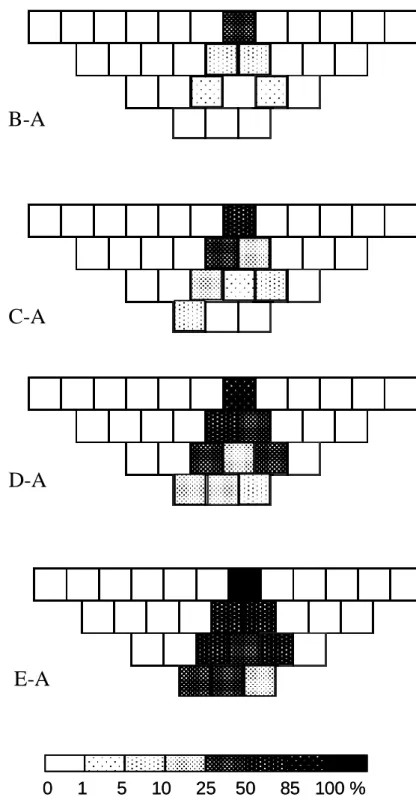
ρa,A and ρa,X were respectively the apparent resistivity of the initial stage A and the apparent resistivity of the different cracking growing stages (X = B, C, D or E). Figure 2 displayed the resulting maps for the 4 pseudo-section. All the pseudo-sections showed a similar distribution. The positive anomaly varied from 38 to 104 % directly above the crack respectively for the stages B and E. Not only the amplitude of the apparent resistivity anomalies increased when the crack grew but also its downward extension. The classical reversed V-shape corresponded to a vertical discontinuity. Outside the crack area the electrical current was not disturb.
RESISTIVITY INVERSION: QUANTITATIVE INTERPRETATION
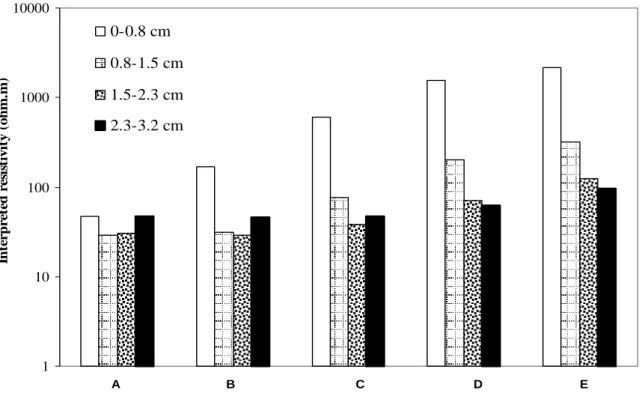
The inversion was conducted in order to obtain the interpreted resistivity section. Five iterations were enough to derive a model distribution with a root mean square error lower than 5%. The initial stage A was relatively homogeneous with a soil resistivity equal to 37 Ωm. The stages B to E clearly show an area of higher electrical resistivity between the electrode 8 and 9 from 168 up to 2185 Ωm. As the crack grew, the electrical resistivity increased too. As shown on the figure 3 the highest heterogeneity amplitude was located at 0-0.8cm depth. The second layer (0.8-1.5cm) increased by 10% between the stage B and E. Beyond the 1.5cm depth layer, the resistivity remained stable. The first layer was the most sensitive to the crack growing up. The lateral variation was negligible. For the initial stage, the
resistivity remained stable between electrode 8 to electrode 13. Then directly above the crack, between the electrode 8 and 9, the electrical resistivity increased as the cracks depth increased. The electrical resistivity from electrode 10 to 13 decreased and reaches the mean values corresponding to the initial stage. The electrical resistivity contrast between the soil and the crack was abrupt.
Figure 2 : Apparent resistivity pseudo-section for the stage A, B, C, D and E; crack location is between the electrode 8 and 9.
0 1 5 10 25 50 85 100 %
0 1 5 10 25 50 85 100 %
B-A
B-A
C-A
D-A
D-A
E-A
Figure 3: Interpreted resistivity variation between the electrodes 8 and 9 during the following cracking stages.
DISCUSSION
The range of interpreted resistivity measurement varied from 48 to 2185 Ωm and was attributed to the artificial crack. The crack is filled with air and represented a resistant structure in terms of electrical prospecting. Compared to electrical survey of water infiltration (Göbel et al., 1993; Michot et al., 2000; Zhou et al., 2001), the range of interpreted resistivity varied from low resistivity 10 Ωm, corresponding to wet condition, to 200 Ωm for dry condition.
The electrodes enable efficient electrical monitoring in dry soil. Although the shortest inter-electrodes spacing, the principle of point source electrical measurement was respected owing to the wet punctual contact.
The interpreted resistivity sections revealed the presence of high resistivity contrast in a vertical zone located at the position of the crack. The highest resistivity was recorded in the top 1.5cm depth. Both position and orientation were well done by the inversion. Nevertheless the downward extension was not obtained. These results lead us to reconsider the inversion model: abrupt and strong resistivity gradients combined with elongated and small structure can not be resolved. Indeed the numerical resolution of the mathematical algorithms is based on a regular mesh and smoothness condition.
CONCLUSION
This first experimentation confirms the interest of the use of electrical resistivity imaging in order to detect heterogeneities in the soil structure. At this scale of experiment, the resistivity contrast is enough sensitive for monitoring a crack system. The electrical signature of the cracks is well recognized in the profile. The new electrodes with ceramic cup enable correct electrical measurements at this scale.
During the four cracking stages B, C, D and E the change of interpreted electrical signature of the crack has significant effect on the first 1.5 cm depth. The actual interpreted data did not allow predicting the depth of the crack.
1 10 100 1000 10000 In terp ret ed r es is ti v it y ( o h m .m ) 0-0.8 cm 0.8-1.5 cm 1.5-2.3 cm 2.3-3.2 cm A B C D E
The actual model RES2DINV does not totally succeed in detecting abrupt structure geometry variations and strong electrical resistivity gradients. The result confirms the need of future works concerning the inversion of the apparent resistivity data.
Moreover a detailed analysis of a natural crack network requires a three-dimensional electrical resistivity set-up.
REFERENCES
Acworth, R.I. 1999. Investigation of dryland salinity using the electrical image method. Australian
Journal of Soil Research 37, 623-636.
Andrews, R.J., R. Barker, and M.H. L. 1995. The application of electrical tomography in the study of the unsatured zone in chalk at three sites in Cambridgeshire, United Kingdom. Hydrogeoloy
Journal 3, 17-31.
Blackwell, P.S., M.A. Ward, R.N. Lefevre, and D.J. Cowan. 1985. Compaction of a swelling clay soil by agricultural traffic ; effects upon conditions for growth of winter cereals and evidence for some recovery of structure. Journal of Soil Science 36, 633-650.
Bullock, P., and C.P. Murphy. 1980. Toward the quantification of soil structure. Journal of
Microscopy 120, 317-328.
Chambers, J., R. Oglivy, P. Meldrum, and J. Nissen. 1999. 3D resistivity imaging of buried oil- and tar-contaminated waste deposits. European Journal of Environmental and Engineering
Geophysics 4, 3-15.
Dannowski, G., and U. Yaramanci. 1999. Estimation of water content and porosity using radar and geoelectrical measurements. European Journal of environmental and engineering geophysics
4, 71-85.
Göbel, B., J. Michaelsen, E. Danckwardt, S.A. Hagrey, C. Meyer, G. Petzold, C. Stolte, and R. Thierbach. 1993. Geophysikalische Methoden zur Erfassung von Wasserverteilungen and Wassertransportvorgängen in Böden. Mitteilgn. Dtsch. Bodenkundl. Gesellsch. 72, 111-114. Griffiths, D.H., and R.D. Barker. 1993. Two-dimensional resistivity imaging and modelling in areas of
complex geology. Journal of Applied Geophysics 29, 211-226.
Guérin, R., C. Pannissod, M. Thiry, Y. Benderitter, A. Tabbagh, and S. Huet-Tailanter. 2002. La friche industrielle de Mortagne-du-Nord (59) -III- Approche méthodologique d'étude géophysique non-destructive des sites pollués par des eaux fortement minéralisées. Bulletin
Societe Géologique France 173, 471-477.
Hagrey, S.A.a., and J. Michaelsen. 1999. Resistivity and percolation study of preferential flow in vadose zone at Bokhorst, Germany. Geophysics 64, 746-753.
Hallaire, V. 1984. Evolution des reseaux de fissure lors du retrait d'un sol argileux. Compte rendu du colloque Fonctionnement hydrique et comportement des sols AFES 1984, 323-327.
Hartge, K.H., and Bachmann. 2000. Angles between cracks developed at primary shrinkage of finegrained soil material. Int. Agrophysics 14, 43-51.
Kemna, A., J. Vanderborght, B. Kulessa, and H. Vereecken. 2002. Imaging and characterisation of subsurface solute transport using electrical resistivity tomography (ERT) and equivalent transport models. Journal of Hydrology 267, 125-146
Loke, M.H., and R.D. Barker. 1996. Rapid least-squares inversion of apparent resistivity pseudosections using a quasi-Newton method. Geophysical Prospecting 44, 131-152.
Michot, D., A. Dorigny, and Y. Benderitter. 2000. Mise en évidence par résistivité électrique des écoulements préférentiels et de l'assèchement par le maïs d'un calcisol de Beauce irrigué.
C.R.Acad.Sci. 332, 29-36.
Olayinka, A.I., and U. Yaramanci. 2000. Assessment of the reliability of 2D inversion of apparent resistivity data. Geophysical Prospecting 48, 293-316.
Ringrose-Voase, A.J., and W.B. Sanidad. 1996. A method for measuring the development of surface cracks in soils : application to crack development after lowland rice. Geoderma 71, 245-261. Zhou, Q.Y., J. Shimada, and A. Sato. 2001. Three-dimensional spatial and temoral monitoring of soil