HAL Id: ineris-00976236
https://hal-ineris.archives-ouvertes.fr/ineris-00976236
Submitted on 9 Apr 2014HAL is a multi-disciplinary open access archive for the deposit and dissemination of sci-entific research documents, whether they are pub-lished or not. The documents may come from teaching and research institutions in France or abroad, or from public or private research centers.
L’archive ouverte pluridisciplinaire HAL, est destinée au dépôt et à la diffusion de documents scientifiques de niveau recherche, publiés ou non, émanant des établissements d’enseignement et de recherche français ou étrangers, des laboratoires publics ou privés.
Semi-automatic detection and localization of
microseismicity induced by a ”salt dissolution provoked”
cavity collapse
Jannes Kinscher, Isabelle Contrucci, Pascal Bernard, Anne Mangeney,
Jack-Pierre Piguet, Pascal Bigarre
To cite this version:
Jannes Kinscher, Isabelle Contrucci, Pascal Bernard, Anne Mangeney, Jack-Pierre Piguet, et al.. Semi-automatic detection and localization of microseismicity induced by a ”salt dissolution provoked” cavity collapse. 4. Passive seismic workshop ”Optimizing development of unconventional reservoirs”, Mar 2013, Amsterdam, Netherlands. �ineris-00976236�
Title : Semi-automatic detection and localization of microseismicity
induced by a shallow “salt dissolution provoked” cavity collapse
Authors : Jannes Kinscher (1), Isabelle Contrucci (1), Pascal Bernard (2), Anne Mangeney
(2), Jack-Pierre Piguet (3), Pascal Bigarre (1)
(1) INERIS, Direction des Risques du Sol et du Sous-Sol, Unité Auscultation et Surveillance
Géotechnique et Géophysique, Ecole des Mines, Campus ARTEM CS14234, 54042 Nancy
cedex, France
(2) IPGP, 1, rue Jussieu - 75238 Paris cedex 05, France
(3)INPL, Ecole des Mines, Campus ARTEM CS14234, 54042 Nancy cedex, France
Natural underground cavities, active or abandoned mine workings, particularly when they are shallow, can provoke large scale land subsidence and collapses attended by catastrophic social-economic impacts. The potential of passive microseismic monitoring to prevent such disasters was already indicated by several studies. Nonetheless, to further improve monitoring reliability a better
understanding of associated seismicity is inevitable. In this context, within a large multi-parameter research project at Cerville-Buissoncourt in Lorraine, France, the growth of a single, shallow, about 150 m diameter salt cavity created by salt dissolution mining was surveyed from 2004 until 2009 when the cavity reached its critical size and a ”controlled” collapse was initiated. During the experiment, a large microseismic data set was recorded by a triggered, high resolution geophone monitoring system. Initial processing and data inspection reveal very unusual seismic signals mainly appearing in complex swarming sequences (Mercerat et al., 2010; Contrucci et al., 2011). To resolve spatio-temporal characteristics of associated seismicity we developed an semi-automatic seismic event detection and localization algorithm adressing these abnormal signal characteritics. The detector design is based on a spectral envelope function calculated for each seismogram. By this function, coherent signals are distinguished from signals comprising rather randomly distributed frequency proportions as noise or CODA waves. First application tests demonstrated highly improved event detection results when analysing seismic events of highly varying size and duration occurring in a swarming sequence. In addition, we localized the detected seismic events using inter-station amplitude ratios as introduced by Battaglia and Aki (2003) and Taisne et al. (2011). Within this approach, hypocenter source inversion relies on the decay of seismic wave amplitudes along the source-receiver path. As a result, no troublesome a priori phase segmentation is needed and the entire data set can be processed. To calibrate the local seismic attenuation law we used ~700 seismic events with known hypocenter locations found by previous studies (Klein et al., 2011). The final optimized localization algorithm sufficienty constrained the tendency of actual hypocenter source location in the cavity region. Taken all together, our detection and localization strategy provides an appropriate first order approximation to study spatio-temporal attributes of seismicity from huge data sets associated with seismic signals of unknown or complex signature as observed for Cerville-Buissoncourt.
Introduction
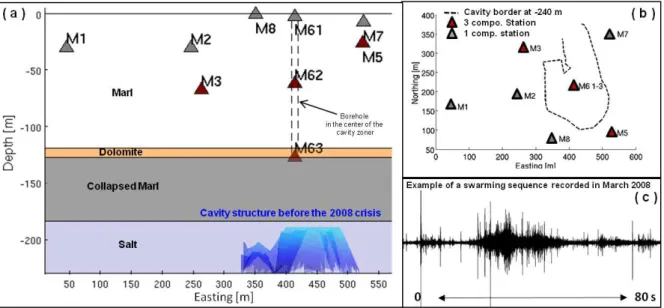
Natural underground cavities, active or abandoned mine workings, particularly when they are shallow, can provoke large scale land subsidence and collapses attended by catastrophic social-economic impacts. The potential of passive microseismic monitoring to prevent such disasters is widely known. Nonetheless, to further improve monitoring reliability, a better understanding of associated seismicity is necessary. In this context, within a large multi-parameter research project at Cerville-Buissoncourt in Lorraine, France, launching in 2004, the growth of a single, shallow, about 150 m diameter salt cavity was surveyed, created by salt dissolution mining. In February 2009, the cavity reached a critical size and a collapse was initiated by controlled brine pumping. During the experiment, a large microseismic data set of > 50.000 event files was recorded. The microseismic network was constituted by a triggered, high resolution 40 Hz geophone monitoring system including five 1-component and four 3-1-component stations (Klein et al., 2008) (Figure 1a and 1b).
Initial data inspection reveal very unusual seismic signals where about 80 % represent complex swarming sequences (Mercerat et al., 2010; Contrucci et al., 2011) (Figure 1c). Conventional automatic detection algorithms as e.g. the STA/LTA yielded no reliable results as seismic events appear close to each other in time, and vary strongly in duration and size. In addition, localization techniques based on seismic phase arrival times find its limits, as body wave phase are partially poorly developed, noisy, or covered by the CODA of the preceding event.
Here, we present two methods concerning the detection and localization problem, and the first results of their evaluation. In the proposed detection design, simple spectral signal characteristics are used to detect and characterize seismic events in the complex swarming sequences. For event localization, an approach based on simple peak-to-peak amplitude ratios was tested which relied on the derivation of a site specific attenuation law. Our results demonstrate the great potential of both methods to provide a reliable, semi-automatic approach to approximate spatio-temporal characteristics of seismicity in a first order.
Figure 1 (a) Side view of the microseismic network at Cerville-Buissoncourt, most important
geological layers, and the salt cavity structure. (b) Top view of the microseismic network, and the border of the salt cavity. (c) Typical microseismic record of a complex swarming sequence.
Detection Design
The proposed detector design is based on a spectral envelope function (SEF) calculated for each station seismogram. The SEF is defined by
(
)
tii F w
SEF =max ( ) (1),
where max(|F(w)|) is the maximal spectral amplitude of the FFT spectrum gradually calculated for very small time intervals ti (0.025 s) over the entire seismogram. Each calculated spectrum is
characterized by a very low resolution (sample rate = 5 kHz), whose shape and maximal spectral amplitude is very sensitive to spectral signal characteristics. If incoherent signals as noise and CODA waves are considered, the spectrum presents a flat shape and low maximal spectral amplitude. If energy is distributed over distinct frequency spectra, as expected for seismic waves, the calculated spectrum is steeper and the maximal spectral amplitude becomes much higher. In this way, contributions of noise and seismic events are clearly distinguished by the final calculated SEF. Then the SEF of all stations are combined to a network detection function (NDF) (Figure 2a) to guarantee event detection in agreement with the network detection capability and to further eliminate false detection alarms. Prior to NDF generation, all SEFs are elongated by convolution with a 0.25 s rectangular step function to avoid event extinction due to travel time differences. The convolved SEFconv for each station is then transformed to a station detection function (SDF) containing values of
0 for noise and 1 for a potential event. The trigger value of the station detection function was defined by the median of the convolved SEF:
SEFconv i -median(SEF) > 0 => SDFi = 1
SEFconv i -median(SEF) ≤ 0 => SDFi = 0
In the following, the product of the SDF is used to obtain a preliminary NDF where each value bigger than 0 comprise the centre of a detected event. The general event start and end time is determined by the point where the sum of all the SDFs becomes zero when going backwards and forwards in time from the event centre.
The great advantage of the proposed detection design is the usage of only one evaluation window of very small size which makes it applicable for all ranges of event duration. Moreover, event detection is quite sensitive with respect to very small sized events directly appearing next to a much bigger event (Figure 2a and 2d). Correspondingly, seismicity represented by the first detection results of a data set, recorded in 2008 (~ 11.000 detected events), seems to follow a Gutenberg-Richter distribution (Figure 2b). However, small deviations of the apparent Frequency – Magnitude relation are observed for stronger events that are mainly associated with an abnormal long duration (> 2 s) (Figure 2a). We found evidence that these loger lasting events are constituted by a superposition of shorter isolated events associated with a duration of 0.2 – 0.5 s. Accordingly, the statistical distribution of the dominant frequency is similar for isolated events and longer lasting events. Moreover, the number of apparent sub-events contained in the long duration events was estimated by calculating the SDF again for the time window of the detected event using the SEF without previous convolution (Figure 2c). From the results we found that the event duration increase linearly with the number of contained sub-events, supporting the idea of isolated event superposition. Consequently, an additional sub-event detection step might be inevitable when detection results are used to estimate seismic rates and apply probabilistic seismic analysis.
Figure 2 (a) Detection result for the swarming sequence presented in Figure 1c. Colored horizontal
and vertically dashed lines represent the start and end time of an event detected by the NDF as a function of all SDF (blue shaded areas). (b) Apparent Frequency-Magnitude relation for ~11.000 detected events approximated by the detected event number and Peak-to-Peak amplitude (counts) relation. (c) Apparent sub-event number for a long duration event determined by the SEF. (d) Detection example of a very short and weak seismic event.
Localization design
Hypocenter inversion based on the decay of seismic wave amplitudes was introduced by Battaglia and Aki (2003). Here, we used inter-station amplitude ratios, following the formulation of the seismic attenuation law as proposed by Taisne et al. (2011)
( )
(
i j)
s i j j i j i e r r QV f r r n S S A A − ⋅ ⋅ − ⋅ + = log log log
where A is the peak-to-peak signal amplitude, S the receiver amplification site effects and r the hypocentral distance at station i and j. The coefficient n represents the degree of amplitude loss due to geometric spreading on the ray path while the third term on the right hand side of Equation 2 represents intrinsic attenuation where f is the signal frequency, VS the medium specific S-wave
velocity, and Q the Quality factor.
Receiver characteristics were determined by carefully inspecting the amplitude spectra related to seismic events being at the same hypocentral distance to both stations of a station couple such that attenuation effects can be neglected (see Eq. 2). Finally, differences in peak-to-peak amplitudes were used to define the ratios of receiver site effects for each station pair.
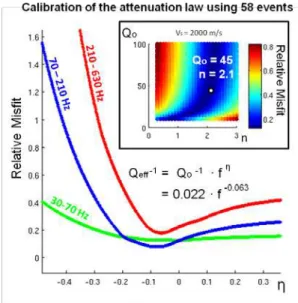
To calibrate the attenuation law we used 58 events of known source location that covered approximately the whole cavity zone. Hypocenter inversion for these events was carried out by means of manually determined polarization angles, and P and S-waves arrival times. Associated errors in epicenter location error were small ~ ± 20 m. In contrast, source depth was poorly resolved where best results comprised an error of ~ ± 50 m. For the following calibration, a fixed source depth at -180 m was assumed. At the same depth, gamma ray measurements documented significant detachment and collapse of a Marl layer (Figure 1a) between March and May in 2008 which correspond to the event registration time.
In a first step of calibration, a grid search for the quantities n and Q was performed to retrieve the contribution in amplitude decay produced by geometric spreading and intrinsic attenuation (Figure 3). The best approximation was represented by the minimal misfit between observed amplitude ratios and the right hand side of Equation 2 using the L2 norm. Used peak-to-peak amplitudes were measured for three different frequency bands 30 – 70 Hz, 70 – 210 Hz, 210 – 630 Hz. The minimal misfit finally was found close to the asymptotic kink of the misfit function, at n = 2.1 ± 0.1 and Q = 45 ± 20 (for VS
= 2000 m/s), where geometric spreading and intrinsic attenuation equally contribute to the amplitude decay with distance. Estimated errors represent the maximal deviation in parameter values considering a small degradation of the misfit function of 5 % from its minimum. Similar values for Q were found by Mercerat (2007) from spectral analysis. The somewhat high value found for n is suggested to represent the increased complexity of ray paths introduced by the cavity structure. In addition, we looked for a possible dependence of Q on frequency by using Q = Qo · fη and varying
η. Frequency values were approximated by the mean value of each considered frequency band (Figure 3). The results demonstrate a slight dependence of Q with frequency which significantly improved the fit of amplitude ratios for higher frequencies.
For the entire calibration procedure and following inversion stations M6 (1-3) (Figure 1a and 1b) were completely excluded. Attenuation effects recorded by these stations (especially M63) are significantly more dependent on source depth as they are much closer to seismic sources located at the cavity roof as compared to the other stations situated around the cavity structure. Hence, the assumption of a fix source depth would produce a significant bias when modeling the attenuation parameters.
In the following, amplitude ratio based localization for the 58 events was tested. Inversion was performed by a simple grid search over the cavity region. A grid point interval of 10 m was used for horizontal coordinates. The misfit of observed and theoretical amplitude ratios calculated by our attenuation law was estimated by using the L2 norm.
From the results, we observed that localization strongly depends on the used frequency band. Localization based on amplitude ratios for 30 – 70 Hz showed a poor resolution of epicenter location around 100 m (Figure 4a). As a result, attenuation effects for this frequency band are generally too weak with respect to contributions of noise in the rough peak-to-peak amplitude estimation.
Better localization results are observed when using amplitudes for higher frequency that are associated with a mean location error of ~50 m (Figure 4a). Generally, localization based on
amplitudes for 70 -210 Hz give the most robust results (Figure 4a and 4b). In contrast, localization results at frequencies of 210 - 630 Hz clearly depend on the source-receiver distance, and the amount of high frequency energy emitted by the seismic source. This effect can be seen by the apparent low location resolution at station M7 and somewhat at station M8 (Figure 4a). Dependent on the source size, both stations receive generally less and sometimes no high frequency energy as they are located at the surface, and thus, tend to be more distant than others. As a result, amplitude ratios do not anymore reflect correctly attenuation and the localization result is biased. On the other hand, localization becomes very precise when high frequency energy is present for all stations (Figure 4b). In total, it can be concluded that the observed attenuation effects at Cerville can be used to resolve the tendency of epicenter source location in the cavity region by using simple signal amplitudes estimates for higher frequencies > 70 Hz. However, results should be always interpreted under consideration of the spectro-temporal characteristics of the respective analyzed event. Future work will focus on the evaluation of an additional approach that might allow for source depth determination. Source depth determination seems generally possible by using the here obtained attenuation parameters with respect to signal amplitudes observed at stations M6 (1-3).
Figure 3 Calibration results of the attenuation law. (Upper panel) Grid search results for quantities n
and Q. (Lower panel) Q frequency dependence illustrated by the Misfit function for each considered frequency band calculated for observed and theoretical amplitude ratios (Eq. 2) using the L2 norm. The final value frequency dependence η was found by the minimal mean value of all Misfit functions.
Figure 4 (a) The error of location illustrated for its statistical distribution (lower panel), and spatial
distribution in the cavity region (upper panel). The error of location represents the distance to the actual known epicenter position. Note that the illustration of the spatial location error distribution is done by linear interpolation and only representative for areas where known epicenter locations are close. (b) Examples of two individual location results.
Conclusions
An event detection and localization design was tested to study semi-automatically unusual seismic signals recorded during the growth, and the induced collapse of a salt cavity. The results show the great potential of both methods to provide a reliable first order approximation of spatio-temporal attributes of the recorded seismicity. The detector design is based on a spectral envelope function and designed to study the characteristics of complex swarming sequences. By using just one evaluation window, the detector is suitable for all ranges of event duration. Nonetheless, the detection design needs to be further tested and optimized to allow for robust and reliable estimates of absolute seismic rates from the detection results. The tested localization method uses simple estimates of signal amplitude, and thus, avoids troublesome a priori seismic phase segmentation. Observed attenuation effects at Cerville were found to be sufficiently strong to resolve the tendency of epicenter location in the cavity region especially when considering higher frequencies of >70 Hz. As location results depend on the considered frequency band, additional information about the spectro-temporal event characteristics are inevitable when interpreting the results.
Battaglia, J. and Aki, K. [2003] Location of seismic events and eruptive fissures on the Piton de la Fournaise volcano using seismic amplitudes. Journal of geophysical Research, 108, 10-1029.
Contrucci, I., Klein, E., Cao, N.T., Daupley, X. and Bigarre, P. [2011] Multi-parameter monitoring of a solution mining cavern collapse: First insight of precursors. Comptes Rendus Geoscience, 343, 1-10. Klein, E., Contrucci, I., Daupley, X., Hernandez, O., Bigarre , P., Nadim, C., Cauvin, L. and Pierson, M. [2008] Experimental monitoring of a solution-mining Cavern in Salt: identifying and analyzing early-warning signals prior to collapse. SMRI Fall 2008 Technical Conference. SMRI Galveston (Austin), Texas, USA, 135–146.
Mercerat, E.D., Driad-Lebeau, L. and Bernard, P. [2010] Induced seismicity monitoring of an underground salt cavern prone to collapse. Pure Applied Geophysics, 167, 5-25.
Mercerat, E.D. [2007], Sismicite induite et modelisation numerique de l’endommagement dans un contexte salin. Ph.D. Thesis, LAEGO Institut National Polytechnique de Lorraine, France.
Taisne, B., Brenguier, F., Shapiro, N.M. and Ferrazzini, V. [2011] Imaging the dynamics of magma propagation using radiated seismic intensity. Geophysical Research Letters, 38, L04304 pp. 5.