HAL Id: hal-02509909
https://hal.archives-ouvertes.fr/hal-02509909
Submitted on 11 Jun 2021
HAL is a multi-disciplinary open access
archive for the deposit and dissemination of
sci-entific research documents, whether they are
pub-lished or not. The documents may come from
teaching and research institutions in France or
abroad, or from public or private research centers.
L’archive ouverte pluridisciplinaire HAL, est
destinée au dépôt et à la diffusion de documents
scientifiques de niveau recherche, publiés ou non,
émanant des établissements d’enseignement et de
recherche français ou étrangers, des laboratoires
publics ou privés.
Distributed under a Creative Commons Attribution| 4.0 International License
Smart Irrigation Using CASO and IRRIG Ontologies
Quang-Duy Nguyen, Catherine Roussey, María Poveda-Villalon, Christophe
de Vaulx, Jean-Pierre Chanet
To cite this version:
Quang-Duy Nguyen, Catherine Roussey, María Poveda-Villalon, Christophe de Vaulx, Jean-Pierre
Chanet. Development Experience of a Context-Aware System for Smart Irrigation Using CASO and
IRRIG Ontologies. Applied Sciences, MDPI, 2020, 10 (5), pp.1803. �10.3390/app10051803�.
�hal-02509909�
sciences
Article
Development Experience of a Context-Aware System
for Smart Irrigation Using CASO and IRRIG
Ontologies
Quang-Duy Nguyen1,*,† , Catherine Roussey1,† , María Poveda-Villalón2,† , Christophe de Vaulx3 and Jean-Pierre Chanet1
1 Université Clermont Auvergne, INRAE, UR TSCF, 63178 Aubière, France; catherine.roussey@inrae.fr (C.R.);
jean-pierre.chanet@inrae.fr (J.-P.C.)
2 Ontology Engineering Group, Universidad Politécnica de Madrid, 28660 Boadilla del Monte, Madrid, Spain;
mpoveda@fi.upm.es
3 Laboratoire d’Informatique, de Modélisation et d’Optimisation des Systèmes (LIMOS), UMR 6158
UCA-CNRS, 63170 Aubière, France; christophe.de_vaulx@uca.fr * Correspondence: quang-duy.nguyen@inrae.fr
† These authors contributed equally to this work.
Received: 31 December 2019; Accepted: 21 February 2020; Published: 5 March 2020
Featured Application: This paper presents a smart irrigation context-aware system to be applied on an experimental farm in France. The experimental farm is an ecosystem for agricultural machines and digital information systems developed by an alliance of European organizations and institutes. Moreover, the two ontologies proposed by this paper, CASO and IRRIG, are open access and have the potential to be used by other applications such as smart buildings or smart cities.
Abstract: The rapid development of information and communication technologies and wireless sensor networks has transformed agriculture practices. New tools and methods are used to support farmers in their activities. This paper presents a context-aware system that automates irrigation decisions based on sensor measurements. Automatic irrigation overcomes the water shortage problem, and automatic sensor measurements reduce the observational work of farmers. This paper focuses on a method for developing context-aware systems using ontologies. Ontologies are used to solve heterogeneity issues in sensor measurements. Their main goal is to propose a shared data schema that precisely describes measurements to ease their interpretations. These descriptions are reusable by any machine and understandable by humans. The context-aware system also contains a decision support system based on a rules inference engine. We propose two new ontologies: The Context-Aware System Ontology addresses the development of the context-aware system in general. The Irrigation ontology automates a manual irrigation method named IRRINOV®. These ontologies reuse well-known ontologies such as the Semantic Sensor Network (SSN) and Smart Appliance REFerence (SAREF). The decision support system uses a set of rules with ontologies to infer daily irrigation decisions for farmers. This project uses real experimental data to evaluate the implementation of the decision support system.
Keywords:agriculture; smart irrigation; context-aware system; ontology; rules
1. Introduction
In the agricultural domain, farmers need to observe natural phenomena to engage in appropriate activities on their fields. For example, in traditional irrigation, farmers go to their fields to examine
the crop development stage and measure the soil moisture provided by probes in the soil. Then, they use practical experience or follow an irrigation method to estimate manually the water needs of their crops. Based on their estimations, the farmers decide whether to irrigate the fields. This conventional approach has two significant drawbacks. First, irrigation requires daily observations, often made by farmers. Manual observations are influenced by other factors such as the weather or the situation of farmers. For example, a daily observation could be skipped if the farmer is sick. Second, the resource shortage problem demands that farmers use water sparingly.
Context-aware systems (CASs) can overcome the above-mentioned situations. A CAS uses a wireless sensor network (WSN) to monitor environmental phenomena and uses those measurements for further processes. In a CAS, context refers to “any information that can characterize the situation of an entity. An entity could be a person, a place or an object that is considered relevant to the interaction between a user and an application, including the user and the application themselves” [1]. A CAS has two contexts: a low-level context and a high-level context [2]. The low-level context contains quantitative data. The high-level context contains qualitative data that synthesize a situation and ease the decision. For example, the statement “soil moisture is 160 centibar (cbar)” presents a low-level context; however, the statement “soil is dry” presents a high-level context.
The CAS has some peculiar characteristics. First, sensors in the system are heterogeneous. Each type of phenomenon demands a different type of sensor. For example, in agriculture, pluviometers measure rain quantity, and tensiometers measure soil moisture. Thus, the CAS should address some data interoperability issues. Second, the system should have the capability to process the raw measurement data and apply reason on them.
To address the above requirements, ontologies are adequate candidates. Some sensor ontologies are provided by several institutes of standardization. Their main goal is to propose a shared data schema that precisely describes measurements to ease their interpretations. These descriptions are reusable by any machine and understandable by humans. They propose a data modeling design pattern that is precise enough to answer any informational need. Thus, any sensor measurements described by these ontologies may be reusable by several decision support systems (DSSs). The sensor network becomes a data provider for several applications. For example, rain quantity measurements can be used by irrigation decision systems and crop disease management systems. Reusing existing ontologies enables the harmonization of sensor measurement descriptions. Moreover, those descriptions share the same data model. Thus, they are easy to integrate in a global data schema. Furthermore, some ontologies enable reasoning over data because they propose logical descriptions. In short, ontologies used in context modeling can solve the heterogeneity issues of various sensor measurements and infer the high-level context and decisions by applying rules. To the best of our knowledge, the proposed work is the first to reuse two well-known ontologies: the new version of the Semantic Sensor Network (SSN) [3] and Smart Appliances REFerence (SAREF) [4].
This paper presents the development method of a CAS that combines two engineering methodologies: ontology and information systems. This method was used to build a smart irrigation CAS that automates a manual irrigation method. This irrigation method, called IRRINOV®, was developed by Arvalis (Arvalis is an applied agricultural research organization dedicated to arable crops. It engages in many activities at 27 different local sites in France.) and its partners. The IRRINOV® method is widely used in many regions in France. The development of the system also includes the development of two new ontologies—the Context-Aware System Ontology (CASO) and Irrigation ontology (IRRIG)—and a set of rules for reasoning. The two new ontologies reuse well-known ontologies related to sensors and devices—SSN and SAREF. CASO specializes and extends SSN to describe the processing of context. CASO implements a generic context model that can be specialized to any observation of environmental phenomena. Using CASO simplifies the data processing and rule generating by dividing them in several steps. IRRIG specializes CASO by implementing the IRRINOV® method. The two ontologies model the sensor measurements and results of all measurement processing (cleaning, aggregation, reasoning, etc.). The system uses a set of rules for reasoning. Each rule
implements small inference steps. Thus, they are easy to understand, manage and correct. Finally, we propose a complete DSS that supports farmers in making daily irrigation decisions.
The rest of this paper is organized as follows. Section2presents the state of the art of several smart irrigation systems available in the research world. Section3introduces background information for the cycle of processes implemented in a CAS and the IRRINOV®method. The next section describes the development process of the complete system and the two ontologies. Section 5provides an example of the development presented in Section4. Section6presents and compares the results after implementing the system using real experimental data provided by Arvalis. Also, this section discusses the limitations of the IRRINOV®method, the limitations of the Arvalis dataset and the limitations of the DSS system. Finally, a brief conclusion sums up the system and presents the perspectives.
2. State of the Art
As mentioned in the introduction, an ontology is a shared data schema that provides a common understanding of data descriptions. Data descriptions based on ontologies are reusable by any machine and understandable by humans. Thus, we examined ontologies already used in irrigation decision systems to reuse them as data modeling patterns to improve the results of our data modeling activity.
Several expert systems already exist that can determine whether a crop needs water. For example, one expert system uses the common-KADS method to irrigate mango trees, as presented in [5]. Please note that this expert system is not connected to any sensors or actuators. Its goal is to help farmers decide when to irrigate. However, no information about the ontology publication is provided.
Semantic web technologies are already used in CASs dedicated to irrigation. For example, the FIWARE platform that links Internet of Things (IoT) devices to the cloud has been used in several different irrigation experiments [6]. The FIWARE cloud platform contains the SEPA SPARQL-based engine, which represents information in an RDF format and provides SPARQL queries. To the best of our knowledge, no information about the ontologies used in these experiments is available online.
The works of [7,8] present some ontologies dedicated to hilly citrus tree cultivation. One ontology addresses the irrigation decision. The ontology stores the computations of relative soil moisture based on the soil type and the crop growth stage. When the soil moisture reaches a given threshold, the farmers receive an alert from the system. In this case, the ontology is not published; therefore, it is impossible to reuse it.
To our point of view, the most successful CAS dedicated to irrigation is the one developed during the PLANTS project [9]. This system is installed in a greenhouse. It uses several types of sensors to observe raspberry plants. This system can control watering equipment to control irrigation in the four zones of the greenhouse. The PLANTS ontology aims to describe e-entities and their interactions [9,10]. An e-entity is a virtual representation of a physical object that can be either a raspberry plant or equipment. Every measurement is defined as the parameter of an e-entity. Sensor streams are not aggregated. The last measurements are used to update a parameter. The rules are used to derive the states of raspberry plants from various parameters. Watering equipment is controlled by the detection of “drought stress” in a specific zone. Thus, the only part of the ontology that we want to reuse is the plant state hierarchy. Unfortunately, this ontology is unavailable on the Web because it is the schema of the facts-base implemented in the Jess inference engine.
To conclude, while several works focus on processing sensor streams and computing aggregations, their results are not directly reusable, as our approach should handle the temporal and spatial aggregation of sensor streams for the irrigation use case. Additionally, the ontologies mentioned in previous works are either unavailable online or their domain is loosely related to our use case.
3. Background Information
This smart irrigation system is based on a CAS and the IRRINOV® method. First, the cycle of processes implemented in a CAS provides an overview of the global system: its devices, its phases of
processes and the transformation from data to context. Second, the IRRINOV®method specifies the requirements of the system and the basic algorithm for making decisions.
3.1. Cycle of Processing Dedicated to CAS
In irrigation, a CAS has three specific components. First, a WSN plays the role of sensing and monitoring the plot environment. Second, a DSS can (1) send notifications to farmers to support them in their decision-making process and (2) automatically make decisions and control the watering system. Third, watering devices are in charge of watering the soil in the field.
The CAS processes can be grouped and represented as a cycle of processes [11]. This cycle is called the CAS life cycle. It is divided into four phases: (1) acquisition, (2) modeling, (3) analysis, and (4) exploitation. Please note that this section improves our previous work about CAS life cycle [12] by decreasing the number of phases. The exchange between two phases can consist of data, the low-level context or the high-level context. The CAS life cycle for smart irrigation is depicted in Figure1. The four phases of its life cycle are described as follows.
Exploitation phase Acquisition phase Modeling phase Analysis phase Data Low-level context External data sources Data External systems Information Data High-level context Watering device Wireless Sensor Network
Figure 1.Life cycle of a smart irrigation CAS.
• Acquisition phasefocuses on how the system retrieves and processes measurements from sensor devices and data from external data sources. The output of this phase are measurements and related data derived after raw data cleaning processes.
• Modeling phasefocuses on the data model and the integration of input data into the system. The system is equipped with a storage service. The input data are organized with a common data model to become the low-level context. As shown in Figure1, the input of this phase is data derived from the acquisition phase. The output of this phase is the low-level context. This paper considers ontologies as a candidate for the data modeling process.
• Analysis phasefocuses on the transformation from the low-level context into the high-level context. The high-level context is an enrichment of the context with qualitative data. Such data summarize the situation of entities and support the decision process. The system uses a rules-based inference engine for the reasoning process. As shown in Figure1, the input of this phase is the low-level context. The output of this phase is the high-level context. This paper considers Drools (https://www.drools.org/) as a candidate for the inference engine.
• Exploitation phase focuses on the use of the high-level context to distribute them to corresponding agents, which can be other devices or users. The input of this phase is the high-level context. The output of this phase can be human-readable content, a message to an external system or a reaction of a watering device to the environment.
3.2. IRRINOV®Method
This subsection presents the IRRINOV® (All versions of the IRRINOV® method are available
athttp://www.irrinov.arvalisinstitutduvegetal.fr/irrinov.asp) method. This method, developed by
Arvalis and its partners, proposes a guide to make irrigation decisions based on measurements of soil moisture sensors and pluviometers oriented to farmers. The method aims at answering the following questions: (1) When should irrigation be started, or when should watering devices be installed on the plot? (2) When should we start each watering cycle (“Watering cycle” is the action of an irrigation system performing a watering activity on all the plots engaged in the system. “Watering cycle duration” is the number of days between two consecutive waterings of the same plot)? (3) When should irrigation be stopped, or when should farmers withdraw the watering devices?
A set of decision tables and recommendations are provided by IRRINOV® method to allow farmers to manage their irrigation system on a single plot. Numerous variants of the method are proposed depending on the soil, plot and crop types. This work uses the IRRINOV®method for the region Midi-Pyrénée, which is dedicated to maize crop plants on clay-limestone soil [13] and includes the following measuring equipment:
• One IRRINOV®measuring station composed of six Watermark (https://www.irrometer.com/
sensors.html#wm) probes that measure the soil water tension (tensiometer). Three Watermark
probes should be placed at 30 cm depth in the soil, and the other three should be placed at 60 cm depth in the soil. Figure2illustrates the prototype of the IRRINOV®station.
• One mobile pluviometer that measures the amount of water received by the crop during a watering.
• One weather station with a pluviometer to measure the quantity of water received by the crop during a rainfall.
Pluviometer
Monitor box IRRINOV station
Soil sensor at 30cm depth Soil sensor at 60cm depth
Figure 2.Prototype of the IRRINOV®station.
More information about IRRINOV®method is available at [12]. The goal of this section is to illustrate the processing defined un previous section. The IRRINOV®method specifies the time needed to install the devices on the plot. The IRRINOV®station and the mobile pluviometer should be placed in the plot when the crop reaches growth stage V2 (V2, V7, R1, and R5 are the code names of maize growth stages defined in [14]. They are respectively named “7 leaf”, “10 leaf”, “silking” and “dent stage with 50% moisture” in the Arvalis growth stage classification.). The measurements can start two or three days after installation. The Watermark probes are typically read once a week, but during dry weather, farmers can check the probes more frequently, for example, one observation per day. Irrigation should stop when the crop reaches the growth stage R5hg45. Please note that state R5 is defined in [14]; however, the state R5hg45 is defined in this project. This state means that the crops have moisture dents equivalent to 45%. The IRRINOV®method specifies the constraints to validate the measurements of Watermark probes. Those treatments are part of the acquisition phase. If the difference between the probe measurements is above 30 cbar, then one of the probes is malfunctioning, and the farmer should visit the field to correct the probe installation. The value read on a Watermark probe must be multiplied by the correction coefficient, which is specific for each batch of probes. For example,
probes from 2013 have a correction coefficient equal to 1.0. In this paper, we call the former value a raw data value. The latter value after this process is the measurement value. Please note that when the measurement value is 199 cbar, the IRRINOV®method considers that there is a contact problem between the Watermark probe and the soil. The measurement value represents the soil tension and has the cbar unit. It is part of the output of the acquisition phase.
The IRRINOV® method relies on decision tables to determine when to start a watering cycle depending on the soil moisture measurements and crop growth stage. An example of table that determines when to start a watering cycle for clay-limestone soil is provided in Table1which is, in fact, applied to maize crops when their growth stage is between V2 and V7. The decision table indicates that the farmer should start the first watering cycle when the median value of three probe measurements reach a given threshold.
Table 1.Decision table of the relation of the watering cycle duration and the soil moisture for maize at growth stage V2.
Watering cycle duration 9 to 10 days 6 to 8 days below 5 days Median of 30 cm depth probes 30 cbar 50 cbar 60 cbar Median of 60 cm depth probes 10 cbar 20 cbar 20 cbar Sum of the median of 30 cm depth probes
and the median of 60 cm depth probes
40 cbar 70 cbar 80 cbar
The second column of the above decision table should be read as “If the plot has a watering cycle duration fixed between 9 and 10 days”, and one of the two following conditions is satisfied:
(1) “When the median value of three probe measurements at 30 cm depth are above the 30 cbar value” and “when the median value of three probe measurements at 60 cm depth are above the 10 cbar value”.
(2) “When the total (sum of the median of 30 cm depth measurements and the median of 60 cm depth measurements) is above 40 cbar”.
Then, a watering cycle should start.
This project translates all the decision tables into rules to transform the manual IRRINOV®method into an automatic DSS. Those processing are part of the analysis phase. The exploitation phase will translate the irrigation decision into a command executable by the watering device.
4. CAS Development
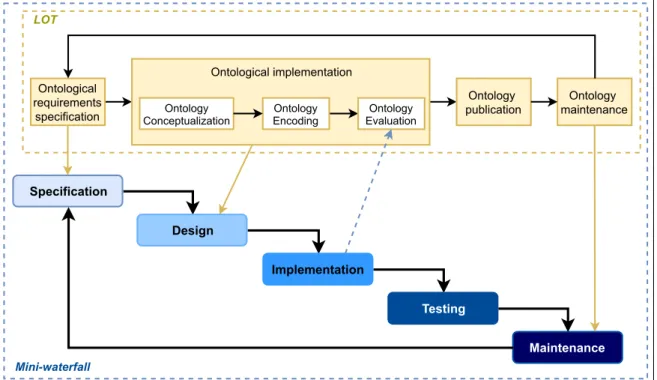
The development methodology used to develop the smart irrigation CAS is the mini-waterfall methodology [15]. Additionally, CASO and IRRIG ontologies have been developed following the linked open terms (LOT) methodology [16].
A mini-waterfall is a methodology used for system engineering. It is inspired by the well-known waterfall methodology, which develops a system in five activities: (1) specification, (2) design, (3) implementation, (4) testing and (5) maintenance. The purpose of the mini-waterfall methodology is to repeat the sequence of the five activities multiple times to develop the system progressively.
LOT is a methodology used for ontology engineering. It was first proposed in [16] and further developed at [17]. LOT is inspired by agile techniques in which sprints aim to align ontology development with software development agile practices. This methodology focuses on (1) the reuse of terms (classes, properties and attributes) existing in already published vocabularies or ontologies and (2) the publication of the ontology following the linked data principles. LOT relies on the ontological engineering activities defined in the NeOn methodology [18] when available. LOT defines iterations over the following four activities: (1) ontological requirements specification, (2) ontology implementation, (3) ontology publication, and (4) ontology maintenance.
Figure3illustrates the smart irrigation CAS development methodology combined with the ontology development methodology. Ontology development has a life cycle called the LOT life cycle. The LOT life cycle is presented by the dashed yellow box. Each activity in this life cycle is represented by a solid yellow box. The solid black arrows between the boxes show the order of the activities; for example, the development team must perform the ontological requirements specification activity before the ontological implementation activity. The CAS development life cycle is called a mini-waterfall life cycle. It is presented by the dashed blue box. Each activity in this life cycle is represented by a solid blue box. The solid yellow arrow between one activity X in the LOT life cycle and one activity Y in a mini-waterfall life cycle means that the result of activity X is necessary to implement activity Y. For example, the design activity of the mini-waterfall cycle requires the result of the ontology conceptualization activity of the LOT life cycle. Otherwise, the dashed blue arrow from one activity Y of mini-waterfall to one activity X of LOT life cycle means that the result of the activity Y can contribute to activity X. It is necessary to note two items in this methodology. First, the LOT life cycle is triggered by the mini-waterfall life cycle, but it is independent of the mini-waterfall life cycle. Consequently, the LOT life cycle can be shorter than the mini-waterfall life cycle. Suppose that after each development life cycle, there is a new version. Therefore, there is nothing to prevent the ontology from having three versions at the same time, but the system can only have one version. Second, after the maintenance activities of both the LOT life cycle and CAS life cycle, the development team renews the sequence, i.e., starts with the first activity. However, they can skip the current activity if they find that the last time result of the same activity is sufficient.
Specification Design Implementation Testing Ontological requirements specification Ontological implementation Ontology Conceptualization Ontology maintenance Mini-waterfall LOT Ontology Encoding Ontology Evaluation Maintenance Ontology publication
Figure 3.Mini-waterfall combined with LOT methodology to develop a system.
The specification activity analyzes and identifies all the requirements for the system and the associated ontology (global data schema). In the design activity, the system uses a network of ontologies to model the results of all data processing. Therefore, ontology implementation is part of the system design. In the CAS implementation activity, the system imports the ontologies. The result after a CAS implementation activity contributes to the ontology evaluation activity. If the CAS is implemented, then the ontologies cover all the requirements. The ontologies should be available in public URIs through ontology publication. Ontology evaluation and system testing are necessary to guarantee that the system works correctly. Finally, the system and the ontologies are maintained.
During the specification activity, we identify several sensor streams to be processed. The next activities of the mini-waterfall methodology (design, implementation and testing) were applied on one stream at a time to cover all the requirements. Then, a global algorithm was implemented that merges all the results of the stream processing.
4.1. CAS Specification
First, it is necessary to present the resources for system development. All the requirements of the system are extracted from the following resources:
• The IRRINOV®method version for the region Midi-Pyrénée, France.
• The Arvalis dataset: real experimental data from Arvalis and INRAE (INRAE (French National Research Institute for Agriculture, Food and Environment) was founded on 01/01/2020 from the fusion between INRA and IRSTEA. It supports the profound changes in agriculture, food and the environment in France, Europe and around the world through its research activities.). This is an excel file that contains recorded daily observations and activities of farmers in a maize plot T1 B1 -DKC4814 from 14/06/2013 to 06/10/2013 in Gaillac, France. Please note that the observations recorded in the Arvalis dataset are the daily aggregated values of the sensor measurements. In other words, the data in the dataset are already processed from the raw measurements.
• Farming journal (“Carnet de Terrain” in French): a document that contains several tables to record all the precise observations related to the plot. It is a kind of experimentation journal that was used frequently in research laboratories.
• Experiences and knowledge from specialists in the agriculture domain. The specialists are from Arvalis and INRAE.
This subsection focuses on two requirements: the data modeling requirement and the processing requirement. The data modeling requirement is needed for developing ontologies. The processing requirement is used to identify the type of processing applied on the sensor streams (cleaning, aggregation, comparison).
4.1.1. Ontology Requirement
First, the IRRINOV®documentation [13] was studied to identify the following: • The type of sensors used and their measurements.
• The data needed to make the decision: type of soil, type of crop, sowing date, sensor localization and depth, quantity of rain per day, evolution of crop growth stage, and moisture measurements at different depths.
• The different processes applied to the sensor measurement streams, such as data cleaning, spatial and temporal aggregation, and threshold comparison.
• The different decisions produced by the method.
Second, it was necessary to communicate with specialists of Arvalis and INRAE to clarify the IRRINOV® method. Some of the questions formulated to the experts were as follows: What is the difference between an irrigation period and a watering cycle? What are the possible values of maize growth stages? How are we to observe a growth stage?
Third, to generalize the system, it was necessary to derive standard definitions and concepts in the agriculture domain. This work was carried out by querying a web retrieval system. The selected resources were articles referenced in publications and from well-known organizations. For example, the different maize growth stages are defined in a publication from the University of Iowa [14].
Fourth, the analysis of the Arvalis dataset provided a better understanding of the computing processes on sensor measurements, as well as the experimental details such as the type of soil and the code names of the sensors.
The first analysis enabled this system to define several process workflows corresponding to the type of sensor measurement stream. A workflow defines the aggregations (or any mathematical functions) and deductions applied on the streams. An example of temporal aggregation is the computation of the average on a 24-h window applied on a soil moisture stream produced by one probe. Then, the aggregation results are conceptualized into a property of an observed phenomenon. This system considers four main sensor streams described by observed phenomena and associated properties: (1) the moisture of the soil, (2) the quantity of rain, (3) the growth stage of the crop, and (4) the water need state of the crop.
Moreover, from the first analysis, an ontology requirement specification about the smart irrigation CAS was generated. These specific requirements were written as a competency questions document. An online spreadsheet (The spreadsheet is available on the GitLab repository of this project
https://gitlab.irstea.fr/irrig/public/tree/master/CompetencyQuestions) was defined to share them.
It contains the following fields:
• The identified code of requirements.
• The competency questions written in natural language. Various forms of the question were written to generalize them.
• Some examples of answers to identify the domain value. • The explanation of the answer.
• The references of the vocabulary definitions.
Figure 4 presents an excerpt of the current competency questions. Please note that these competency questions are a large table with many columns and rows; we only show an excerpt as an illustration. For example, CQ1.1 expresses the need to know the type and brand of each sensor. CQ1.3 expresses the need to define the type of sensor streams used as inputs in the IRRINOV®method.
Figure 4.Screenshot of a part of the competency questions document containing the questions and answers from CQ1.1 to CQ1.4.
4.1.2. Processing Requirement
In studying the IRRINOV® method, we noticed that the irrigation decisions proposed by this method are based on several aggregation measurements: temporal aggregation and spatial aggregation. We notice that the decision workflows of processes follow the same pattern: provide a stream of sensor measurements, aggregate certain sensor measurements extracted from the stream, and then compare the aggregation results to a threshold. The thresholds enable us to define certain states. A state is qualitative data of a property that characterizes the observed phenomenon. The goal of the rules is to determine the state of each property. The design activity goal will be to translate each statement in decision tables and the associated threshold into one or several reasoning rules. The specification requirements activity identifies each process belonging to one workflow dedicated to one stream and
determines its input, its output and its parameters (thresholds). For example, the workflow dedicated to the soil moisture stream starts with a measurement process from a soil tensiometer probe. Then, those measurements are the input data of a sequence of aggregation processes. The last aggregation value is compared to a threshold to produce a state of a soil moisture entity. This example is precisely outlined in Section5.
Second, the Arvalis dataset provided the parameters to precisely determine the aggregation processes used in the IRRINOV® method. Examples of such information are the watering cycle duration and the threshold for soil moisture.
4.2. CAS Design
This subsection focuses on explaining the conceptualization process of the ontologies. Later, the system design describing how to use the ontologies for data modeling is presented.
4.2.1. Ontology Conceptualization
First, the ontology requirements specification was oriented to the development of one ontology to support the smart irrigation CAS. However, it should be noted that a general part of the ontology could be reusable for other use cases; therefore, we decided to materialize the implementation in two ontologies, CASO and IRRIG. In the following, a typical approach for the conceptualization is detailed, and then the decisions about the ontology modularization used to create CASO and IRRIG are described. Please note that our ontologies have already studied well-known ontologies about sensor measurements [12]. They choose to reuse SSN since this ontology provides a precise description of measurements based on data modeling patterns. SSN defines several patterns that help to understand the data modeling issues.
The first step towards a conceptualization was to identify from the competency questions document those ontology elements that needed to be represented. More precisely, this step was carried out in the following order:
• Identification of concepts: We want to model all the processes applied to sensor streams. They are mainly aggregations and threshold comparisons. The goal of the comparison is to derive qualitative (symbolic) data. To differentiate quantitative from symbolic computation, we need to use deduction. A deduction provides qualitative data as a result. These results are the entity states that should be defined in some referential item. For example, maize growth stages are states defined in a certain thesaurus. In most cases, the state of an entity is derived because one value is above or below a threshold. We model thresholds as state boundaries.
• Identification of relations: To characterize a deduction, we need two new relations: (1) a relation that links a deduction to its resulting state and (2) a relation that links a deduction to the period when this deduction is valid, i.e., the period when the entity is associated with a state.
• Identification of cardinality restrictions applied for relations: This step also involves a decision on whether the relation at hand should be defined as functional. For example, the relation between a deduction and its result is functional. A deduction has only one result: the state of the entity derived by the deduction.
• Identification of individuals: Following the SSN pattern, these entities are characteristics of the feature of interest [3]. They are modeled as an instance of the class ssn:Property, which are linked to an instance of the class sosa:FeatureOfInterest by the object property ssn:hasProperty. To specialize an SSN to the irrigation use case, the involved properties in the use case, for example, air temperature or crop stage, have been defined as instances of properties.
Next, ontologies and particular ontology elements were identified to be reused. The following selected ontologies have been developed and maintained by standardization organizations.
• The W3C & OGC Semantic Sensor Network (SSN) ontology describes sensors, observations, samples and actuators [3].
• Smart Appliances REFerence (SAREF) (http://www.w3id.org/saref) is an ontology for smart appliances that contributes to semantic interoperability in the IoT domain [4]. This ETSI recommendation focuses on the representation of appliances and devices together with their functions, commands, services, states and profiles (It is necessary to mention that CASO and IRRIG reuse some concepts from SAREF and SAREF4AGRI, which are unavailable in the latest published versions of these ontologies, but it is known by the authors that they will be available in the next versions. SAREF4AGRI is an extension of SAREF for agriculture.).
• The W3C PROV ontology represents provenance information [19].
• The W3C SKOS vocabulary describes knowledge organization systems. It will be useful in defining properties and their states [20].
• The W3C OWL-Time (http://www.w3.org/2006/time), an ontology of temporal entities, describes the temporal properties of resources.
Another well-known ontology reused in this conceptualization is the Ontology of Units of Measure and Related Concepts (OM) [21].
In some cases, the reused ontology elements matched the intended use in the developed ontology; therefore, they were adopted without modification. Some examples of this case are the classes
sosa:Platform, sosa:FeatureOfInterest or om:Unit.
However, in other cases, some additional properties or constraints had to be added to the reused elements. Then, a new subclass of reused concepts was created to attach the new semantics to the subclasses created. For example, the class caso:Observation is a specialization of the class sosa:Observation since sosa:Observation represents any computation activity in general.
caso:Observation uses the object property prov:wasInformedBy to identify the inputs of the computation. The class caso:Deduction is a specialization of caso:Observation. A deduction is also a computation or a measurement that has a state for a result.
caso:hasClosedUpperBoundary caso:hasOpenUpperBoundary caso:hasClosedLowerBoundary caso:hasOpenLowerBoundary saref:has Function caso:State caso:hasResultState prov:wasInfluencedBy caso:hasValidTime caso:Deduction caso:triggers Function caso:lesserThan caso:lesserThanOrEqualTo caso:greaterThan caso:greaterThanOrEqualTo skos:Concept ssn:Property sosa:observedProperty sosa:FeatureOfInterest time:TemporalEntity sosa:phenomenon Time om:hasUnit sosa:Result caso:hasState <<owl:subpropertyOf>> sosa:hasResult prov:used caso:Observation prov:wasInformedBy caso:Actuation sosa:resultTime:: xsd:dateTime sosa:hasSimpleResult sosa:madeBySensor sosa:Observation caso:Property ssn:hasProperty om:hasUnit caso:boundaryValue caso:Boundary saref:Device saref:Function saref:Command saref:isCommandOf saref:hasCommand sosa:actsOnProperty sosa:madeByActuator sosa:hasFeature OfInterest sosa:Actuation sosa:ObservableProperty sosa:ActuatableProperty sosa:Sample Legend Class Attribute whose domain is the
attached class object property applicable to attached class
subClassOf object property with domain
and range definitions <<stereotype>> sosa:Sensor saref:Actuator saref:Sensor sosa:Actuator sosa:hasFeature OfInterest sosa:isSampleOf
Union class (Anonymous)
U Prefixes owl: http://www.w3.org/2002/07/owl# sosa:http://www.w3.org/ns/sosa/ ssn: http://www.w3.org/ns/ssn/ saref: http://www.w3id.org/saref# time: http://www.w3.org/2006/time# om: http://www.ontology-of-units-of-measure.org/resource/om-2/ prov: http://www.w3.org/ns/prov skos: http://www.w3.org/2008/05/skos Ontology caso: https://w3id.org/def/caso# U sosa:resultTime:: xsd:dateTime sosa:hasSimpleResult ssn:System sosa:hosts sosa:Platform
om:Unit
Finally, the conceptualization was modularized into two ontologies: CASO and IRRIG. The IRRIG ontology imports and extends CASO. The CASO ontology is illustrated in Figure5. This IRRIG ontology is depicted in Figure6. The entities defined in the CASO and IRRIG ontologies are preceded by the prefixes “caso” (yellow boxes) and “irrig” (blue boxes), respectively.
The goal of CASO is to model any context processing. IRRIG is a specialization of CASO used to describe all the context processing involved in the IRRINOV®method. For this reason, it specializes some elements of CASO, as shown in Figure6. For example, IRRIG specializes the class ssn:Property in different subclasses related to moisture, stress, and growth. Several subclasses of caso:Observation specify different types of observations. Each subclass is dedicated to the observations of one specific instance of ssn:Property. saref:has Function sosa:madeBy Sensor sosa:observed Property sosa:hasFeatureOf Interest prov:wasInformedBy prov:used caso:Observation caso:hasClosedUpperBoundary caso:hasOpenUpperBoundary caso:hasClosedLowerBoundary caso:hasOpenLowerBoundary caso:State caso:hasResultState caso:hasValid Time caso:Deduction sosa:madeBy Actuator sosa:actsOn Property sosa:hasFeatureOf Interest prov:wasInfluencedBy caso:Actuation caso:hasState caso:Property om:hasUnit caso:Boundary irrig:Soil30cmDepthDaily AverageMoistureObservation irrig:RootZoneDaily MoistureObservation irrig:Soil60cmDepthDaily AverageMoistureObservation om:Unit irrig:CropGrowth Deduction irrig:RootZoneMoisture LevelDeduction irrig:CropWaterNeed Deduction
sosa:hosts sosa:Platform sosa:hosts sosa:Sensor ssn:hasProperty sosa:FeatureOfInterest ssn:Property time:TemporalEntity irrig:IrrigationActuation sosa:hasResult om:hasUnit sosa:phenomenon Time sosa:resultTime:: xsd:dateTime sosa:hasSimpleResult:: sosa:Result saref:Device saref4agri:WateringValve saref:Actuator saref:Sensor saref4agri:SoilTensiometer saref4agri:Pluviometer saref4agri:Thermometer sosa:Actuator sosa:Observable
Property sosa:ActuatableProperty irrig:MoistureProperty irrig:StressProperty irrig:GrowthProperty irrig:CropGrowthState irrig:CropWaterNeed State irrig:RootZoneMoisture LevelState irrig:RainIntensity Boundary irrig:RootZoneMoisture LevelBoundary Prefixes owl: https//www.w3.org/2002/07/owl# caso: https://w3id.org/def/caso# sosa:http://www.w3.org/ns/sosa/ ssn: http://www.w3.org/ns/ssn/ saref: http//www.w3id.org/saref# saref4agri: http//www.w3id.org/def/saref4agri# time: http://www.w3.org/2006/time# om: http://www.ontology-of-units-of-measure.org/resource/om-2/ skos: http://www.w3.org/2008/05/skos# Ontology irrig: https://w3id.org/def/irrig# Legend Class Attribute whose domain is the
attached class object property applicable to attached class
subClassOf object property with domain
and range definitions irrig:soil30cmDepth MoistureObservation irrig:Soil60cmDepth MoistureObservation om:hasNumericValue caso:boundaryValue:: sosa:Observation caso:triggers Function sosa:Actuation saref:hasCommand saref:Function saref:Command skos:Concept irrig:RainIntensityState irrig:RainIntensity Deduction irrig:IntensityProperty irrig:RainQuantity Observation irrig:RainDailyTotal QuantityObservation irrig:CropGrowth Observation ssn:System sosa:Sample sosa:is SampleOf saref:hasManufacturer:: xsd:string saref:hasName:: xsd:string saref:hasModel:: xsd:string irrig:irrigationDelay Observation
Figure 6.Overview of the IRRIG ontology.
During the conceptualization phase, several versions of the ontology model are produced and stored in a private repository of INRAE. Figures5and6are parts of the lastest version (v201912). 4.2.2. System Design
Two main steps used to model the smart irrigation CAS are (1) to identify the entities needed to model and (2) to choose the appropriate vocabulary and relation from CASO and IRRIG to model the determined entities.
First, we determined the entities needed to model the smart irrigation CAS. The following vocabulary should be considered entities:
• Feature of interest is the natural phenomenon observed by sensors.
• The property of the feature of interest can be a quantitative property (a sensor measurement or aggregation) or a qualitative property (a state that is a result of threshold comparison).
• Data processing actions and the actor that executes the action. The data processing may be a measurement, an aggregation or an inference.
• Result and the time related to the action.
The action could be a measurement, aggregation or deduction (threshold comparison or inference). On the one hand, the result of a deduction should be qualitative data that are a state of the entity. On the other hand, the result of the measurement and aggregation is numerical data.
Table2shows a list of entities needed to model. This table contains six columns:
• Workflow: there are four streams defined in this project: (1) crop growth, (2) crop water need, (3) soil moisture, and (4) rain quantity. Each stream specifies a dedicated workflow of processes. • Feature of interest: the phenomenon that needs to be observed: crop, rain, soil, etc.
• Property: the aspect of the phenomenon that needs to be observed. • Type of action: could be a measurement, an aggregation or a deduction.
• Actor: depending on the type of action, an actor could be a sensor, a software component that implements an aggregation, or an inference engine for the deduction.
• Type of result: could be a state or a numeric value.
Table 2.List of features of interest, properties and actors that require modeling. Workflow Feature of Interest Property Type of Action Actor Type of Result Crop growth Crop
Growth Measurement Human State
Growth Deduction Inference engine State Crop water
need
Water Need Deduction Inference engine State Sleeping Sleeping duration Aggregation Component that gets
the sleeping duration
Numeric Soil moisture Soil at 30 cm depth Moisture at 30 cm depth
Measurement Soil tensiometer Numeric Daily average
moisture at 30 cm depth
Aggregation Component that gets daily aggregated moisture Numeric Soil at 60 cm depth Moisture at 60 cm depth
Measurement Soil tensiometer Numeric Daily average
moisture at 30 cm depth
Aggregation Component that gets daily aggregated moisture
Numeric
Root zone Daily average moisture at root zone
Aggregation Component that gets daily aggregated moisture
Numeric
Root zone moisture level
Deduction Inference engine State
Rain quantity Rain
Rain quantity Measurement Pluviometer Numeric Daily total rain
quantity
Aggregation Component that gets daily total rain quantity
Numeric
Intensity Deduction Inference engine State Delay Delay duration Aggregation Component that gets
the number of delay days
Numeric
In this table, in addition to the entities related to the agricultural phenomenon, it is essential to mention the two other entities: sleeping and delay. Sleeping is the period after a watering action of one plot. No more watering action is applied on this plot during the sleeping period. Delay is the period when a watering action is postponed due to a rain event.
The second step of the CAS modeling is to select the vocabulary in CASO and IRRIG to model the entities. In CASO and IRRIG, the features of interest, properties and state of properties were predefined. Thus, the remaining work creates the individuals for the appropriate actions, numeric results, actors and time that relate to the corresponding feature of interests and properties.
The list of modeled entities and their associated processes defined from the above analysis enabled us to design part of the CAS. To design inference processes (the rules), we build a state diagram for each workflow. This diagram presents the conditions for a property reaching a state. Moreover, this indicates the behavior of the system after the property reaches the state. The state diagram uses a set of information:
• List of the states for the concerned property.
• The conditions under which that property can reach a state. • The actions of the system after the property reaches the state.
To design the state change of certain properties, we selected the UML state diagram. First, we drafted the state changes in chronological order. Based on this first draft, we designed the conditions of state changes based on the IRRINOV®decision table. Then, we checked each set of conditions to make them independent. The goal was to have the same set of conditions always reach the same state value. In the end, the state diagram took into account synchronization issues between the new sensor measurements, the aggregation processes and the state changes. For that reason, an Init state was created in each state diagram to represent a synchronization point for daily computation. Moreover, each state diagram has a clock to manage the synchronization between all the processes.
Section5.1.4presents the lastest version of the state diagram related to the RootZoneMoistureLevel property. The conditions of the state diagram will be translated into semantic web rule language (SWRL) rules during the implementation activity.
4.3. CAS Implementation
This subsection presents the process used to transform the model of the ontologies and the system into software products using encoding languages.
4.3.1. Ontology Encoding
Once the models were designed, the two ontologies were encoded in OWL [22] using Protégé [23]. The implementation of the ontologies included the declaration of metadata such as authors, dates, and licenses, according to [24]. The OWL code of the ontologies is available on two distinct GitHub repositories. The current implementation of CASO contains 27 classes, 40 object properties and 4 datatype properties reusing the SOSA, SSN, SKOS, SAREF, PROV, Time, and OM ontologies. The IRRIG ontology imports CASO and extends it with 31 classes, 4 properties and 71 individuals to model the irrigation use case states, properties and features of interest. Among them, four classes and three datatype properties are reused from SAREF4AGRI.
4.3.2. System implementation
This project developed a program called Ontogen. This program was written in Python and Java. In the Arvalis use case, Ontogen takes as input specific sensor measurements provided by Arvalis in an Excel file and produces the output as the state of CropWaterNeed property. The program itself can be divided into three modules:
• Virtual sensors: read data from Excel files.
• Aggregators: run functions to produce aggregated data.
• Inference engine: The core is OWLAPI (https://github.com/owlcs/owlapi) and SWRLAPI
(https://github.com/protegeproject/swrlapi). This module uses a set of SWRL rules, and all the
The aggregations are encoded in Python as a function. The deductions are executed by the SWRLAPI Drool inference engine integrated into Ontogen. In detail, the reasoning process of the inference engine in Ontogen can be explained as follows. First, Ontogen generates an OWL file that contains all the individuals and the IRRIG ontology necessary for the rule engine; it creates all the individuals that describe sensor measurements. It also creates the individuals, instances of
caso:Deduction, necessary to define the daily deduction per instance of the class caso:Property. The file name is the concatenation of the feature of interest name and the beginning date. Second, it launches the Drools rule engine and applies it to the individuals previously created. The Drools engine updates the caso:Deduction instance. It links an instance of the class caso:State with an instance of
caso:Deductionvia the object property caso:hasResultState. Then, it creates a new OWL file that contains the results of the inference engine. The OWL file is updated from the previous file. The rule for Drools is coded in SWRL. There are a total of 25 rules in SWRL and two queries in semantic query-enhanced web rule language (SQWRL):
• 5 rules for crop growth. • 1 rule for rain intensity.
• 1 rule for root zone soil moisture level. • 16 rules for crop water need.
• 2 SQWRL queries for the results after the reasoning.
Each rule is put in a rule file with a “.rule” extension. The rule files are available on the GitLab repository of INRAE via the following linkhttps://gitlab.irstea.fr/irrig/public/tree/master/Rule.
The DSS consists of (1) a knowledge base and an inference engine, mostly for high-level context inference, and (2) several functions for numeric data calculation. Except for the case of SleepingDuration, it is a numeric value, but the inference engine produces its value. The knowledge-base contains a rules-base and a facts-base. Technically speaking, the DSS is a part of the Ontogen program. Each day, the DSS takes phenomenon observations as input and produces an irrigation decision. Please note that the Arvalis dataset does not provide the sensor measurements but the daily aggregated values of those measurements.
Figure7shows the algorithm implemented by the DSS. At 06:00:00 on day d, the system triggers the DSS to start the computation. First, the DSS retrieves the observations relevant to days d-1 and d recorded in the Arvalis dataset. Please note that in the algorithm of Figure7, the data retrieved at the instant [d 06:00:00] belong to the period [d-1 00:00:00, d 06:00:00]. The DSS checks the value of the evaluation of the CropGrowth property of day d-1. As the IRRINOV®method is valid only when the state of CropGrowth is from V7 to R5hg45, then the DSS has three possible cases: (1) if the state of CropGrowth is less than V7, then the DSS waits until the next day to reevaluate the CropGrowth, (2) if the state of CropGrowth equals R5hg45, then the DSS stops, and (3) if the state of CropGrowth is between V7 and R5hg45, then the DSS continues to retrieve rules to create a fact related to CropGrowth. The fact integrates rules as axioms. After determining the fact, the DSS can launch the Drools inference engine to infer the state of CropGrowth for day d-1. Next, the DSS runs the functions to obtain the value of the root zone average moisture of day d-1 and to obtain the number of delay days. The function to obtain the value of root zone average moisture takes the value of the average moisture of day d-1 corresponding to each soil tensiometer from the Arvalis dataset. Additionally, the function to obtain the number delay days takes the value of the total rain quantity of day d-1 from the Arvalis dataset. The DSS collects all calculated results and retrieves the other rules related to RainIntensity, RootZoneMoistureLevel and CropWaterNeed properties and updates them. Later, the Drools inference engine infers the state of the three mentioned properties and the value of SleepingDuration. Based on the state of CropWaterNeed, the DSS offers two solutions: (1) if the state of CropWaterNeed is Yes, the DSS suggests that users launch irrigation on day d; otherwise, (2) if the state of CropWaterNeed is No, NotApplicable or Unavailable, the DSS suggests that users do nothing. After producing the
suggestion, the system saves the results of all computations into the knowledge base. Finally, the DSS continues to wait until 06:00:00 of the next day (d+1).
evaluate CropWaterNeed [d-1 00:00:00, d 00:00:00[ read getDailyAggregatedMoisture [d-1 06:00:00, d 06:00:00[ run getRootZoneDailyAverageMoisture [d-1 06:00:00, d 06:00:00[ wait until 06:00:00 CropWaterNeed ? launch Irrigation between
[d 06:00:00, d+1 06:00:00[
save all data and context of the day d retrieve data needed for
the day d = today
Knowledge Base Archive
Arvalis Dataset
read getRainDailyTotalQuantity [d-1 06:00:00, d 06:00:00[
retrieve relevant rules
run getDelay [d-1 06:00:00, d 06:00:00[
evaluate RootZoneMoistureLevel
[d-1 00:00:00, d 00:00:00[ [d-1 00:00:00, d 00:00:00[evaluate RainIntensity Last Crop Stage ?
Last Crop Stage < V7 Last Crop Stage = R5hg45
V7 <= Last Crop Stage < R5hg45
retrieve relevant rules
evaluate CropGrowth [d-1 00:00:00, d 00:00:00[
CropWaterNeed = No OR NotApplicable OR Unavailable CropWaterNeed = Yes
create relevant facts of the day d
create relevant facts of the day d
Temporal Knowledge Base
Legend
Ontogen inference engine Ontogen aggregator Arvalis function
evaluate SleepingDuration [d 00:00:00, d+1 00:00:00[
4.4. CAS Testing
CASO and IRRIG are examined using an ontological testing tool. The project also develops a group of unit tests and sample test scenarios to verify the working mechanism of the system.
4.4.1. Ontology Evaluation
The presented ontologies have been evaluated following three approaches: checking the absence of bad practices, coverage and data-oriented validation.
To check the absence of bad practices or common errors in the ontology, the online pitfall scanner OOPS! [25] has been applied to IRRIG and CASO. After executing the system, the following changes were made: (1) define some properties as the inverse of corresponding properties, (2) add metadata as rdfs:labeland rdfs:comment for ontology elements, and (3) properly enter some ontology elements as OWL classes or properties.
Regarding the competency questions coverage, the IRRIG ontology, which as already mentioned contains CASO, has been compared to the CQ previously defined. For each CQ, the ontology elements need to answer the questions that have been identified.
Finally, we checked whether the data from our use case could be annotated with the ontologies. To do this, an RDF file representing one day of measurements from the Arvalis dataset in 2013 was generated. Some examples from this file are outlined in detail in Section5.
4.4.2. System Testing
The project develops multiple unit tests and sample tests to evaluate the rules and aggregations. The sample test scenarios contain specific data from the Arvalis dataset.
• 20 test scenarios for crop growth workflow. • 14 test scenarios for rain intensity workflow. • 21 test scenarios for soil moisture workflow. • 83 test scenarios for crop water need workflow. 4.5. CAS Maintenance
CASO and IRRIG are maintained based on a GitHub repository, and the smart irrigation project is maintained using a GitLab repository.
4.5.1. Ontology Publication and Maintenance
The key factor in maintaining the two ontologies is the interactions between our maintainer team and the community. Then, the CASO and IRRIG ontologies must be published online. The publication of the CASO and IRRIG ontologies relies on thehttps://w3id.org/permanent identifiers initiative. The ontology publication follows the content negotiation mechanism. The URIshttps:
//w3id.org/def/caso#andhttps://w3id.org/def/irrig#identify the two ontologies. The content
negotiation mechanism deployed to publish the ontologies was transparent to ontology developers, as it was managed by OnToology [26]. OnToology is a web-based system that builds on top of Git-based environments and integrates a set of tools for documentation, evaluation and publication activities. The HTML published was generated by OnToology’s integrated version of Widoco [27] and manually updated to include information about the ontology using a general description and diagrams.
The issue tracker provided by GitHub is the tool used to receive feedback and control issue lists. In addition to this portal, CASO and IRRIG developers also provide maintainer email addresses that enable another method for the community to contact.
4.5.2. System Maintenance
A smart irrigation CAS is still in development by our team. We have implemented and tested all the processes located on the server. Now, we need to improve the development of the sensor and actuator network. To maintain the system and continue with development, we use a private GitLab repository. This repository is open to identified users. Thus, those users can indicate issues to the development team using the issue tracker.
5. Example of CAS Development
The development of CAS produces complex design works of many entities related to rain intensity, crop growth, root zone moisture level and crop water needs. Figure8shows the four workflows in this project. In a limited scope, this paper presents a part of the design activity that shows the transformation from soil moisture measurement to the state of the RootZoneMoistureLevel property. We select this transformation because it contains a temporal aggregation and a spatial aggregation. Moreover, the data used as the illustration in this part is the date 14/08/2013 in the Arvalis data.
A tensiometer measures the soil tension [28]. The soil tension affects the water extraction capability of crops:
• When the soil tension is low, the crops require less energy to extract soil water. In other words, when a tensiometer returns a high value, the soil moisture level is low.
• When the soil tension is high, the crops must use a large amount of energy to extract soil water. The IRRINOV®method evaluates the water needs of crops by estimating the root zone moisture. Root zone moisture is the quantity of “water remaining in the depth of soil accessed by a plant” [29]. It depends on the soil type, root depth and irrigation method. Its goal is to evaluate the amount of irrigation water required by the plants [30]. The system uses six tensiometers to evaluate the root zone moisture.
Soil30cmDeph
MoistureObservation AverageMoistureObservationSoil30cmDepthDaily RootZoneDailyAverageMoistureObservation RootZoneMoistureLevelDeduction
CropWaterNeed Deduction SleepingDuration Observation RainIntenstiy Deduction CropGrowth Deduction RainDailyTotalQuantity Observation DelayDuration Observation
Soil Moisture workflow Crop Water Needworkflow
Legend
Presented in the example Not presented in the example
Ontogen aggregator Arvalis function
Ontogen inference engine
CropGrowth Observation
RainQuantity Observation
Rain Quantity workflow Crop Growth workflow
Figure 8.Four workflows of the CAS.
RootZoneMoistureLevel is an observational property of the root zone feature of interest. The RootZoneMoistureLevel property is qualitative data represented by a state. These states are determined based on tensiometer measurements. Each tensiometer is placed at a specific depth in the soil. Thus, the RootZoneMoistureLevel property depends on the following quantitative data properties: • Soil30cmDepthMoisture: the moisture of a new feature of interest that represents the soil layer at
• Soil60cmDepthMoisture: the moisture of a new feature of interest that represents the soil layer at a 60 cm depth (Soil60cmDepth).
• Soil30cmDepthDailyAverageMoisture: the daily average moisture of the feature of interest Soil30cmDepth. It equals the daily average of the property Soil30cmDepthMoisture.
• Soil60cmDepthDailyAverageMoisture: the daily average moisture of the feature of interest Soil60cmDepth. It equals the daily average of the property Soil60cmDepthMoisture.
• RootZoneDailyAverageMoisture: the daily average moisture of the root zone feature of interest. It represents a spatial aggregation of Soil30cmDepthDailyAverageMoisture and Soil60cmDepthDailyAverageMoisture properties.
The section aims to present some activities of the mini-waterfall methodology. Please note that the specification activity is already described in Section4.1. This activity has produced a set of requirements. The design activity is divided into two parts: process conceptualization and ontology conceptualization. The ontology conceptualization activity uses ontologies to model the input and output of each process previously defined. The implementation activity presents the rule associated with the soil moisture stream. Finally, the testing activity shows some typical test cases.
5.1. Processes Conceptualization
This subsection presents in detail the processes related to the soil moisture stream. A sequence of processes builds a specific workflow, as shown in Figure8.
5.1.1. Aggregation Processes of Soil Measurement
The first aggregation process is the computation of the daily aggregated soil moisture of the soil tensiometer. In the Arvalis dataset, each observation was stored as two datapoints: (1) the daily aggregated soil moisture in cbar and (2) the date of observation (year, month, day). Three soil tensiometers observe the moisture at a 30 cm depth, and three others observe the moisture at a 60 cm depth. The soil tensiometers used in the IRRINOV®method are Watermark probes. Watermark probe p measures the soil moisture at time t of day d. The unit of the Watermark probe is the cbar. Please note that a measurement value of 199 cbar indicates an error in the measurement process. Thus, the cleaning process is applied to remove all 199 cbar values. The function getValidMoistureProbe(p,t) returns only the valid moisture value measured by probe p at time t. If the moisture value is not valid, the function returns nothing. The function getDailyAggregatedMoisture(p,d) returns the average value of all the valid moisture values measured by probe p during the interval [d 00:00:00, d+1 00:00:00[. Table
3presents the calculation of getDailyAggregatedMoisture(p,d) for one probe. Please note that the data recorded in the Arvalis data are, in fact, the value of the function getDailyAggregatedMoisture(p,d).
Table 3.The function getDailyAggregatedMoisture(p,d).
getDailyAggregatedMoisture(p, d) =∑
n
i=1getValidMoistureProbe(p, ti)
n on the condition that ti⊂[d 00:00:00, d+1 00:00:00[
where
• d: a specific day, e.g., 14/08/2013
• ti: a specific instant of day d, e.g., 08:00:00 on 14/08/2013
• getValidMoistureProbe(p, ti): the valid moisture value measured by the probe p at the specific
time ti.
• n: the number of valid moisture values measured during day d.
Suppose that p1, p2, and p3 are the three probes at a 30 cm depth, and p4, p5, and p6 are the three probes at a 60 cm depth. The function getRootZoneDailyAverageMoisture(d) returns the sum of the
two median values: (1) the median of the getDailyAggregatedMoisture(p, d) values of three probes at a 30 cm depth, and (2) the median of the getDailyAggregatedMoisture(p, d) values of three probes at a 60 cm depth. Table4presents the calculation of getRootZoneDailyAverageMoisture(d).
Table 4.The function getRootZoneDailyAverageMoisture(d).
getRootZoneDailyAverageMoisture(d) =Median(getDailyAggregatedMoisture(p1, d), getDailyAggregatedMoisture(p2, d), getDailyAggregatedMoisture(p3, d)) +Median(getDailyAggregatedMoisture(p4, d), getDailyAggregatedMoisture(p5, d), getDailyAggregatedMoisture(p6, d)) where
• p1, p2, and p3: three watermark probes placed at a 30 cm depth • p4, p5, and p6: three watermark probes placed at a 60 cm depth
• getDailyAggregatedMoisture(pi,d): returns the average moisture value measured by the probe
piduring the interval [d 00:00:00, d+1 00:00:00[ (see Table3)
• Median(x, y, z): is the median value of x, y and z.
5.1.2. State of RootZoneMoistureLevel Property
The output of rules are the daily states of the RootZoneMoistureLevel property. For each day, a state should be determined. The list of possible states is as follows:
• RootZoneMoistureLevel.Init: This state represents the fact that the function getRootZoneDailyAverageMoisture(d) will be evaluated from new measurements of tensiometers. The tensiometers will perform several measurements per day. This state is not an output of the automata. It is a transitional state before determining the new state of the RootZoneMoistureLevel property
• RootZoneMoistureLevel.Saturated: The root zone is saturated by water. Crops do not need extra water. Moreover, any machine is allowed to access the plot.
• RootZoneMoistureLevel.VeryHigh: The root zone contains a significantly high amount of water. Crops do not need water regardless of its growth stage.
• RootZoneMoistureLevel.High: The root zone contains a high amount of water. Crops need water at specific growth stages.
• RootZoneMoistureLevel.Average: The root zone contains an average amount of water. Crops need water at specific growth stages.
• RootZoneMoistureLevel.Low: The root zone contains a low amount of water. Crops need water at specific growth stages.
• RootZoneMoistureLevel.VeryLow: The root zone contains an insignificant amount of water. Crops need water at specific growth stages.
• RootZoneMoistureLevel.Dry: The root zone is dry. Crops need water regardless of its growth stage.
The states of the RootZoneMoistureLevel property follow the order VeryLow < Low < Average < High < VeryHigh < Saturated. Those states follow the inverse order of the value of the function
5.1.3. Threshold
Certain thresholds are used to determine the state of the RootZoneMoistureLevel property from the result of the function getRootZoneDailyAverageMoisture(d). Please note that these thresholds depend on the variety of maize crops and soil types.
• Th_ST_Minimum: The smallest value measured by a Watermark probe. In the Watermark’s specification, it is fixed at 0 cbar.
• Th_ST_Saturation: This threshold value in the Arvalis experimentation is 10 cbar. • Th_ST_VeryHigh: This threshold value in the Arvalis experimentation is 70 cbar. • Th_ST_High: This threshold value in the Arvalis experimentation is 120 cbar. • Th_ST_Average: This threshold value in the Arvalis experimentation is 140 cbar. • Th_ST_Low: This threshold value in the Arvalis experimentation is 150 cbar. • Th_ST_VeryLow: This threshold value in the Arvalis experimentation is 160 cbar.
• Th_ST_Maximum: This is set to 301 cbar, which is higher than any measurement value provided by any Watermark probe. The maximal measurement value that a Watermark probe can reach ranges from 0 to 200. However, to compute the soil tension, the manufacturer provides a coefficient. The measurement value is multiplied by the coefficient to obtain the soil tension value. The maximum coefficient provided by Watermark’s manufacturer is 1.5 (from 2002 until now), and the maximal soil tension value is 300 cbar (200 cbar * 1.5).
The relations between thresholds and states of the RootZoneMoistureLevel property are presented in Figure9. The blue squares represent the state of the RootZoneMoistureLevel property. The green squares represent the soil tension thresholds. The dashed line squares represent a RootZoneDailyAverageMoisture(d) value. Each of the squares’ positions show the upper threshold and the lower threshold. For example, if the RootZoneDailyAverageMoisture(d) value is superior or equal to Th_ST_Low (150) and inferior to the Th_ST_VeryLow (160), then the RootZoneMoistureLevel state is VeryLow.
VeryLow < Low < Average < High < VeryHigh < Saturated
160 Dry < 150 140 120 70 10 Th_ST_V eryLow Th_ST_Low Th_ST_A verage Th_ST_High Th_ST_V eryHigh Th_ST_Saturation >= > > >= > >= >= > >= > >= > 0 Th_ST_Minimum 301 Th_ST_Maximum > >=
Figure 9.Relation between states and thresholds of root zone moisture level. 5.1.4. State Diagram
The state diagram presents the inference conception to deduce the state of the RootZoneMoistureLevel property based on the result of the function getRootZoneDailyAverageMoisture(d). In the diagram illustrated in Figure10, there are eight states and ten transitions. The variable tsoilrepresents a clock dedicated to the RootZoneMoistureLevel property that has a time step of one day.