FERMI NATIONAL ACCELERATOR LABORATORY
FERMILAB-CONF-14-227-E-TD TEVEWWG/top2014/01 CDF Note 11105 DØ Note 6444 July 2014Combination of CDF and DØ results on the
mass of the top quark using up to 9.7 fb
−1
at
the Tevatron
The Tevatron Electroweak Working Group
1for the CDF and DØ Collaborations
Abstract
We summarize the current top-quark mass measurements from the CDF and DØ experi-ments at Fermilab. We combine published Run I (1992–1996) results with the most precise published and preliminary Run II (2001–2011) measurements based on data corresponding to up to 9.7 fb−1 of p¯p collisions. Taking correlations of uncertainties into account, and combining the statistical and systematic uncertainties, the resulting preliminary Tevatron average mass of the top quark is Mt= 174.34 ± 0.64 GeV/c2, corresponding to a relative
precision of 0.37%.
1The Tevatron Electroweak Working Group can be contacted at tev-ewwg@fnal.gov.
More information can be found at http://tevewwg.fnal.gov.
1
Introduction
This note reports the averaged mass of the top quark (Mt) obtained by combining the most
precise published and preliminary Tevatron measurements of its mass at the Tevatron. This updates the combination presented in Refs. [1] and [2]. Reference [2] provides a detailed de-scription of the systematic uncertainties. In March 2014, the CDF, DØ ATLAS and CMS col-laborations also provided a combination of their most precise top-quark mass measurements [3]. The CDF and DØ collaborations have performed several direct measurements of the top-quark mass using data collected at the Tevatron proton-antiproton collider located at the Fermi National Accelerator Laboratory. The pioneering measurements were first based on approximately 0.1 fb−1of Run I data [4, 5, 6, 7, 8, 9, 10, 11, 12, 13, 14, 15] collected from 1992 to 1996 that included results from tt → W+bW−b → qq0bqq0b (all-jets), tt → W+bW−b → `νbqq0b (`+jets), and tt → W+bW−b → `+νb`−νb (``) channels, where ` = e or µ. Decays of W → τ ν
τ
followed by τ → e, µ are included in the direct W → e and W → µ channels. Run II (2001– 2011) had many top mass measurements, and those considered in this paper are the most recent results in these channels, using up to 9.3 fb−1 of data for CDF (corresponding to the
full CDF Run II data) [16, 17, 18, 19], and up to 9.7 fb−1 of data for DØ (corresponding to
the full DØ Run II data) [20, 21]. The CDF analysis based upon charged-particle tracking for exploiting the transverse decay length of b-tagged jets (LXY) and the transverse momentum of
electrons and muons from W boson decays (plepT ) using data corresponding to a luminosity of 1.9 fb−1 [22], has no plans for an update.
With respect to the March 2013 Tevatron combination [1], the Run II CDF measurements in the `` and all-jets channels have been updated using their full Run II data [18, 19]. The now published Run II CDF measurements in the `+jets channel [17] and 6ET+jets (MEt) channel [16]
are unchanged. The measurement based on charged-particle tracking [22] was incorporated as described in the past combinations [23]. Possible correlation with the `+jets channel is discussed in that same reference. The Run II DØ measurement in the `+jets channel has been updated using the full Run II data [20]. This result is from Spring 2014 and was just accepted for publication in Phys. Rev. Lett. The measurement in the `` channel is published and unchanged [21].
The Tevatron average Mt is obtained by combining five published Run I measurements [5,
6, 8, 10, 13, 14] with five published Run II results [16, 17, 22, 21, 20] and two preliminary Run II CDF results [18, 19]. This combination supersedes previous combinations [1, 23, 25, 26, 27, 28, 29, 30, 31, 32, 33].
The definition and evaluation of the systematic uncertainties and of the correlations among channels, experiments, and Tevatron runs is the outcome of many years of joint effort between the CDF and DØ collaborations that is described in detail in Ref. [2].
Carlo (MC) top-quark mass definition. It is expected that the difference between the MC mass definition and the formal pole mass of the top quark is below 1 GeV [35].
The input measurements and uncertainty categories used in the combination are detailed in Sections 2 and 3, respectively. The correlations assumed in the combination are discussed in Section 4, and the resulting Tevatron average top-quark mass is given in Section 5. A summary is presented in Section 6.
2
Input Measurements
The twelve measurements of Mt used in this combination are shown in Table 1. The Run I
measurements all have relatively large statistical uncertainties and their systematic uncertain-ties are dominated by the total jet energy scale (JES) uncertainty. In Run II both CDF and DØ take advantage of the larger tt samples available and employ new analysis techniques to reduce both of these uncertainties. In particular, the Run II DØ analysis in the `+jets channel and the Run II CDF analyses in the `+jets, all-jets, and MEt channels constrain the response of light-quark jets using the kinematic information from W → qq0 decays (the so-called in situ
calibration) [10, 34]. Residual JES uncertainties associated with pT and η dependencies as
well as uncertainties specific to the response of b jets are treated separately. The Run II DØ `` measurement uses the JES determined in the `+jets channel through the in situ calibration [21]. The DØ Run II `+jets result is the most accurate single result from the Tevatron and it is accepted for publication [20]. The DØ Run II `` result is based on a neutrino weighting technique using 5.4 fb−1 of data [21]. Unlike the other inputs, the CDF all-jets measurement [19] uses a NLO generator as default program to model tt events (POWHEG [36]).
Table 1 lists the individual uncertainties in each result, subdivided into the categories de-scribed in the next Section. The correlations between the inputs are dede-scribed in Sec. 4.
3
Uncertainty Categories
We employ uncertainty categories similar to those used for the previous Tevatron average [1, 2], with small modifications to better account for their correlations. They are divided into sources of same or similar origin that are combined as in Ref. [2]. For example, the Signal modeling (Signal) category discussed below includes the uncertainties from different systematic sources that are correlated due to their origin in the modeling of the simulated signal.
Some systematic uncertainties have been separated into multiple categories to accommodate specific types of correlations. For example, the jet energy scale (JES) uncertainty is subdivided
Table 1: Summary of the measurements used to determine the Tevatron average Mt. Integrated
luminosity (R
L dt) has units of fb−1, and all other numbers are in GeV/c2. The uncertainty
categories and their correlations are described in Section 3. The total systematic uncertainty and the total uncertainty are obtained by adding the relevant contributions in quadrature. The symbols “n/a” stands for “not applicable”, “n/e” for “not evaluated”.
Run I published Run II published Run II prel.
CDF DØ CDF DØ CDF
`+jets `` all-jets `+jets `` `+jets Lxy MEt `+jets `` `` all-jets
R
L dt 0.1 0.1 0.1 0.1 0.1 8.7 1.9 8.7 9.7 5.4 9.1 9.3 Result 176.1 167.4 186.0 180.1 168.4 172.85 166.90 173.93 174.98 174.00 170.80 175.07 In situ light-jet
cali-bration (iJES) n/a n/a n/a n/a n/a 0.49 n/a 1.05 0.41 0.55 n/a 0.97 Response to b/q/g
jets (aJES) n/a n/a n/a 0.0 0.0 0.09 0.00 0.10 0.16 0.40 0.18 0.02 Model for b jets
(bJES) 0.6 0.8 0.6 0.7 0.7 0.16 0.00 0.17 0.09 0.20 0.28 0.20 Out-of-cone correction
(cJES) 2.7 2.6 3.0 2.0 2.0 0.21 0.36 0.18 n/a n/a 1.65 0.37 Light-jet response (1)
(rJES) 3.4 2.7 4.0 n/a n/a 0.48 0.24 0.40 n/a n/a 1.72 0.42 Light-jet response (2)
(dJES) 0.7 0.6 0.3 2.5 1.1 0.07 0.06 0.04 0.21 0.56 0.46 0.09 Lepton modeling
(LepPt) n/e n/e n/e n/e n/e 0.03 0.00 n/a 0.01 0.35 0.36 n/a Signal modeling (Signal) 2.6 2.9 2.0 1.1 1.8 0.61 0.90 0.63 0.35 0.86 0.96 0.53 Jet modeling (DetMod) 0.0 0.0 0.0 0.0 0.0 0.00 0.00 0.00 0.07 0.50 0.00 0.00 b-tag modeling (b-tag) 0.4 0.0 0.0 0.0 0.0 0.03 0.00 0.03 0.10 0.00 0.05 0.04 Background from theory (BGMC) 1.3 0.3 0.0 1.0 1.1 0.12 0.80 0.00 0.06 0.00 0.30 0.00 Background based on data (BGData) 0.0 0.0 1.7 0.0 0.0 0.16 0.20 0.15 0.09 0.20 0.33 0.15 Calibration method (Method) 0.0 0.7 0.6 0.6 1.1 0.05 2.50 0.21 0.07 0.51 0.19 0.87 Offset
(UN/MI) n/a n/a n/a 1.3 1.3 n/a n/a n/a n/a n/a n/a n/a Multiple interactions
model (MHI) n/e n/e n/e n/e n/e 0.07 0.00 0.18 0.06 0.00 0.30 0.22 Systematic uncertainty
(syst) 5.3 4.9 5.7 3.9 3.6 0.98 2.82 1.36 0.63 1.49 2.69 1.55 Statistical uncertainty
(stat) 5.1 10.3 10.0 3.6 12.3 0.52 9.00 1.26 0.41 2.36 1.83 1.19 Total uncertainty 7.3 11.4 11.5 5.3 12.8 1.12 9.43 1.85 0.76 2.80 3.26 1.95
into six components to more accurately accommodate our best understanding of the relevant correlations among input measurements.
In this note we use the new naming scheme described in Ref. [2]. The previous names of the systematic uncertainties are also provided.
Statistical uncertainty (Statistics): The statistical uncertainty associated with the Mt
de-termination.
In situ light-jet calibration (iJES): That part of the JES uncertainty that originates from in situ calibration procedures and is uncorrelated among the measurements. In the com-bination reported here, it corresponds to the statistical uncertainty associated with the
JES determination using the W → qq0 invariant mass in the CDF Run II `+jets, all-jets, and MEt measurements, and in the DØ Run II `` and `+jets measurements. Residual JES uncertainties arising from effects not considered in the in situ calibration are included in other categories. For the DØ Run II `` measurement, the uncertainty coming from transferring the `+jets calibration to the dilepton event topology is quoted in the Light-jet response (2) (dJES) category described below.
Response to b/q/g jets (aJES): That part of the JES uncertainty that originates from average differences in detector electromagnetic over hadronic (e/h) response for hadrons produced in the fragmentation of b-quark and light-quark jets.
Model for b jets (bJES): That part of the JES uncertainty that originates from uncertain-ties specific to the modeling of b jets and that is correlated across all measurements. For both CDF and DØ this includes uncertainties arising from variations in the semileptonic branching fractions, b-fragmentation modeling, and differences in the color flow between b-quark jets and light-quark jets. These were determined from Run II studies but back-propagated to the Run I measurements, whose Light-jet response (1) uncertainties (rJES, see below) were then corrected to keep the total JES uncertainty constant.
Out-of-cone correction (cJES): That part of the JES uncertainty that originates from mod-eling uncertainties correlated across all measurements. It specifically includes the model-ing uncertainties associated with light-quark fragmentation and out-of-cone corrections. For DØ Run II measurements, it is included in the Light-jet response (2) (dJES) category. Light-jet response (1) (rJES): The remaining part of the JES uncertainty that covers the absolute calibration for CDF’s Run I and Run II measurements. It also includes small contributions from the uncertainties associated with modeling multiple interactions within a single bunch crossing and corrections for the underlying event.
Light-jet response (2) (dJES): That part of the JES uncertainty that includes DØ’s Run I and Run II calibrations of absolute response (energy dependent), the relative response (η-dependent), and the out-of-cone showering correction that is a detector effect. This uncer-tainty term for CDF includes only the small relative response calibration (η-dependent) for Run I and Run II.
Lepton modeling (LepPt): The systematic uncertainty arising from uncertainties in the scale of lepton transverse momentum measurements. It was not considered as a source of systematic uncertainty in the Run I measurements.
Signal modeling (Signal): The systematic uncertainty arising from uncertainties in tt mod-eling that is correlated across all measurements. This includes uncertainties from vari-ations of the amount of initial and final state radiation and from the choice of parton density function used to generate the tt Monte Carlo samples that calibrate each method. When appropriate it also includes the uncertainty from higher-order corrections evaluated from a comparison of tt samples generated by MC@NLO [37] and ALPGEN [38], both
interfaced to HERWIG [39, 40] for the simulation of parton showers and hadronization. In this combination, the systematic uncertainty arising from a variation of the phenomeno-logical description of color reconnection (CR) between final state particles [41, 42] is included in the Signal modeling category. The CR uncertainty is obtained by taking the difference between the PYTHIA 6.4 tune “Apro” and the PYTHIA 6.4 tune “ACRpro” that differ only in the CR model. In the latest analysis in the `+jets channel, DØ uses the following samples: PYTHIA with Perugia 2011 versus Perugia 2011NOCR tunes to estimate the uncertainty due to the CR model. This uncertainty was not evaluated in Run I since the Monte Carlo generators available at that time did not allow for variations of the CR model. These measurements therefore do not include this source of systematic uncertainty. Finally, the systematic uncertainty associated with variations of the MC generator used to calibrate the mass extraction method is added. It includes variations observed when substituting PYTHIA [43, 44, 45] (Run I and Run II) or ISAJET [46] (Run I) for HERWIG [39, 40] when modeling the tt signal.
Jet modeling (DetMod): The systematic uncertainty arising from uncertainties in the mod-eling of jet interactions in the detector in the MC simulation. For DØ this includes un-certainties from jet resolution and identification. Applying jet algorithms to MC events, CDF finds that the resulting efficiencies and resolutions closely match those in data. The small differences propagated to Mt lead to a negligible uncertainty of 0.005 GeV, which
is then ignored.
b-tag modeling (b-tag): This is the part of the uncertainty related to the modelling of the b-tagging efficiency and the light-quark jet rejection factors in the MC simulation with respect to the data.
Background from theory (BGMC): This systematic uncertainty on the background origi-nating from theory (MC) takes into account the uncertainty in modeling the background sources. It is correlated between all measurements in the same channel, and includes un-certainties on the background composition, normalization, and shape of different compo-nents, e.g., the uncertainties from the modeling of the W +jets background in the `+jets channel associated with variations of the factorization scale used to simulate W +jets events.
Background based on data (BGData): This includes, among other sources, uncertainties associated with the modeling using data of the QCD multijet background in the all-jets, MEt, and `+jets channels and the Drell-Yan background in the `` channel. This part is uncorrelated between experiments.
Calibration method (Method): The systematic uncertainty arising from any source specific to a particular fit method, including the finite Monte Carlo statistics available to calibrate each method.
Offset (UN/MI): This uncertainty is specific to DØ and includes the uncertainty arising from uranium noise in the DØ calorimeter and from the multiple interaction corrections to the
JES. For DØ Run I these uncertainties were sizable, while for Run II, owing to the shorter calorimeter electronics integration time and in situ JES calibration, these uncertainties are negligible.
Multiple interactions model (MHI): The systematic uncertainty arising from a mismod-eling of the distribution of the number of collisions per Tevatron bunch crossing owing to the steady increase in the collider instantaneous luminosity during data-taking. This uncertainty has been separated from other sources to account for the fact that it is un-correlated between experiments.
These categories represent the current preliminary understanding of the various sources of uncertainty and their correlations. We expect these to evolve as we continue to probe each method’s sensitivity to the various systematic sources with improving precision.
4
Correlations
The following correlations are used for the combination:
• The uncertainties in the Statistical uncertainty (Stat) and Calibration method (Method) categories are taken to be uncorrelated among the measurements.
• The uncertainties in the In situ light-jet calibration (iJES) category are taken to be uncorrelated among the measurements except for D0’s `` and `+jets measurements, where this uncertainty is taken to be 100% correlated since the `` measurement uses the JES calibration determined in `+jets channel.
• The uncertainties in the Response to b/q/g jets (aJES), Light-jet response (2) (dJES), Lepton modeling (LepPt), b-tag modeling (b-tag) and Multiple interactions model (MHI) categories are taken to be 100% correlated among all Run I and all Run II measurements within the same experiment, but uncorrelated between Run I and Run II and uncorrelated between the experiments.
• The uncertainties in the Light-jet response (1) (rJES), Jet modeling (DetMod), and Offset (UN/MI) categories are taken to be 100% correlated among all measurements within the same experiment but uncorrelated between the experiments.
• The uncertainties in the Backgrounds estimated from theory (BGMC) category are taken to be 100% correlated among all measurements in the same channel.
• The uncertainties in the Backgrounds estimated from data (BGData) category are taken to be 100% correlated among all measurements in the same channel and same run period, but uncorrelated between the experiments.
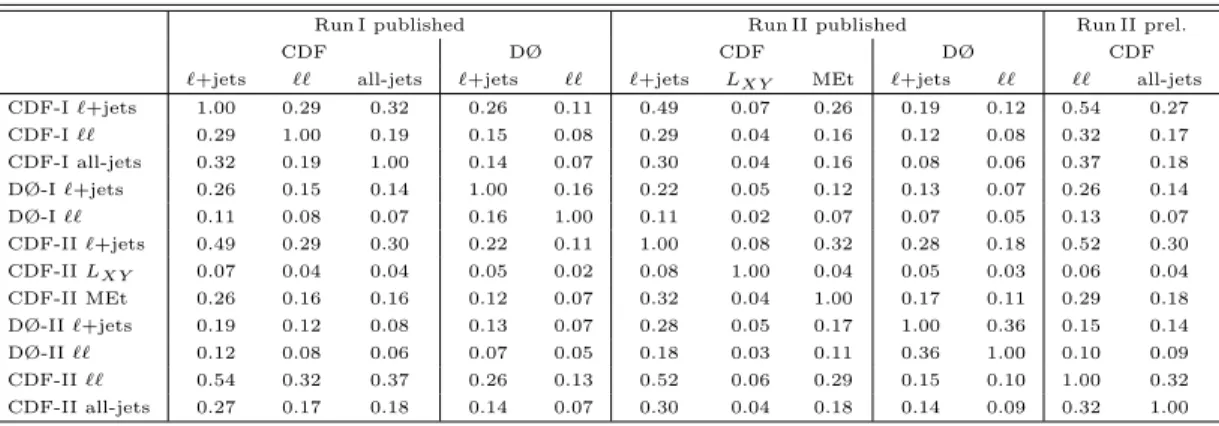
Table 2: The matrix of correlation coefficients used to determine the Tevatron average top-quark mass.
Run I published Run II published Run II prel.
CDF DØ CDF DØ CDF
`+jets `` all-jets `+jets `` `+jets LXY MEt `+jets `` `` all-jets
CDF-I `+jets 1.00 0.29 0.32 0.26 0.11 0.49 0.07 0.26 0.19 0.12 0.54 0.27 CDF-I `` 0.29 1.00 0.19 0.15 0.08 0.29 0.04 0.16 0.12 0.08 0.32 0.17 CDF-I all-jets 0.32 0.19 1.00 0.14 0.07 0.30 0.04 0.16 0.08 0.06 0.37 0.18 DØ-I `+jets 0.26 0.15 0.14 1.00 0.16 0.22 0.05 0.12 0.13 0.07 0.26 0.14 DØ-I `` 0.11 0.08 0.07 0.16 1.00 0.11 0.02 0.07 0.07 0.05 0.13 0.07 CDF-II `+jets 0.49 0.29 0.30 0.22 0.11 1.00 0.08 0.32 0.28 0.18 0.52 0.30 CDF-II LXY 0.07 0.04 0.04 0.05 0.02 0.08 1.00 0.04 0.05 0.03 0.06 0.04 CDF-II MEt 0.26 0.16 0.16 0.12 0.07 0.32 0.04 1.00 0.17 0.11 0.29 0.18 DØ-II `+jets 0.19 0.12 0.08 0.13 0.07 0.28 0.05 0.17 1.00 0.36 0.15 0.14 DØ-II `` 0.12 0.08 0.06 0.07 0.05 0.18 0.03 0.11 0.36 1.00 0.10 0.09 CDF-II `` 0.54 0.32 0.37 0.26 0.13 0.52 0.06 0.29 0.15 0.10 1.00 0.32 CDF-II all-jets 0.27 0.17 0.18 0.14 0.07 0.30 0.04 0.18 0.14 0.09 0.32 1.00
• The uncertainties in the Model for b jets (bJES), Out-of-cone correction (cJES), and Sig-nal modeling (SigSig-nal) categories are taken to be 100% correlated among all measurements.
Using the inputs from Table 1 and the correlations specified here, the resulting matrix of total correlation coefficients is given in Table 2.
The measurements are combined using a program implementing two independent
meth-ods: a numerical χ2 minimization and the analytic best linear unbiased estimator (BLUE)
method [47, 48]. The two methods are mathematically equivalent. It has been checked that they give identical results for the combination. The BLUE method yields the decomposition of the uncertainty on the Tevatron Mt average in terms of the uncertainty categories specified for
the input measurements [48].
5
Results
The resultant combined value for the top-quark mass is
Mt = 174.34 ± 0.37 (stat) ± 0.52 (syst) GeV/c2.
Adding the statistical and systematic uncertainties in quadrature yields a total uncertainty
of 0.64 GeV/c2, corresponding to a relative precision of 0.37% on the top-quark mass. The
combination has a χ2 of 10.8 for 11 degrees of freedom, corresponding to a probability of 46%, indicating good agreement among all input measurements. The breakdown of the uncertainties is shown in Table 3. The total statistical and systematic uncertainties are reduced relative to the Spring 2013 combination [1] and the published combination [2] due to the new, most
accurate, DØ `+jets analysis and a small improvement due to the CDF all-jets analysis. Both of these are based on the full data.
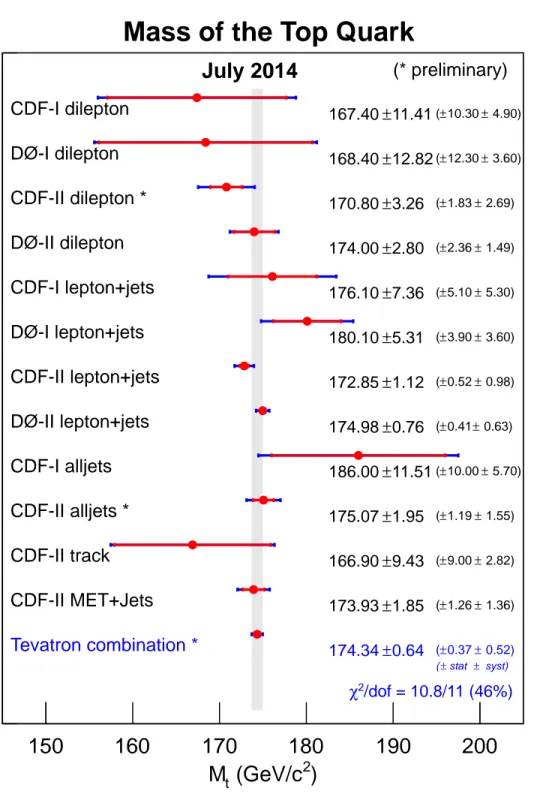
The pull and weight for each of the inputs obtained from the combination using the BLUE method, are listed in Table 4. The input measurements and the resulting Tevatron average mass of the top quark are summarized in Fig. 1.
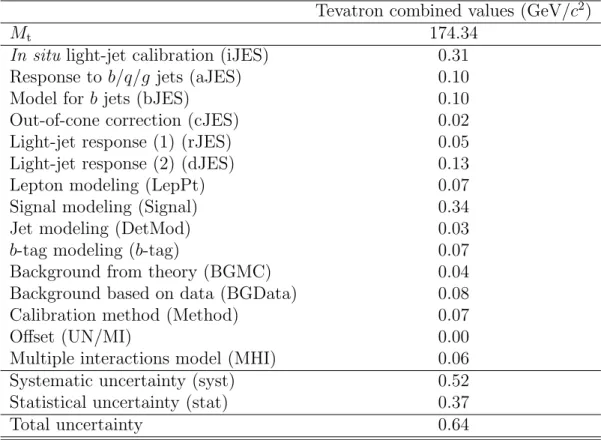
Table 3: Summary of the Tevatron combined average Mtand its uncertainties. The uncertainty
categories are described in the text. The total systematic uncertainty and the total uncertainty are obtained by adding the relevant contributions in quadrature.
Tevatron combined values (GeV/c2)
Mt 174.34
In situ light-jet calibration (iJES) 0.31
Response to b/q/g jets (aJES) 0.10
Model for b jets (bJES) 0.10
Out-of-cone correction (cJES) 0.02
Light-jet response (1) (rJES) 0.05
Light-jet response (2) (dJES) 0.13
Lepton modeling (LepPt) 0.07
Signal modeling (Signal) 0.34
Jet modeling (DetMod) 0.03
b-tag modeling (b-tag) 0.07
Background from theory (BGMC) 0.04
Background based on data (BGData) 0.08
Calibration method (Method) 0.07
Offset (UN/MI) 0.00
Multiple interactions model (MHI) 0.06
Systematic uncertainty (syst) 0.52
Statistical uncertainty (stat) 0.37
Total uncertainty 0.64
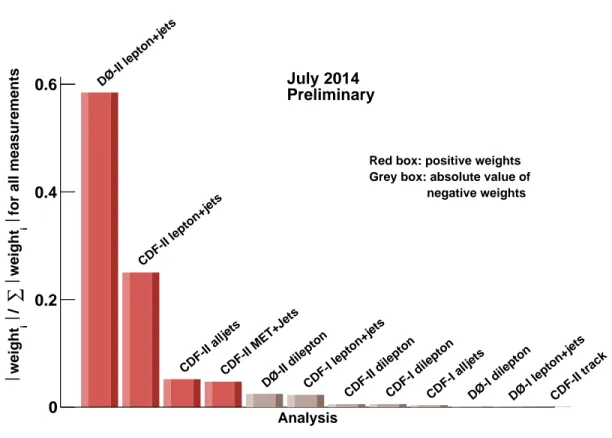
The weights of some of the measurements are negative, which occurs if the correlation between two measurements is larger than the ratio of their total uncertainties. In these instances the less precise measurement will acquire a negative weight. While a weight of zero means that a particular input is effectively ignored in the combination, channels with a negative weight affect the resulting central value of Mt and help reduce the total uncertainty [47]. To visualize
the weight that each measurement carries in the combination, Fig. 3 shows the absolute values of the weight of each measurement divided by the sum of the absolute values of the weights of all input measurements. Negative weights are represented by bins with a different (grey) color. We note that due to correlations between the uncertainties, the relative weights of the
Table 4: The pull and weight for each of the inputs obtained from the combination with the BLUE method used to determine the average top-quark mass.
Run I published Run II published Run II prel.
CDF DØ CDF DØ CDF
`+jets `` all-jets `+jets `` `+jets LXY MEt `+jets `` `` all-jets
Pull 0.24 −0.61 +1.01 +1.09 −0.46 −1.64 −0.791 −0.24 +1.60 −0.13 −1.11 0.39 Weight [%] −2.6 −0.7 −0.4 −0.1 −0.14 +28.8 +0.1 +5.5 +67.2 −2.9 −0.66 +6.0
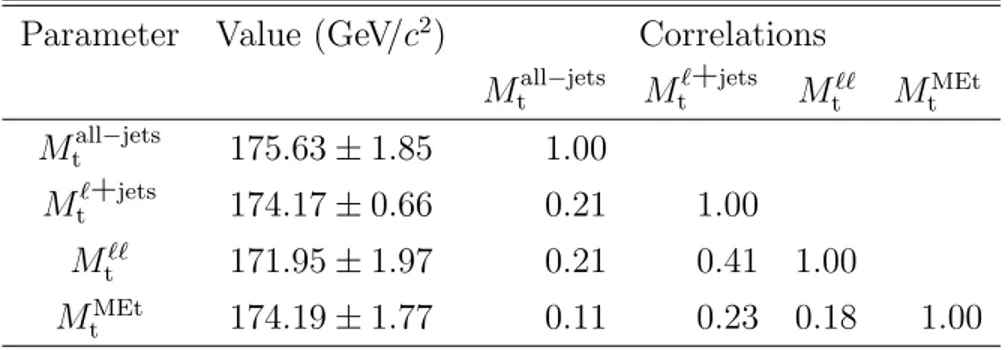
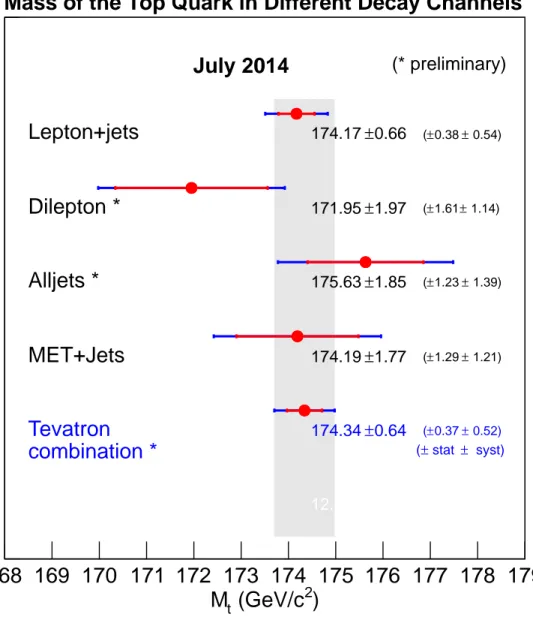
Table 5: Summary of the combination of the 12 measurements by CDF and DØ in terms of four physical quantities, the mass of the top quark in the all-jets, `+jets, ``, and MEt decay channels.
Parameter Value (GeV/c2) Correlations
Mtall−jets Mt`+jets M`` t MtMEt Mtall−jets 175.63 ± 1.85 1.00 Mt`+jets 174.17 ± 0.66 0.21 1.00 M`` t 171.95 ± 1.97 0.21 0.41 1.00 MtMEt 174.19 ± 1.77 0.11 0.23 0.18 1.00
different input channels may be significantly different from what would be expected from the total accuracy of each measurement represented by error bars in Fig. 1. A simular figure with
only Run II measurements, excluding CDF LXY measurement, is shown in Fig. 2
No input has an anomalously large pull. Nevertheless, it is still interesting to determine
the mass separately in the all-jets, `+jets, ``, and MEt channels (leaving out the LXY
mea-surement). We use the same methodology, inputs, uncertainty categories, and correlations as described above, but fit the four physical observables, Mtall−jets, M
`+jets
t , Mt``, and MtMEt
separately. The results of these combinations are shown in Fig. 4 and Table 5.
Using the results of Table 5 we calculate the following values including correlations: χ2(` +
jets − ``) = 1.52/1, χ2(` + jets − alljets) = 0.64/1, χ2(` + jets − MEt) = 0.00/1, χ2(`` −
alljets) = 2.34/1, χ2(`` − MEt) = 0.87/1, and χ2(alljets − MEt) = 0.36/1. These correspond to probabilities of 22%, 42%, 99%, 13%, 35%, and 55%, respectively, indicating that the top-quark mass determined in each decay channel is consistent in all cases.
In the same way, we can also fit two physical observables: the mass measured in CDF and
the one measured at DØ : MCDF
t and MtD0 separately. The result of these combinations is
shown in Table 6. The chi-squared value including correlations is χ2(CDF − D0) = 3.5/1
)
2(GeV/c
tM
150
160
170
180
190
200
0
15
CDF March'07 12.40 ±2.66 (±1.50 ± 2.20) Tevatron combination * 174.34 ±0.64 (±0.37 ± 0.52) syst) ± stat ± ( CDF-II MET+Jets 173.93 ±1.85 (±1.26 ± 1.36) CDF-II track 166.90 ±9.43 (±9.00 ± 2.82) CDF-II alljets * 175.07 ±1.95 (±1.19 ± 1.55) CDF-I alljets 186.00 ±11.51(±10.00 ± 5.70) DØ-II lepton+jets 174.98 ±0.76 (±0.41 ± 0.63) CDF-II lepton+jets 172.85 ±1.12 (±0.52 ± 0.98) DØ-I lepton+jets 180.10 ±5.31 (±3.90 ± 3.60) CDF-I lepton+jets 176.10 ±7.36 (±5.10 ± 5.30) DØ-II dilepton 174.00 ±2.80 (±2.36 ± 1.49) CDF-II dilepton * 170.80 ±3.26 (±1.83 ± 2.69) DØ-I dilepton 168.40 ±12.82(±12.30 ± 3.60) CDF-I dilepton 167.40 ±11.41(±10.30 ± 4.90)Mass of the Top Quark
(* preliminary)
July 2014
/dof = 10.8/11 (46%)
2
χ
Figure 1: Summary of the input measurements and resulting Tevatron average mass of the top quark. The red lines correspond to the statistical uncertainty while the blue lines show the total uncertainty.
)
2(GeV/c
tM
165
170
175
180
185
0
9
CDF March'07 12.40 ±2.66 (±1.50 ± 2.20) Tevatron combination * 174.34 ±0.64 (±0.37 ± 0.52) syst) ± stat ± ( DØ-II lepton+jets 174.98 ±0.76 (±0.41 ± 0.63) CDF-II lepton+jets 172.85 ±1.12 (±0.52 ± 0.98) CDF-II MET+Jets 173.93 ±1.85 (±1.26 ± 1.36) CDF-II alljets * 175.07 ±1.95 (±1.55 ± 1.19) DØ-II dilepton 174.00 ±2.80 (±2.36 ± 1.49) CDF-II dilepton * 170.80 ±3.26 (±1.83 ± 2.69)Mass of the Top Quark
(* preliminary)
July 2014
/dof = 10.8/11 (46%) 2
χ (Run I and Run II)
Figure 2: Summary of the input Run II measurements and resulting Tevatron average mass of the top quark.
Analysis
0 0.2 0.4 0.6
for all measurements
i weight ∑ / i weight DØ-II lepton+jets CDF-II lepton+jets
CDF-II alljetsCDF-II MET+Jets
DØ-II dileptonCDF-I lepton+jets
CDF-II dileptonCDF-I dileptonCDF-I alljetsDØ-I dileptonDØ-I lepton+jetsCDF-II track July 2014
Preliminary
Red box: positive weights Grey box: absolute value of
negative weights
Figure 3: Relative weights of the input measurements in the combination. The relative weights have been obtained by dividing the absolute value of each measurement weight by the sum over all measurements of the absolute values of the weights. Negative weights are represented by their absolute value, but using a grey color.
Table 6: Summary of the combination of the 12 measurements by CDF and DØ in terms of two physical quantities, the mass of the top quark measured in CDF and in DØ .
Parameter Value (GeV/c2) Correlations
MCDF t MtD0 MtCDF 173.12 ± 0.92 1.00 MD0 t 175.03 ± 0.74 0.25 1.00
6
Summary
An update was presented of the combination of measurements of the mass of the top quark from the Tevatron experiments CDF and DØ. This preliminary combination includes five
published Run I measurements, seven published Run II measurements, and two preliminary Run II measurements. Most of these measurements are performed with the full data. Taking into account the statistical and systematic uncertainties and their correlations, the preliminary result for the Tevatron average is Mt = 174.34 ± 0.37 (stat) ± 0.52 (syst) GeV/c2, where the
total uncertainty is obtained assuming Gaussian systematic uncertainties. The central value is 1.14 GeV/c2 higher than the Tevatron Spring 2013 average [1] of Mt = 173.20 ± 0.87 GeV/c2.
Adding in quadrature the statistical and systematic uncertainties yields a total uncertainty of
0.64 GeV/c2 that represents an improvement of 26%. Compared to the world average, the
central value of this combination is 1.00 GeV/c2 higher and its precision is 16% better.
The mass of the top quark is now known with a relative precision of 0.37%, limited by the systematic uncertainties, which are dominated by the uncertainty on in situ calibration and signal modeling. This result will be further improved when all analysis channels from CDF and DØ using the full Run II data are optimized in their treatment of their systematic uncertainties.
7
Acknowledgments
We thank the Fermilab staff and the technical staffs of the participating institutions for their vital contributions. This work was supported by DOE and NSF (USA), CONICET and UBA-CyT (Argentina), CNPq, FAPERJ, FAPESP and FUNDUNESP (Brazil), CRC Program, CFI, NSERC and WestGrid Project (Canada), CAS and CNSF (China), Colciencias (Colombia), MSMT and GACR (Czech Republic), Academy of Finland (Finland), CEA and CNRS/IN2P3 (France), BMBF and DFG (Germany), Ministry of Education, Culture, Sports, Science and Technology (Japan), World Class University Program, National Research Foundation (Korea), KRF and KOSEF (Korea), DAE and DST (India), SFI (Ireland), INFN (Italy), CONACyT (Mexico), NSC(Republic of China), FASI, Rosatom and RFBR (Russia), Slovak R&D Agency (Slovakia), Ministerio de Ciencia e Innovaci´on, and Programa Consolider-Ingenio 2010 (Spain), The Swedish Research Council (Sweden), Swiss National Science Foundation (Switzerland), FOM (The Netherlands), STFC and the Royal Society (UK), and the A.P. Sloan Foundation (USA).
)
2(GeV/c
tM
168 169 170 171 172 173 174 175 176 177 178 179
0
7.3
CDF March'07
12.40 ±2.66 (±1.50 ± 2.20)Tevatron
combination *
0.64 ± 174.34 (±0.37 ± 0.52) syst) ± stat ± (MET+Jets
174.19 ±1.77 (±1.29 ± 1.21)Alljets *
175.63 ±1.85 (±1.23 ± 1.39)Dilepton *
171.95 ±1.97 (±1.61 ± 1.14)Lepton+jets
174.17 ±0.66 (±0.38 ± 0.54)Mass of the Top Quark in Different Decay Channels
(* preliminary)
July 2014
Figure 4: Summary of the combination of the twelve top-quark measurements by CDF and DØ for different final states. The red lines correspond to the statistical uncertainty while the blue lines show the total uncertainty.
References
[1] The CDF Collaboration, the DØ Collaboration and the Tevatron Electroweak Working Group, arXiv:1305.3929.
[2] T. Aaltonen et al. [CDF and DØ Collaborations], Phys. Rev. D 86, 092003 (2012). [3] The ATLAS, CDF, CMS and DØ Collaborations, arXiv:1403.4427.
[4] F. Abe et al. [CDF Collaboration], Phys. Rev. Lett. 80, 2779 (1998).
[5] F. Abe et al. [CDF Collaboration], Phys. Rev. Lett. 82, 271 (1999). hep-ex/9810029. [6] F. Abe et al. [CDF Collaboration], Erratum: Phys. Rev. Lett. 82 (1999) 2808.
[7] B. Abbott et al. [DØ Collaboration], Phys. Rev. Lett. 80, 2063 (1998). hep-ex/9706014. [8] B. Abbott et al. [DØ Collaboration], Phys. Rev. D60, 052001 (1999).
[9] F. Abe et al. [CDF Collaboration], Phys. Rev. Lett. 80, 2767 (1998). [10] T. Affolder et al. [CDF Collaboration], Phys. Rev. D63.
[11] S. Abachi et al. [DØ Collaboration], Phys. Rev. Lett. 79, 1197 (1997). [12] B. Abbott et al. [DØ Collaboration], Phys. Rev. D58, 052001 (1998). [13] V. M. Abazov et al. [DØ Collaboration], Nature 429, 638 (2004). [14] F. Abe et al. [CDF Collaboration], Phys. Rev. Lett. 79, 1992 (1997). [15] V. M. Abazov et al. [DØ Collaboration], Phys. Lett. B606, 25 (2005). [16] T. Aaltonen et al. [CDF Collaboration], Phys. Rev. D88, 011101 (2013). [17] T. Aaltonen et al. [CDF Collaboration], Phys. Rev. Lett. 109, 152003 (2012). [18] T. Aaltonen et al. [CDF Collaboration], CDF Conference Note 11072.
[19] T. Aaltonen et al. [CDF Collaboration], CDF Conference Note 11084.
[20] V. M. Abazov et al. [DØ Collaboration], arXiv:1405.1756, accepted by Phys. Rev. Lett. [21] V. M. Abazov et al. [DØ Collaboration], Phys. Rev. D 86, 051103 (2012).
[22] T. Aaltonen et al. [CDF Collaboration], Phys. Rev. D 81, 032002 (2010).
[23] The CDF Collaboration, the DØ Collaboration and the Tevatron Electroweak Working Group, arXiv:1107.5255.
[24] T. Aaltonen et al. [CDF Collaboration], Phys. Rev. Lett. 107, 232002 (2011).
[25] The CDF Collaboration, the DØ Collaboration, and the Tevatron Electroweak Working Group, hep-ex/0404010.
[26] The CDF Collaboration, the DØ Collaboration, and the Tevatron Electroweak Working Group, hep-ex/0507091.
[27] The CDF Collaboration, the DØ Collaboration, and the Tevatron Electroweak Working Group, hep-ex/0603039.
[28] The CDF Collaboration, the DØ Collaboration, and the Tevatron Electroweak Working Group, hep-ex/0608032.
[29] The CDF Collaboration, the DØ Collaboration, and the Tevatron Electroweak Working Group, hep-ex/0703034.
[30] The CDF Collaboration, the DØ Collaboration, and the Tevatron Electroweak Working Group, arXiv:0803.1683.
[31] The CDF Collaboration, the DØ Collaboration, and the Tevatron Electroweak Working Group, arXiv:0808.1089.
[32] The CDF Collaboration, the DØ Collaboration and the Tevatron Electroweak Working Group, arXiv:0903.2503.
[33] The CDF Collaboration, the DØ Collaboration and the Tevatron Electroweak Working Group, arXiv:1007.3178.
[34] V. M. Abazov et al. [D0 Collaboration], Phys. Rev. D 74, 092005 (2006).
[35] A. Buckley, J. Butterworth, S. Gieseke, D. Grellscheid, S. Hoche, H. Hoeth, F. Krauss and L. Lonnblad et al., Phys. Rept. 504, 145 (2011).
[36] S. Frixione, P. Nason and G. Ridolfi, JHEP 0709, 126 (2007). [37] S. Frixione and B. Webber, JHEP 029, 0206 (2002).
[38] M. L. Mangano, M. Moretti, F. Piccinini, R. Pittau, and A. D. Polosa, JHEP 07, 001 (2003)
[39] G. Marchesini et al., Comput. Phys. Commun. 67, 465 (1992). [40] G. Corcella et al., JHEP 01, 010 (2001).
[41] P. Z. Skands and D. Wicke, Eur. Phys. J. C 52, 133 (2007). [42] P. Z. Skands, arXiv:0905.3418.
[43] H.-U. Bengtsson and T. Sjostrand, Comput. Phys. Commun. 46, 43 (1987). [44] T. Sjostrand, Comput. Phys. Commun. 82, 74 (1994).
[45] T. Sjostrand et al., Comput. Phys. Commun. 135, 238 (2001).
[46] F. E. Paige and S. D. Protopopescu, BNL Reports 38034 and 38774 (1986), unpublished. [47] L. Lyons, D. Gibaut, and P. Clifford, Nucl. Instrum. Meth. A270, 110 (1988).