HAL Id: hal-02546591
https://hal.umontpellier.fr/hal-02546591
Submitted on 18 Apr 2020
HAL is a multi-disciplinary open access archive for the deposit and dissemination of sci-entific research documents, whether they are pub-lished or not. The documents may come from teaching and research institutions in France or abroad, or from public or private research centers.
L’archive ouverte pluridisciplinaire HAL, est destinée au dépôt et à la diffusion de documents scientifiques de niveau recherche, publiés ou non, émanant des établissements d’enseignement et de recherche français ou étrangers, des laboratoires publics ou privés.
Ventilatory Parameters and Maximal Respiratory
Pressure Changes With Age in Duchenne Muscular
Dystrophy Patients
Jérome Gayraud, Michèle Ramonatxo, Francois Rivier, Véronique
Humberclaude, Basil Petrof, Stefan Matecki
To cite this version:
Jérome Gayraud, Michèle Ramonatxo, Francois Rivier, Véronique Humberclaude, Basil Petrof, et al.. Ventilatory Parameters and Maximal Respiratory Pressure Changes With Age in Duchenne Muscular Dystrophy Patients. Pediatric Pulmonology, Wiley, 2010, 45 (6), pp.552-559. �10.1002/ppul.21204�. �hal-02546591�
Ventilatory Parameters and Maximal Respiratory
Pressure Changes With Age in Duchenne Muscular
Dystrophy Patients
Jerome Gayraud,MD,1,2Michele Ramonatxo,PhD,1,2,3Franc¸ois Rivier,MD,PhD,1,2,4
Ve´ronique Humberclaude,MD,2,5,6Basil Petrof,MD,7and Stefan Matecki,MD,PhD1,2,3* Summary. The aim of this longitudinal study was to precise, in children with Duchenne muscular
dystrophy, the respective functional interest of ventilatory parameters (Vital capacity, total lung capacity and forced expiratory volume in one second [FEV1]) in comparison to maximal inspiratory
pressure (Pimax) during growth. In ten boys the mean age of 9.1 ! 1 years) to mean age of 16 ! 1.4 years followed over a period of 7 years, we found that: (1) ventilatory parameters expressed in percentage of predicted value, after a normal ascending phase, start to decrease between 11 and 12 years, (2) Pimax presented only a decreasing phase since the beginning of the study and thus was already at 67% of predicted value at 12 years while ventilatory parameters was still normal, (3) after 12 years the mean slopes of decrease per year of vital capacity and FEV1 were higher (10.7 and 10.4%) than that of Pimax (6.9%), (4) at 15 years mean values of vital capacity and FEV1 (53.3 and 49.5% of predicted values) was simlar to that of Pimax (48.3%). In conclusion, if at early stages of the disease, Pimax is a more reliable index of respiratory impaiment than ventilatory parameters, the follow-up of ventilatory parameters, when they start to decrease, is a better indicator of disease progression and, at advanced stages they provided same information about the functional impact of disease. Pediatr Pulmonol. 2010; 45:552–559. ! 2010 Wiley-Liss, Inc.
Key words: Duchenne muscular dystrophy; maximal inspiratory pressure; pulmonary function; longitudinal study.
INTRODUCTION
Duchenne muscular dystrophy (DMD), an X-linked recessive disorder caused by absence or severely reduced expression of dystrophin,1is characterized by progressive degeneration of skeletal muscles, including the respiratory
muscles.2Unfortunately, despite advances in respiratory
support, death generally occurs at 25–30 years of age, due
to respiratory failure in more than 80% of cases.3Many
studies have evaluated respiratory function in patients with DMD and described a pattern of restrictive
ventilatory impairment.2,4 –8 More specifically,
pulmo-nary volumes show a characteristic pattern consisting of an initial ascending phase associated with age-related growth, followed by a plateau and finally a descending
phase.5,6 Since a correlation has been found between
pulmonary volumes and DMD disease stages,4the
follow-up of respiratory function is important for prognosis. Indeed, the extent of the plateau phase and the rate of the declining phase of vital capacity correlates with the risk of respiratory failure as well as life expectancy.2,5,6,9 More-over, the fall of vital capacity to a value below one liter points to an elevated likelihood of death within the following 3 years if mechanical ventilatory support is not provided.9Nevertheless, spirometry does not seem to be a sensitive indicator of respiratory muscle weakness during
Jerome Gayraud and Michele Ramonatxo contributed equally to this work.
1Inserm, ERI25, Montpellier F-34295, France.
2University Montpellier1, UFR Medicine, EA 4202, Montpellier F-34295,
France.
3CHU Montpellier, Hoˆpital A de Villeneuve, Service de Physiologie
Clinique, Montpellier F-34295, France.
4CHU Montpellier, Hoˆpital Saint-Eloi, Service de Neurope´diatrie,
Montpellier, France.
5
Inserm, U827, Montpellier, France.
6
Laboratory of Molecular Genetic, Hoˆpital A de Villeneuve, Montpellier, France.
7
Meakins-Christie Laboratories, McGill University, Montreal, QC, Canada.
*Correspondence to: Stefan Matecki, MD, PhD, CHU Montpellier, Hoˆpital A de Villeneuve, Service de Physiologie Clinique, Montpellier F-34295, France. E-mail: s-matecki@chu-montpellier.fr
Received 15 July 2009; Revised 4 December 2009; Accepted 10 December 2009.
DOI 10.1002/ppul.21204
Published online 6 May 2010 in Wiley InterScience (www.interscience.wiley.com).
earlier stages of the disease. In this regard, vital capacity usually remains normal or near-normal until there is a major decline (to about 50% predicted) in respiratory muscle strength.10
Since skeletal muscle weakness is the main physio-logical consequence of dystrophin defects in DMD, respiratory muscle function has been proposed as a potential index of disease progression. Although not sensitive to early changes as noted above, the decrease of vital capacity over time in DMD patients correlates with reductions in maximal inspiratory pressure (Pimax), which in turn reflect inspiratory muscle strength.11Indeed, respiratory muscle weakness is the first sign of dysfunc-tion of the respiratory system at early stages of the disease,11,12and hypercapnia will not appear until Pimax
is less than 30% of the normal predicted value.13 In
addition, with age, respiratory muscle weakness is often associated with superimposed alterations of respiratory
system mechanical properties in DMD children.13 The
variability and the difficulties of performing Pimax measurements caused by the cognitive impairment which
is often present in DMD children,14may also alter the
usefulness of respiratory muscle function as a parameter for following disease progression.
Accordingly, the primary aim of this longitudinal study was to perform a systematic comparison of commonly used ventilatory parameters and Pimax during the long-term follow-up of DMD children, in order to delong-termine which is most reflective of disease progression with increasing age. To achieve this goal, we followed 10 DMD boys for an average period of 7 years, spanning mean ages of 9! 1 years until 16.0 ! 1.4 years old.
PATIENTS AND METHODS Patients
Ten male children and adolescents with DMD from a
mean age of 9! 1 years to a mean age of 16.0 ! 1.4 years
(followed on average over a period of 7 years) participated in this longitudinal study. They belonged to a group of patients with neuromuscular diseases followed at the Department of Neuropediatrics of the St. Eloi University Hospital Center in Montpellier and the Saint-Pierre Institute in Palavas, France, and were referred to our pulmonary function laboratory for routine respiratory evaluation.
Inclusion criteria were: (1) confirmed diagnosis of DMD clinically and by muscle biopsy (demonstration of absence of dystrophin expression, except for occasional muscle fibers, by immunohistochemistry), (2) absence of any requirement for assisted ventilation, (3) clinical stability without any symptoms or signs of inspiratory muscle insufficiency, such as orthopnea, paradoxical breathing or hypercapnia, (4) absence of major learning disabilities and ability to perform the maneuvers recom-mended by the American Thoracic Society/European
Respiratory Society for lung volume measurements,15and
(5) available measurements of ventilatory parameters and Pimax for a period of at least 5 years. Exclusion criteria were: (1) presence of respiratory tract infection or history of acute respiratory failure requiring endotracheal ven-tilation and (2) presence of medications that could
influence respiratory function16 during the time of the
study, including the use of corticosteroids. Four patients had independent ambulation at the first evaluation, but none of the subjects could walk after the age of 12. Among the 10 patients, one received spinal arthrodesis at 12 years of age, and two received this intervention at 16 years of age near the end of their study evaluations. Since a
recently validated scale for motor function assessment17
was not yet available at the beginning of this study, we evaluated daytime activities according to a score which was routinely used by our clinical service. This score contains three main items: (a) ability to stand up and transfer weights with and without support (score ranges from 0 to 45), (b) capacity to get dressed (score ranges from 0 to 45), and (c) capacity to eat (score ranges from 0 to 30). The total score ranges from 0 to 120. We also evaluated their intellectual quotient (IQ) with the Wechler’s scale (N.PPSI, WISC.R, WISC III) according to the age and period of investigation, as well as their verbal and performance intellectual quotients (V.IQ and P.IQ).
Physiological Measurements Handgrip Strength
To measure handgrip strength, trials of maximal voluntary isometric contraction of one hand were per-formed with a Saefran dynamometer (MAFEZ, 630-728, Korea) until we obtained three reproducible measure-ments. Unfortunately, the longitudinal follow-up of this measure was not possible for all children; therefore, we only report the values obtained at the age of 13 years (Table 1), which also represents the mean age at which peak values obtained for the vital capacity and forced expiratory volume in 1 sec (FEV1).
Ventilatory Parameters
As part of their routine clinical care, eight patients were evaluated at least twice per year and two only once, from
November 1993 to January 2005. The FEV1 and vital
capacity were determined by spirometry (Pulmonet III; sensor Medics, Anaheim, CA) according to standard techniques and procedures, while the children were seated in their own wheelchairs. We assessed the functional residual capacity using the helium dilution technique. We expressed vital capacity, total lung capacity and FEV1in
absolute values as well as percentages of predicted values according to Zapletal et al.18For this, the height of each
Pediatric Pulmonology Duchenne Muscular Dystrophy Patients 553
child was evaluated in a lying position with a rope and measured on a scale.
Maximal Inspiratory Pressure (Pimax)
The same pediatrician supervised all Pimax measure-ments during the patients’ follow-up as previously done in
our laboratory.19,20 Children breathed through a plastic
cylinder connected to a mouthpiece. Pimax was measured at the functional residual capacity with a Validyne MP45
transducer (!300 cmH2O) and a CD 15 carrier
demodu-lator using the technique described by Black and Hyatt.10
The method has been described in a previous study.20To
prevent generation of pressure in the buccal cavity by the cheeks against a closed glottis, a small air leak was created by a needle (28 mm length, 1.2 mm internal diameter). In order to motivate the subjects to produce a maximal inspiratory effort, we allowed them to observe the values of their inspiratory pressure measurements on a screen during the test. After each measurement, the pediatrician traced a horizontal line on the screen and encouraged the child to exceed his last value. We retained only plateau pressure values that could be sustained for more than 1 sec. The examiner carried out at least five measurements to obtain three reproducible values (i.e., variation in maximal
inspiratory pressure <10%). We selected the Pimax
highest value, expressed for each subject in absolute terms and as a percentage of predicted at the same lung volume.
Protocol
First, we assessed the ventilatory parameters (i.e., functional residual capacity, total lung capacity, vital capacity and FEV1) at rest, while the child was sitting on
his own wheelchair in a calm and relaxed condition. Then, we connected the child to the previously described respiratory apparatus to measure Pimax. During the measurements, we took great care to ensure that each child sat on his chair in the same position with relaxed shoulders.
Statistical Analysis
We expressed all values as means! standard error of
the mean (SEM). We used linear regression equations to analyze the decrease of the ventilatory parameters with age as well as Pearson’s correlation coefficient. We assessed the differences between ventilatory parameters and Pimax values using Student’s t-test when the normal-ity distribution (Kolomogorov–Smirnov test) and equal-ity of variance (Levine median test) were verified. The level of significance was set at P< 0.05.
RESULTS Patients
Table 1 shows the known mutations, daytime activity scores and dominant handgrip strength values at the age of 12–13 years. We described the mutations according to the coding DNA reference sequence of the Dp427m iso-form (Genbank file NM_004006.1) and to the most recent recommendations of the Human Genome Variation Society. At this age, and similarly to a previous study,16 we found a significant correlation between dominant
handgrip strength and daytime activity score
(Y¼ 0.17X # 2.62, r ¼ 0.88, P < 0.01), but not between daytime activity score and ventilatory parameters or maximal inspiratory pressure. We also did not find any correlation between handgrip strength and ventilatory parameters or maximal inspiratory pressure. Indeed, all children were wheelchair-bound at this age and thus presented a low level of ventilatory demand, such that respiratory muscle function did not appear to be a limiting factor for their usual daytime activities.
Table 2 presents the relevant clinical and functional information for individual patients such as the age at which subjects stopped walking, the age of first recording, the duration of follow-up, baseline height and weight data, and baseline ventilatory parameters. In this study, we assessed ventilatory parameters and maximal inspiratory pressure over an average follow-up period of TABLE 1— Known Mutations, Score of Daytime Activity, and Dominant Handgrip Value for
All Children at the Age of 12–13 Years
Patient number Known mutations localization
Score of daytime activity Dominant handgrip (kg force) 1 c.10086þ 1G>(IVS69 þ 1G > T) 65/120 3.5 2 c.32_93þ dup (ex2dup) 50/120 3.0 3 c.9568>T(p.Arg31190X) 17/120 1.5 4 c.32-?_dup(exdup) 36/120 5.7 5 Stand-by 69/120 13.0 6 c.7310-?7542þ ?del(ex51del) 86/120 11.0 7 c.7201-?_7309þ del(ex50del) 32/120 3.8 8 c.8548-?_9224þ ?dup(ex58ex62dup) 34/120 2.0 9 Stand-by 27/120 2.0 10 c.2169?_2803þ ?del(ex18ex21del) 21/120 0.1
7 years, and the average number of tests per patient was
9! 1. The mean age of the first measurement of
ventilatory parameters and maximal inspiratory
pressure was 9! 1 years and 16.0 ! 1.4 years for the last test. Children stopped walking at an average age of
9.7! 1 years old. The mean values of IQ, V.IQ and P.IQ
were 66! 12, 71 ! 10 and 79 ! 17, respectively.
Changes in Respiratory Function With Age
The timing of our measurements was not uniformly spaced and the patients were not all referred at the same age. Consequently, to study the average changes of all these parameters with age, we carried out a longitudinal analysis of the variations in lung function against time for each individual by linear regression analysis. From these individual slopes, we then calculated the mean
val-ues! SEM for each parameter.
Ventilatory Parameters
The absolute values of vital capacity, total lung capacity
and FEV1showed an ascending phase that stopped at a
different age for each subject. The mean values of vital
capacity, total lung capacity and FEV1reached a peak at
13.0! 0.5 years, 14.6 ! 0.4 years and 13.0 ! 0.7 years,
respectively. However, when we expressed these param-eters as percentages of the predicted value, peak values were attained earlier, at 11.5! 0.7 years, 11.0 ! 0.9 years,
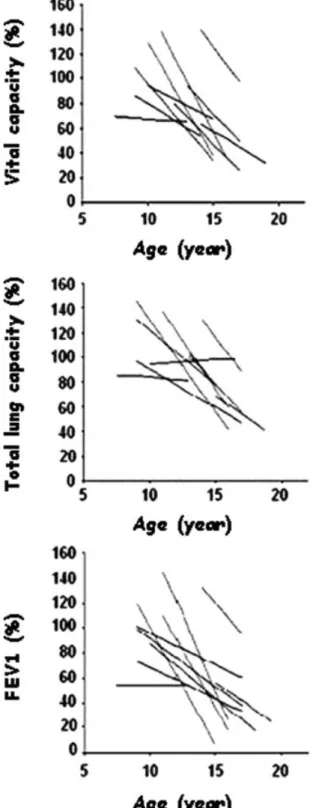
and 11.6! 0.8 years (Table 3). After the peak, the
ventilatory parameters started to decline with age
(Fig. 1) and showed a mean decrease of 10.7! 6.0%
per year (vital capacity), 9.2! 6.0% per year (total lung capacity) and 10.4! 6.0% per year (FEV1). Thus, after the
peak, at around 12 years of age, the mean values of vital capacity, total lung capacity and FEV1were, respectively,
85.2! 6.6, 101.2 ! 5.5, and 78.2 ! 7.4% predicted. There
was then a rapid decline to reach mean values of
53.3! 4.4, 74.2 ! 4.1, and 49.5 ! 5.1% predicted by
15 years of age.
Inspiratory Muscle Strength (Pimax)
We could not determine the age at which the maximal inspiratory pressure peaked because after the first measurement and, differently from what was observed for the ventilatory parameters, the absolute values of maximal inspiratory pressure did not increase, but rather decreased, in eight children (Fig. 2). However, the absolute value of maximal inspiratory pressure declined only slightly with age and the mean rate for its
decrease was 3.4! 0.5 cmH2O per year. When we
expressed the maximal inspiratory pressure as %
pre-dicted, the mean rate of decrease amounted to 6.9! 1.3%
per year. This rate of decrease was significantly lower than what was observed for vital capacity and
FEV1 (P< 0.01). Thus, while at 12 years of age the
mean maximal inspiratory pressure was 67.5! 2.6%
predicted, it decreased to 48.3! 3.6% predicted by the
age of 15.
Pediatric Pulmonology
TABLE 2— Individual Relevant Clinical and Functional Information: Age Subject Stopped Walking, Age of the Firs Recording, Duration of Follow-Up, Baseline Height, Weight and Body Mass Index, Baseline Value of Forced Vital Capacity (FVC), Forced Expiratory Volume in 1 sec (FEV1) and Total Lung Capacity (TLC)
Patient number Stopped walking (years) Firs recording (years) Follow-up (years) Baseline height (cm) Baseline weight (kg) Body mass index FVC (L) FEV1 (L) TLC (L) 1 12 7 6 126 24 15 1.13 0.76 1.95 2 9 11 7 143 45 22 2.23 1.96 2.82 3 9 10 7 135 43 24 1.48 1.10 2.83 4 9 9 7 133 37 21 1.88 1.82 2.14 5 10 8.5 8 125 23 15 1.63 1.40 2.28 6 11 10 5 133 26 15 1.71 1.70 2.84 7 9 9 7 126 21 13 1.87 1.70 2.46 8 9 9 8 137 30 16 1.77 1.17 2.18 9 10 8 8 118 20 14 1.20 0.96 2.30 10 9 9 6 117 18 13 1.64 1.40 2.40 Mean 9.7 9 6.9 129 29 17 1.65 1.39 2.42 SEM 0.8 0.8 0.7 7 8 3 0.23 0.31 0.25
Results are given as mean! standard error (SEM).
TABLE 3— Age When DMD Children Presented a Peak Value of Respiratory Parameters, Expressed in Liter or Expressed in % of Predicted Value
Age (year) Respiratory parameters expressed in liter
Maximal vital capacity 13.0! 0.5
Maximal total lung capacity 14.6! 0.4
Maximal FEV1 13.0! 0.7
Respiratory parameters expressed in % of predicted value
Maximal vital capacity 11.5! 0.7
Maximal total lung capacity 11.0! 0.9
Maximal FEV1 11.5! 0.8
Results are given as mean! standard error (SEM). FEV1, forced
expired volume in 1 sec.
Correlation Between Ventilatory Parameters and Maximal Inspiratory Pressure
We found a significant positive linear relationship (P< 0.05) between the individual rates of decrease of vital
capacity or FEV1 and those of maximal inspiratory
pressure [Vital capacity slope (%)¼ 1.02 % maximal
inspiratory pressure slope (%)þ 4.48; FEV1 slope
(%)¼ 1.21 % maximal inspiratory pressure slope (%) þ
3.69] (Fig. 3).
We then looked for possible relationships between individual values (expressed as % predicted) of maximal inspiratory pressure and respectively, vital capacity, total
lung capacity and FEV1during the 7 years of follow-up
(Fig. 4). The mean slopes and intercepts between vital
capacity and Pimax were respectively 1.25! 0.15 and
4.1! 0.15%, whereas the corresponding values between
FEV1and Pimax were 1.3! 0.5 and #5.39 ! 0.43%, and
Fig. 1. Vital capacity vital, total lung capacity and forced expiratory volume in 1 sec expressed as % of the predicted value in relation to age (years). Each line represents, for each patient, the significant linear relationship between a given ventilatory parameter and age, starting from the peak value until the last measurement.
Fig. 2. Maximal inspiratory pressure (Pimax), expressed in absolute values (cmH2O) (A) and as % of the predicted value
(B) in relation to age (years). Each line represents the significant linear relationship in a given patient between maximal inspir-atory pressure and age starting from the peak or the initial values until the last measure.
between total lung capacity and Pimax were 0.92! 0.26
and 39.75! 0.26%. We thus could observe that, as disease
progressed, the discordances between the values of vital
capacity and FEV1versus maximal inspiratory pressure
decreased, whereas those between total lung capacity and maximal inspiratory pressure persisted.
DISCUSSION
In this article, we present the first longitudinal, comparative follow-up study of the change in ventilatory parameters and maximal inspiratory pressure in DMD children during growth. This study has some limitations that must be considered. We have used in this study vital
capacity, FEV1, and maximal inspiratory pressure, which
are all volitional and indirect methods for the assessment of respiratory muscle function. Furthermore, measure-ments of maximal inspiratory pressures are not easy to perform, particularly in young patients with DMD.
Alternative methods include sniff nasal inspiratory
pressure (SNIP)21 or inspiratory flow reserve
measure-ments.22Interestingly, it has recently been reported that in
DMD patients, Pimax may be more reliable than SNIP.21
While at the beginning of our study the use of SNIP was not generally accepted and we had a high level of
experience with the use of Pimax,19,20,23,24 in the last
period of our investigation we also performed SNIP measurements in some patients and obtained similar
Pediatric Pulmonology
Fig. 3. Relationship between each patient’s rate of decrease per year of vital capacity (A) or FEV1(B), and that of maximal
inspiratory pressure. (VC slope ¼ 1.02 % maximal inspiratory pressure slope þ 4.48; P < 0.05, r ¼ 0.66 and FEV1 slope ¼
1.21 % maximal inspiratory pressure slope þ 3.69). All parame-ters are expressed as % of the predicted value. Each patient is represented by a single dot.
Fig. 4. Vital capacity, total lung capacity, and forced expiratory volume in 1 sec expressed as % of the predicted value in relation to maximal inspiratory pressure (Pimax) expressed as % of the predicted value. Each line represents the significant linear relationship for a single patient between ventilatory parameters and maximal inspiratory pressure from the peak value until the last measure.
results to those reported for Pimax. Finally, the number of patients in our study was relatively low, and the measure-ment intervals were not uniform. Therefore, the patients were not all evaluated at the same age, since in the clinical follow-up setting it was difficult to impose the same pattern of evaluation in all DMD children.
As in previous cross-sectional studies,5,6,11 we found
that vital capacity, total lung capacity and FEV1, when
expressed in absolute values, showed a characteristic pattern with ascending, plateau, and then descending phases. We found, similarly to other authors,2,6,11that the peak values of vital capacity, total lung capacity and FEV1
expressed as % of the predicted values occurred between 11 and 12 years of age, that is to say 2–3 years earlier than the peak expressed in absolute terms. During this interval, although the ventilatory parameters still appeared to increase when expressed as absolute values, in reality they were already decreasing. Hence growth no longer compensates for the reduction in lung volume caused by the deterioration of muscular function. Therefore, we suggest that respiratory parameters should be expressed as % of predicted value since this better describes the relationships between growth compensation and respira-tory function decline.
After reaching their peak values, vital capacity and total lung capacity decreased at a linear rate with age, leading to the appearance of a progressive restrictive ventilatory pattern. We found that the mean percentage decrease of vital capacity (10.7% per year) was slightly higher than
that generally reported in previous studies.2,8,11 This
difference could be due to the greater variability of the decline rate among our patients. We also observed that the
reduction in FEV1correlated with the decrease in lung
volume, as previously shown by others,8,25with a mean
decrease of 10.4% per year.
Our results show that the recording of changes in maximal inspiratory pressure over time is useful to appreciate the loss of respiratory muscle strength in young DMD patients as well as for the sequential follow-up of their respiratory function.11,26,27 While the ventilatory parameters increased until the age of 13–14 years (when expressed in absolute values), maximal inspiratory pressure started to decline slightly from the age of 10 years onwards. This result could be explained by the fact that the maximum static pressure decreases early in the course of
the disease, between 5 and 10 years of age.2,28When we
expressed maximal inspiratory pressure as % of predicted value, we found a decrease of maximal inspiratory pressure of 6.9% per year, which is slightly higher than that observed by Hahn et al.11(5.9% per year).
We then compared the changes in ventilatory param-eters and maximal inspiratory pressure at different ages during disease progression. As observed by previous authors, at early stages of DMD, the vital capacity, total
lung capacity and FEV1were all within normal limits and
significantly higher than maximal inspiratory pressure (all expressed as % of predicted value). The shape of the typical relaxed pressure-volume curve of the respiratory system may explain the preservation of the pulmonary volume despite the decreased inspiratory muscle strength. Indeed, the relationship between maximal inspiratory pressure and lung volume at an early stage of the disease is more hyperbolic than linear, with small variations of lung volume for a large decrease of maximal inspiratory pressure.
As the disease progressed, we found a positive correlation between the individual rates of decrease of
vital capacity and FEV1and those of maximal inspiratory
pressure. This result mainly reflects the impact of diaphragmatic dysfunction on the ventilatory parameters. However, the decrease of maximal inspiratory pressure
was slower than that of vital capacity and FEV1. This
result is in accordance with previous studies reported by
De Troyer et al.29 and Estenne et al.30 These authors
showed that other factors (e.g., alterations of the elastic properties of elastin and collagen fibers, decreases in surfactant activity,31ankylosis of the costosternal joints, scoliosis, fibrosis of the rib cage muscles, microate-lectasis28) could contribute to the decrease of ventilatory parameters by causing a reduction in respiratory system compliance. .Thus, as the disease progresses, vital
capacity and FEV1 are likely to be better indicators of
global respiratory system involvement than maximal
inspiratory pressure. Moreover, FEV1 (as % of the
predicted value) seems to be the ventilatory parameter that best reflects muscular dysfunction as it showed the highest correlation with maximal inspiratory pressure. This result is in accordance with previous studies which
reported a correlation between FEV1 and maximal
expiratory effort32 or between FEV1 and the muscular
function score of the upper limbs.8 Conversely, the
differences between total lung capacity and maximal inspiratory pressure persisted over time (Fig. 4), indicat-ing that total lung capacity is a poor indicator of disease progression. This result is in agreement with those by Rideau et al.6and Inkley et al.4who found that while vital capacity decreases, residual volume increases due to inability of expiratory muscles to maximally empty the lungs.
At the age of 15 years on average, vital capacity, FEV1,
and maximal inspiratory pressure (expressed as % of predicted value) were comparable and, therefore, pro-vided the same information about the functional impact of the disease on the respiratory system. This result could be useful for the clinicians who need to follow-up the respiratory function in DMD patients at later stages of the disease. Indeed, at advanced stages, vital capacity or FEV1
are often easier to measure than maximal inspiratory pressure, particularly since cognitive impairment is often present at that point.14
In conclusion, this longitudinal study, which follows the changes in ventilatory parameters and maximal inspir-atory pressure in a group of DMD patients, shows that when ventilatory parameters expressed as percentages of their predicted values start to decrease, the slopes of the declines in vital capacity and FEV1are better indicators of
respiratory system disease progression than maximal inspiratory pressure. However, as Pimax is the more specific index of inspiratory muscle performance and affected earlier, both forms of assessment are comple-mentary and may be useful for separating changes caused by inspiratory muscle weakness versus other phenomena.
REFERENCES
1. Hoffman EP, Brown RH, Jr., Kunkel LM. Dystrophin: the protein product of the Duchenne muscular dystrophy locus. Cell 1987; 51:919–928.
2. McDonald CM, Abresch RT, Carter GT, Fowler WM, Jr., Johnson ER, Kilmer DD, Sigford BJ. Profiles of neuromuscular diseases. Duchenne muscular dystrophy. Am J Phys Med Rehabil 1995; 74:S70–S92.
3. Nagai T. Prognostic evaluation of congestive heart failure in patients with Duchenne muscular dystrophy–retrospective study using non-invasive cardiac function tests. Jpn Circ J 1989;53: 406–415.
4. Inkley SR, Oldenburg FC, Vignos PJ, Jr. Pulmonary function in Duchenne muscular dystrophy related to stage of disease. Am J Med 1974;56:297–306.
5. Rideau Y. Prognosis of progressive muscular dystrophy in children. Analysis of early and exact criteria. Union Med Can 1977;106:874–882.
6. Rideau Y, Jankowski LW, Grellet J. Respiratory function in the muscular dystrophies. Muscle Nerve 1981;4:155–164.
7. Hukins CA, Hillman DR. Daytime predictors of sleep hypo-ventilation in Duchenne muscular dystrophy. Am J Respir Crit Care Med 2000;161:166–170.
8. Tangsrud S, Petersen IL, Lodrup Carlsen KC, Carlsen KH. Lung function in children with Duchenne’s muscular dystrophy. Respir Med 2001;95:898–903.
9. Phillips MF, Quinlivan RC, Edwards RH, Calverley PM. Changes in spirometry over time as a prognostic marker in patients with Duchenne muscular dystrophy. Am J Respir Crit Care Med 2001; 164:2191–2194.
10. Black LF, Hyatt RE. Maximal respiratory pressures: normal values and relationship to age and sex. Am Rev Respir Dis 1969; 99:696–702.
11. Hahn A, Bach JR, Delaubier A, Renardel-Irani A, Guillou C, Rideau Y. Clinical implications of maximal respiratory pressure determinations for individuals with Duchenne muscular dys-trophy. Arch Phys Med Rehabil 1997;78:1–6.
12. Baydur A. Respiratory muscle strength and control of ventilation in patients with neuromuscular disease. Chest 1991;99:330–338. 13. Braun NM, Arora NS, Rochester DF. Respiratory muscle and pulmonary function in polymyositis and other proximal myopa-thies. Thorax 1983;38:616–623.
14. Hinton GG. Childhood psychosis or mental retardation: a diagnostic dilemma. II. Pediatric and neurological aspects. Can Med Assoc J 1963;88:1020–1024.
15. ATS/ERS Respiratory mechanics in infants: physiologic evaluation in health and disease. Am Rev Respir Dis 1993;147:474–496. 16. Daftary AS, Crisanti M, Kalra M, Wong B, Amin R. Effect of
long-term steroids on cough efficiency and respiratory muscle strength in patients with Duchenne muscular dystrophy. Pedia-trics 2007;119:e320–e324.
17. Berard C, Payan C, Hodgkinson I, Fermanian J. A motor function measure for neuromuscular diseases. Construction and validation study. Neuromuscul Disord 2005;15:463–470.
18. Zapletal A, Paul T, Samanek M. Normal values of static pulmonary volumes and ventilation in children and adolescents. Cesk Pediatr 1976;31:532–539.
19. Matecki S, Prioux J, Amsallem F, Denjean A, Ramonatxo M. Maximal respiratory pressures in children: the methodological challenge. Rev Mal Respir 2004;21:1116–1123.
20. Matecki S, Prioux J, Jaber S, Hayot M, Prefaut C, Ramonatxo M. Respiratory pressures in boys from 11–17 years old: a semilongitudinal study. Pediatr Pulmonol 2003;35:368– 374.
21. Terzi N, Orlikowski D, Fermanian C, Lejaille M, Falaize L, Louis A, Raphael JC, Fauroux B, Lofaso F. Measuring inspiratory muscle strength in neuromuscular disease: one test or two? Eur Respir J 2008;31:93–98.
22. De Bruin PF, Ueki J, Bush A, A YM, Watson A, Pride NB. Inspiratory flow reserve in boys with Duchenne muscular dystrophy. Pediatr Pulmonol 2001;31:451–457.
23. Matecki S, Topin N, Hayot M, Rivier F, Echenne B, Prefaut C, Ramonatxo M. A standardized method for the evaluation of respiratory muscle endurance in patients with Duchenne muscular dystrophy. Neuromuscul Disord 2001;11:171–177.
24. Koechlin C, Matecki S, Jaber S, Soulier N, Prefaut C, Ramonatxo M. Changes in respiratory muscle endurance during puberty. Pediatr Pulmonol 2005;40:197–204.
25. Gozal D. Pulmonary manifestations of neuromuscular disease with special reference to Duchenne muscular dystrophy and spinal muscular atrophy. Pediatr Pulmonol 2000;29:141– 150.
26. Griggs RC, Donohoe KM, Utell MJ, Goldblatt D, Moxley RT III. Evaluation of pulmonary function in neuromuscular disease. Arch Neurol 1981;38:9–12.
27. Nicot F, Hart N, Forin V, Boule M, Clement A, Polkey MI, Lofaso F, Fauroux B. Respiratory muscle testing: a valuable tool for children with neuromuscular disorders. Am J Respir Crit Care Med 2006;174:67–74.
28. Smith PE, Calverley PM, Edwards RH, Evans GA, Campbell EJ. Practical problems in the respiratory care of patients with muscular dystrophy. N Engl J Med 1987;316:1197– 1205.
29. De Troyer A, Kelly S, Macklem PT, Zin WA. Mechanics of intercostal space and actions of external and internal intercostal muscles. J Clin Invest 1985;75:850–857.
30. Estenne M, Gevenois PA, Kinnear W, Soudon P, Heilporn A, De Troyer A. Lung volume restriction in patients with chronic respiratory muscle weakness: the role of microatelectasis. Thorax 1993;48:698–701.
31. Lynn DJ, Woda RP, Mendell JR. Respiratory dysfunction in muscular dystrophy and other myopathies. Clin Chest Med 1994; 15:661–674.
32. Krowka MJ, Enright PL, Rodarte JR, Hyatt RE. Effect of effort on measurement of forced expiratory volume in one second. Am Rev Respir Dis 1987;136:829–833.
Pediatric Pulmonology Duchenne Muscular Dystrophy Patients 559