HAL Id: hal-00295185
https://hal.archives-ouvertes.fr/hal-00295185
Submitted on 27 Feb 2002
HAL is a multi-disciplinary open access
archive for the deposit and dissemination of
sci-entific research documents, whether they are
pub-lished or not. The documents may come from
teaching and research institutions in France or
abroad, or from public or private research centers.
L’archive ouverte pluridisciplinaire HAL, est
destinée au dépôt et à la diffusion de documents
scientifiques de niveau recherche, publiés ou non,
émanant des établissements d’enseignement et de
recherche français ou étrangers, des laboratoires
publics ou privés.
of mixing of nucleation mode particles
M. Väkevä, M. Kulmala, F. Stratmann, K. Hämeri
To cite this version:
M. Väkevä, M. Kulmala, F. Stratmann, K. Hämeri. Field measurements of hygroscopic properties
and state of mixing of nucleation mode particles. Atmospheric Chemistry and Physics, European
Geosciences Union, 2002, 2 (1), pp.55-66. �hal-00295185�
www.atmos-chem-phys.org/acp/2/55/
Atmospheric
Chemistry
and Physics
Field measurements of hygroscopic properties and state of mixing of
nucleation mode particles
M. Väkevä1, M. Kulmala1, F. Stratmann2, and K. Hämeri3
1University of Helsinki, Department of Physical Sciences, Helsinki, Finland 2Institute for Tropospheric Research, Leipzig, Germany
3Finnish Institute of Occupational Health, Helsinki, Finland
Received: 14 October 2001 – Published in Atmos. Chem. Phys. Discuss.: 3 December 2001 Revised: 15 February 2002 – Accepted: 19 February 2002 – Published: 27 February 2002
Abstract. An Ultrafine Tandem Differential Mobility
Anal-yser (UF-TDMA) has been used in several field campaigns over the last few years. The investigations were focused on the origin and properties of nucleation event aerosols, which are observed frequently in various environments. This paper gives a summary of the results of 10 nm and 20 nm parti-cle hygroscopic properties from different measurement sites: an urban site, an urban background site and a forest site in Finland and a coastal site in western Ireland. The data can be classified in four hygroscopic growth classes: hy-drofobic, less-hygroscopic, more-hygroscopic and sea-salt. Similar classification has been earlier presented for Aitken and accumulation mode particles. In urban air, the sum-mertime 10 nm particles showed varying less-hygroscopic growth behaviour, while winter time 10 nm and 20 nm par-ticles were externally mixed with two different hygroscopic growth modes. The forest measurements revealed diurnal be-haviour of hygroscopic growth, with high growth factors at day time and lower during night. The urban background par-ticles had growth behaviour similar to the urban and forest measurement sites depending on the origin of the observed particles. The coastal measurements were strongly affected by air mass history. Both 10 nm and 20 nm particles were hygroscopic in marine background air. The 10 nm particles produced during clean nucleation burst periods were hydro-fobic. Diurnal variation and higher growth factors of 10 nm particles were observed in air affected by other source re-gions. External mixing was occasionally observed at all the sites, but incidents with more than two growth modes were
Correspondence to: K. Hämeri
(kaarle.hameri@occuphealth.fi)
extremely rare.
1 Introduction
Tandem Differential Mobility Analyser (TDMA) instruments have been widely used for studies of hygroscopic properties of submicron aerosol particles. These measurements pro-vide valuable information on the thermodynamic properties of submicron laboratory particles. In addition, also ambi-ent aerosol particles have been characterised in various envi-ronments (e.g. McMurry and Stolzenburg, 1989; Svennings-son et al., 1992; Covert and Heintzenberg, 1993; Swietlicki et al., 1999). In the above referenced studies the focus was on particles in Aitken and accumulation modes. These are the size ranges most abundant in the measurement sites. Re-cently the presence of nucleation mode particles have been observed frequently in several locations (e.g. Mäkelä et al., 1997; O’Dowd et al., 1998; Birmili and Wiedensohler, 2000). However, the characterisation of the nucleation mode parti-cles is a difficult task because of the small mass of these par-ticles. A TDMA system provides means for chemical char-acterisation of the nucleation mode particles. Even though TDMA measurements alone will not give the exact compo-sition of the aerosol particles, but represent only a pointer to a possible composition, they give information about the aerosol physico-chemical behaviour and state of mixing. This information can be used as input for aerosol dynamic models.
This study concentrates on the measurements of hygro-scopic properties of nucleation mode particles with a TDMA. The field studies presented have a major focus on
investigat-ing the origin and properties of the freshly nucleated parti-cles. In addition, the properties of background air nucleation mode particles are investigated. When categorising nucle-ation mode particles one should keep in mind the Kelvin effect: out of two particles with identical composition, the smaller one will have a smaller growth factor. A more de-tailed description of the growth of laboratory generated nu-cleation mode aerosol particles can be found in Hämeri et al. (2000) and Hämeri et al. (2001a). It should also be noted that the deliquescence properties of the nucleation mode par-ticles are different from the larger particle sizes. For exam-ple for NaCl particles with 10 nm mobility diameter the del-iquescence relative humidity is over 80%, when for particles with diameters above 100 nm it is about 75% (Hämeri et al., 2001a; Djikaev et al., 2001). For this reason the ambient measurements should be conducted under a constant relative humidity as high as possible (in this study nominally 90%) and it should be remembered that even though the bulk mate-rial of some substance is hygroscopic, a nucleation mode par-ticle of the same composition might appear non-hygroscopic in the relative humidity studied.
In earlier work ambient submicron aerosol particles have been divided into four hygroscopic classes accordingly (e.g. Swietlicki et al., 2000): (1) Hydrofobic particles that do not grow at all when exposed to humid conditions. (2) Less hy-groscopic particles that have growth factors smaller than pure salts, but show still a clear response to increased humidity. (3) More hygroscopic particles that grow similarly to com-mon atmospheric inorganic salt (e.g. (NH4)2SO4) particles. For the nucleation mode particles this means, for example, that particles having a dry diameter of 10 nm grow up to 13– 14 nm or more at 90% relative humidity ((NH4)2SO4grows up to about 13.8 nm). (4) Sea salt particles. Growth factor of NaCl is often used as an indicator of this growth mode. For 10 nm NaCl particles (produced with an atomizer), the growth factor at 90% relative humidity is about 1.8.
It should be noted that Cocker et al. (2001) state that in urban air classification to these four classes is not enough. Their TDMA measurements of particles 50 nm and 150 nm in diameter revealed up to 6 simultaneous growth modes.
In this paper we present a summary of selected TDMA field experiments of 10 nm and 20 nm particles in mobility diameter from the years from 1997 to 1999. The ambient observations presented here are from four different places: urban, urban background, and a forest site in Finland, and a coastal site in Western Ireland. The focus of the field studies has been primarily on the atmospheric new particle forma-tion (the forest site, the coastal site and the urban background site). In addition the urban nucleation mode aerosols result-ing largely from anthropogenic pollution sources are stud-ied. The measurements at the forest site and the coastal site were conducted as parts of two EU projects (BIOFOR; PAR-FORCE) (see web sites at the end).
2 Experimental
2.1 UF-TDMA
The operation principle of an ultrafine tandem differential mobility analyzer (UF-TDMA) is similar to that of the TD-MAs used to study hygroscopic properties of larger particle sizes. A more detailed description of the operation can be found in Hämeri et al. (2000). A quasi monodisperse size fraction of dried ambient aerosol particles is selected with a DMA, these particles are then humidified to a certain de-fined relative humidity, and a second DMA with humidified sheath flow is then used to monitor the changes in particle di-ameter. The change is expressed in terms of a growth factor (GF ), i.e. the ratio of the humid diameter to the dry diame-ter selected by the first DMA. There are, however, special requirements for an instrument devoted to study ultrafine, and especially nucleation mode, aerosol particles. (a) Be-cause of the large diffusional losses of particles with diame-ters of the order of 10 nm the sampling lines and the transport through the instrument have to be short. (b) The often very low concentrations of ambient nucleation mode particles re-quire high sensitivity in measuring particle concentrations. This requirement has been considered using a modified TSI 3010 CPC (with the temperature difference between the con-denser and the saturator 25◦C). (c) The lower hygroscopic growth of the nucleation mode sized particles compared with larger particles due to Kelvin effect requires high sensitivity in determining the particle size. The diameters of both dry and humidified particles are determined using a Vienna type DMA with inner rod length of 11 cm, 1/10 aerosol to sheath flow ratio, and dense voltage steps in the second DMA (e.g. Yuskiewicz et al., 1998).
2.2 Data analysis
To analyse the TDMA measurements a data inversion pro-cedure is needed, i.e. from the concentration distribution 1N (Zp,i) measured downstream of DMA2 as a function
of DMA2 midpoint mobility Zp,i the mobility distribution
n(Zp)in front of DMA2 has to be determined.
Concentra-tions downstream of DMA2 are described by 1N (Zp,i) ≈
Z ∞ 0
n(Zp)(Zp, Zp,j)dZp, (1)
where (Zp, Zp,j)is the DMA transfer function.
Consid-ering a sufficiently large number of measured mobilities dis-cretization leads to
1N (Zp,i) ≈
X
j
n(Zp,j)(Zp,i, Zp,j)1Zp, (2)
The application of vector notation yields
1N = · n1Z¯¯ p, (3)
Consequently, the concentration distribution downstream of DMA2 is described by a set of linear equations. Solving
this set with respect to n yields the mobility distribution up-stream of DMA2. From this mobility distribution, the changes in particle mobility and consequently the growth factors can be determined.
For convenience, in this work two different techniques were used, (a) a method based on an inversion procedure featuring a numerical solution of Eq. 3 (e.g. Stratmann et al., 1997; Yuskiewicz et al., 1998), and (b) a simplified and less accurate procedure (Hämeri et al., 2001b).
The simplified procedure was used to determine the size into which particles had grown, by defining the size corre-sponding to the peak of the measurement spectra, and to get a rough estimate of the number of particles belonging to that spectrum. Then the more sophisticated algorithm was only used for a number of spectra to make sure the simple ap-proach was trustworthy within the error limits of the mea-surement system, which are approximately 5% in changes in size.
With the two approaches the calculated diameters agreed well (well within the error limits of the measurements), but the errors in the estimated concentrations were larger. Typi-cally the simple procedure gave about 10% smaller concen-trations than the other one. Thus the concenconcen-trations mea-sured with the UF-TDMA that are mentioned in this paper are mainly used as indicators of the presence of nucleation mode particles and as a rough means of comparing, e.g. rel-ative amounts of externally mixed aerosol particles.
2.3 Corrections of field data
The UF-TDMA used in the described studies has been de-veloped during the time period of the field campaigns. To be able to compare data measured during different field studies with different versions of the instrument, all data has been corrected based on calibration measurements. Ammonium sulphate particles generated with a nebulizer were used as the calibration aerosol.
It has been shown that laboratory measurements (Hämeri et al., 2000) and theoretical calculations do not give exactly the same growth factors for nucleation mode ammonium sulphate particles. Thus our field data has been corrected, (a) by first using a correction factor in order to make field (NH4)2SO4 calibrations consistent with laboratory ammo-nium sulphate measurements (the “grown" part of the growth factor is multiplied with the correction factor presented in Eq. 4, i.e. GF (corrected) = 1 + [ GF (measured)-1] * correc-tion factor), and (b) then by correcting growth factors mea-sured in other than the nominal 90% relative humidity by using fitted laboratory data.
The correction factor (a) was calculated as follows: corr = (GFlab(RH ) −1)/(GFf ield(RH ) −1), (4)
where GFf ield is the growth factor of the ammonium
sul-phate calibration in the field measurement in relative humid-ity RH , and GFlab is the growth factor of ammonium
sul-phate particles in the same relative humidity RH , but mea-sured in well defined laboratory conditions.
The second sequence of corrections was also based on lab-oratory data. Growth curves, i.e. growth factor vs. relative humidity of ammonium sulphate particles with diameters less than 30 nm have been determined in laboratory condi-tions. These growth curves, and to be more precise, their form has been used to predict the size into which the ambi-ent particles, measured in relative humidity other than 90%, would grow at 90% RH .
The correction procedure described above is based on the assumption that the ambient particles consisted of an am-monium sulphate volume together with insoluble material, which is of course is a simplification.
For this paper, only the data with DMA2 relative humidity 88–92% (except for Luukki 1997 measurements 87%–94%) have been selected. Also for counting statistical reasons all observations during which concentrations after the DMA2 were lower than 0.1 cm−3were discarded.
2.4 Measurement sites
The data presented in this work have been measured in urban, urban background, forest, and coastal environments. The data are from several separate field campaigns with focus on different scientific tasks. The urban, urban background and forest sites are located in Southern Finland, and the coastal site is located in Western Ireland.
The urban site is located in down town Helsinki. The aerosol sampling was done at the height of 20 m above sea level, and about 2 m above the ground level, with a distance of about 50 m to the closest road. The whole Helsinki down town area is surrounded by the sea and within the vicinity of the measurement site there is a bay. Air quality in Helsinki is affected mainly by traffic, energy production and the sea. The Helsinki data were measured in May 1998 and Decem-ber 1999.
The urban background site, Luukki, is situated 22 km north-west from Helsinki and about 20 km north of the coast line. In Luukki the aerosol was sampled 5 m above the ground level. The site is surrounded by forests and agricul-ture and there are no significant local anthropogenic emission sources nearby. Distance to the closest road is about 1.5 km. The concentrations of pollutants in Luukki are strongly af-fected by sources in Helsinki area. Meteorological condi-tions, especially the wind direction, radically alter the lev-els of gas and particle concentrations. Luukki is a measure-ment station used by the air quality authorities of Helsinki metropolitan area for continuous monitoring of urban back-ground pollutants. The UF-TDMA measurements were per-formed in February 1997. More details about the down-town Helsinki and Luukki sites can be found in Hämeri et al. (1996), Buzorius et al. (1999) and Väkevä et al. (2000).
The forest site, Hyytiälä, is situated 250 km north-west from Helsinki. In Hyytiälä the sampling inlet was at the
Table 1. Characteristics of the diurnal variations of growth factors of 10 nm particles measured at the urban site (Helsinki) in spring 1998.
The mean value for GF is weighted with the concentration. The standard deviation is given in parenthesis. Actual ambient concentrations are two to three orders of magnitude higher than the DMA2 concentrations
Mean GF mean min GF Mean DMA2 conc (min GF ) mean max GF mean DMA2 conc (max GF ) (cm−3) (cm−3) 1.15 (0.04) 1.03 (0.05) 2.80 1.26 (0.08) 2.80 05 06 07 08 09 10 11 12 13 14 15 16 17 18 19 20 21 1 1.1 1.2 1.3 1.4 GF@RH 90% 05 06 07 08 09 10 11 12 13 14 15 16 17 18 19 20 21 0 50 100 Fraction of conc. (%) 05 06 07 08 09 10 11 12 13 14 15 16 17 18 19 20 21 103 104 105 dN/dlogD p (cm −3 ) 10 nm, Helsinki June 1998
Fig. 1. UF-TDMA data of 10 nm particles measured in Helsinki
May 1998 (the urban site). On top the growth factors (blue) at 90% relative humidity (the second mode during external mixing is plotted with red symbol), in the middle the concentration fraction of particles in the lower growth mode when external mixing was observed, and on the bottom the concentration of 10 nm particles (dN/d log Dp, cm−3) calculated using the DMPS data.
height of 67 m above the ground level. Hyytiälä SMEAR II station (a Station for Measuring Forest Ecosystem – Atmo-sphere Relations) is equipped with continuous monitoring of aerosol particle size distributions (DMPS, 3–800 nm in mo-bility diameter) together with a number of instruments mea-suring interactions between the forest and the atmosphere. For more information about Hyytiälä measurement station and measurements performed there see e.g. Mäkelä et al. (1997); Kulmala et al. (2001). Most of the Hyytiälä data pre-sented in this paper were measured during the BIOFOR cam-paigns: April–May and August 1998, and March–April 1999 (Hämeri et al., 2001b).
The coastal measurements were done at Mace Head mea-surement station on the west coast of Ireland. The station has an excellent exposure to the North Atlantic. Most of the time clean marine background air surrounds the site. Only during winds from east or southeast, air is affected by local sources, such as bio-mass burning. For more information on the measurement site see for example O’Dowd et al. (2002).
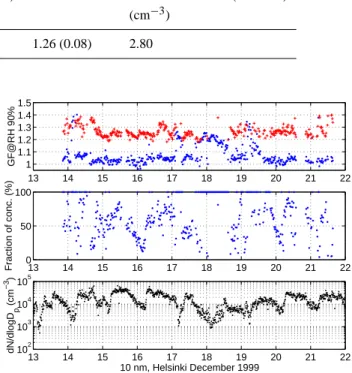
13 14 15 16 17 18 19 20 21 22 1 1.1 1.2 1.3 1.4 1.5 GF@RH 90% 13 14 15 16 17 18 19 20 21 22 0 50 100 Fraction of conc. (%) 13 14 15 16 17 18 19 20 21 22 102 103 104 105 dN/dlogD p (cm −3 ) 10 nm, Helsinki December 1999
Fig. 2. UF-TDMA data of 10 nm particles measured in Helsinki
December 1999 (the urban site). On top the growth factors (blue) at 90% relative humidity (the second mode during external mixing is plotted with red symbol), in the middle the concentration fraction of particles in the lower growth mode when external mixing was observed, and on the bottom the concentration of 10 nm particles (dN/d log Dp, cm−3) calculated using the DMPS data.
The UF-TDMA sampling was done from the height of 10 m and some tens of meters from the shoreline. These measure-ments were part of the PARFORCE campaigns in September 1998 and June 1999 (Väkevä et al., 2002).
3 Results
3.1 Characteristic features and statistical properties 3.1.1 Urban site
Data measured in Helsinki during the two weeks in May 1998 show that 10 nm particles were mostly internally mixed, with growth factors varying from about 0.95 to 1.36 (Fig. 1). The daily mean and mean of maximum and minimum val-ues are presented in Table 1. Externally mixed particles were observed in 3.5% of all observations. The observed hygro-scopic properties varied with time, but no obvious diurnal cycle was visible. Neither did air mass origin seem to affect
Table 2. Observations of different growth modes in coastal site (Mace Head) during the summer measurements and urban site (Helsinki)
during the winter 1999 measurements. The data are characterised with two modes. The presented concentrations are measured after DMA2, ambient concentrations (dN/d log Dp) are approximately two to three orders of magnitude higher. Ext. Mix = frequency of observations of externally mixed particles (fraction of all observations), Mean GFx= mean growth factor of the mode, Mean conc = mean concentration of
mean GF measured after DMA2, Of total conc = fraction of the total concentration (measured after DMA2) over the whole measurement period, Of total obs = fraction of all observations during the whole measurement period
10 nm ext. mix. mean GF1 mean DMA2 of total of all obs. mean GF2 Mean DMA2 of total of total obs.
conc. (cm−3) conc. conc. (cm−3) conc. Coastal 1998 6% 1.07 4.43 31% 25% 1.27 2.31 70% 74% Coastal 1999 3% 1.10 14.50 80% 28% 1.33 1.40 20% 73% Urban 1999 71% 1.04 1.35 47% 81% 1.26 1.35 53% 90% 20 nm ext. mix. mean GF1 mean DMA2 of total of all obs. mean GF2 Mean DMA2 of total of total obs.
conc. (cm−3) conc. conc. (cm−3) conc. Coastal 1999 8% 1.11 0.91 4% 8% 1.43 2.11 96% 92% Urban 1999 87% 1.04 1.50 52% 99% 1.27 1.50 48% 91% 13 14 15 16 17 18 19 20 21 22 1 1.1 1.2 1.3 1.4 1.5 GF@RH 90% 13 14 15 16 17 18 19 20 21 22 0 50 100 Fraction of conc. (%) 13 14 15 16 17 18 19 20 21 22 102 103 104 105 dN/dlogD p (cm −3 ) 20 nm, Helsinki December 1999
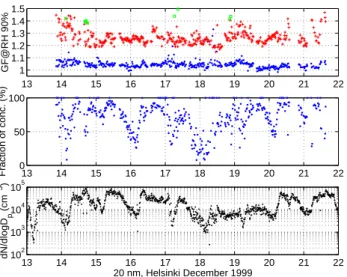
Fig. 3. UF-TDMA data of 20 nm particles measured in Helsinki
December 1999 (the urban site). On top the growth factors (blue) at 90% relative humidity (the second mode during external mixing is plotted with red symbol and the third mode with green symbol), in the middle the concentration fraction of particles in the lower growth mode when external mixing was observed, and on the bot-tom the concentration of 20 nm particles (dN/d log Dp, cm−3) cal-culated using the DMPS data.
the observed growth factors. During two or several days with similar air mass trajectories the hygroscopic behaviour of nu-cleation mode particles varied considerably, and no air mass history-specific features could be determined. For the urban site the air mass trajectories were calculated using NOAA Air Resources Laboratory’s web site (http://www.arl. noaa.gov/ss/models/hysplit.html).
Winter time measurements (December 1999) in Helsinki
showed most of the time externally mixed particles. The 10 nm particles were externally mixed with two modes of hy-groscopic growth in 71% of all observations (Fig. 2, and Ta-ble 2) and 20 nm particles in 87% of all observations (Fig. 3, and Table 2). Three 20 nm growth modes i.e. three different particle compositions were observed 2% of time. As shown in Table 2, 10 nm data during the measurement period can be described with two growth factors: mean growth factor 1.04 (std 0.03, observed 81% of time) and mean growth fac-tor 1.26 (std 0.05, observed 90% of time). The observed 20 nm growth factors can be categorised as follows: mean growth factor 1.04, std 0.02, was observed 99% of time, mean growth factor 1.27, std 0.06, was observed 91% of time.
The winter time growth factors of 10 nm particles ranged between 0.95–1.4 and growth factors of 20 nm particles var-ied between 0.97–1.5. Just as for the spring time observa-tions, the growth factors did not seem to correlate with air mass history. The systematic occurrence of two hygroscopic growth modes during winter time indicates two (or more) dif-ferent sources of particles both being similar in magnitude. 3.1.2 Forest site
In Hyytiälä, the measurements were made during three pe-riods: April–May 1998 (data for 10 and 20 nm particles), July–August 1998 (20 nm particles), March–April 1999 (data for 10 nm and 20 nm particles). Several other dry sizes were studied during the Biofor campaign but only 10 nm and 20 nm data are presented in this paper.
Spring time growth factors of all measured sizes (also larger than 20 nm, see Hämeri et al., 2001b) had a clear di-urnal cycle. In general higher growth factors were detected during day time and lower during nights. The diurnal
varia-Table 3. Characteristics of the diurnal variations of growth factors of 10 nm and 20 nm particles measured at the forest site (Hyytiälä) in
spring 1999 over a time period of Arctic air masses. During the period the new particle events took place on 4–6, 8, 10 and 12–13 April
Forest 1999 mean min GF Mean DMA2 conc mean max GF mean DMA2 conc Arctic air (3–13 April 1999) cm−3 cm−3
10 nm 1.08 0.35 1.28 2.12 20 nm 1.08 4.07 1.33 6.92 21 23 25 27 29 31 02 04 06 08 10 12 14 16 18 20 22 24 26 1 1.1 1.2 1.3 1.4 1.5 1.6 1.7 1.8 1.9 10 nm, GF@RH90% AGA AGEG G G G G GA A A A A A A A A AGEG GE E E E E E E E 21 23 25 27 29 31 02 04 06 08 10 12 14 16 18 20 22 24 26 100 102 104 dN/dlogD p (cm −3 ) 21 23 25 27 29 31 02 04 06 08 10 12 14 16 18 20 22 24 26 1 1.1 1.2 1.3 1.4 1.5 1.6 1.7 1.8 1.9 20 nm, GF@RH90% AGA AGEG G G G G GA A A A A A A A A AGEG GE E E E E E E E 21 23 25 27 29 31 02 04 06 08 10 12 14 16 18 20 22 24 26 100 102 104 dN/dlogD p (cm − 3) Hyytiälä, March−April 1999
Fig. 4. Growth factors and concentrations of 10 nm (top two
fig-ures) and 20 nm particles in Hyytiälä March and April 1999. The concentrations of each size (dN/d log Dp, cm−3) are calculated using DMPS data. Also indicated are the air mass origins: A = Arctic, E = Middle Europe, G = Great Britain.
tions were particularly clear during days with Arctic air mass origin, as can be seen in Fig. 4. The daily mean highest and mean lowest growth factors for these days are presented in Table 3. For a detailed meteorological study of Biofor cam-paigns see Nilsson et al. (2001a) and Nilsson et al. (2001b). In air masses that were traced back to Great Britain or Cen-tral Europe externally mixed 20 nm particles were often ob-served. The frequency of observations of externally mixed particles seemed to increase the larger the measured size, e.g. in 1999 10 nm particles were externally mixed in 4%, 20 nm
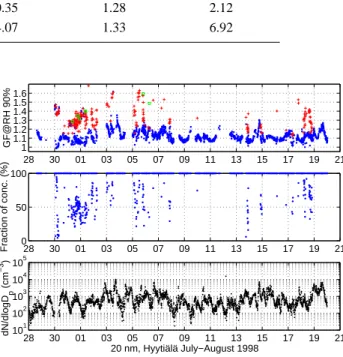
28 30 01 03 05 07 09 11 13 15 17 19 21 1 1.1 1.2 1.3 1.4 1.5 1.6 GF@RH 90% 28 30 01 03 05 07 09 11 13 15 17 19 21 0 50 100 Fraction of conc. (%) 28 30 01 03 05 07 09 11 13 15 17 19 21 101 102 103 104 105 dN/dlogD p (cm −3 ) 20 nm, Hyytiälä July−August 1998
Fig. 5. UF-TDMA data of 20 nm particles in Hyytiälä July and
Au-gust 1998. On top the growth factors (blue) at 90% relative humidity (the second mode during external mixing is plotted with red symbol and the third mode with green symbol), in the middle the concen-tration fraction of particles in the lower growth mode when external mixing was observed, and on the bottom the concentration of 20 nm particles (dN/d log Dp, cm−3) calculated using the DMPS data
particles in 25%, 50 nm in 40% and 109 nm in 83% of all observations (Hämeri et al., 2001b). The growth factors of 10 nm particles ranged from 0.98 to 1.65, and those of 20 nm from 0.99 to 1.81.
In August 1998 (also few days in July) only 20 nm parti-cles were studied, due to the very rare observations of 10 nm particles. Growth factors varied between 0.99 and 1.70 as can be seen in Fig. 5. Externally mixed particles were observed 13% of time, and there were also few incidents with three types of particles (0.3% of all measurements). Again obser-vations of externally mixed particles were mostly connected to air masses arriving from polluted areas south-west. 3.1.3 Urban background site
Luukki measurement site which is located near Helsinki is strongly influenced by the local pollution in the area. How-ever, during the periods of clean air masses originating typ-ically from the north, the particle properties are expected to be similar to those at remote areas of Finland. During the
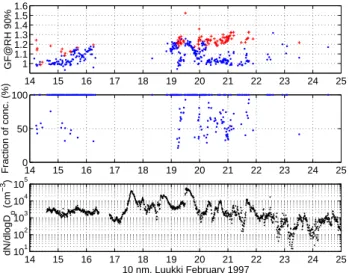
14 15 16 17 18 19 20 21 22 23 24 25 1 1.1 1.2 1.3 1.4 1.5 1.6 GF@RH 90% 14 15 16 17 18 19 20 21 22 23 24 25 0 50 100 Fraction of conc. (%) 14 15 16 17 18 19 20 21 22 23 24 25 101 102 103 104 105 dN/dlogD p (cm −3 ) 10 nm, Luukki February 1997
Fig. 6. UF-TDMA data of 10 nm particles in Luukki February 1997
(the urban background site). On top the growth factors (blue) at 90% relative humidity (the second mode during external mixing is plotted with red symbol), in the middle the concentration fraction of particles in the lower growth mode when external mixing was observed, and on the bottom the concentration of 10 nm particles (dN/d log Dp, cm−3) calculated using the DMPS data.
few days of UF-TDMA measurements in Luukki in Febru-ary 1997, particle hygroscopic properties similar to the other measurement sites in Finland were observed (Fig. 6).
The growth factors on the first days of the measurement campaign are very scattered, as are the growth factors in Helsinki in May 1998. On the 20th and 21st of February, on the other hand, the data resemble measurements in Helsinki in December 1999 – when externally mixed particles were observed. During the measurement period, new particle for-mation events similar to the ones observed in the Hyytiälä forest field station were observed (the similarity is based on the DMPS data). Unfortunately valid UF-TDMA data is available for one of these days only – the 19th of February. The temporal variations in the hygroscopic properties of 10 nm particles during the nucleation event day were very simi-lar to the nucleation event days in Hyytiälä: The growth fac-tors are low in the morning prior to the nucleation event, they gradually increase just before and during the nucleation and decrease again in the afternoon (Hämeri et al., 2001b). The new particle formation events have been described in more detail in Väkevä et al. (2000).
3.1.4 Coastal site
The detected growth factors at the Mace Head measurement station were clearly dictated by the origin of studied air mass (Väkevä et al., 2002). The Mace Head data are presented in Fig. 7 and Fig. 8. When clean marine air was measured (westerly air flow) pre-existing 20 nm particles were hygro-scopic with growth similar to or slightly less than pure
am-10 11 12 13 14 15 16 17 18 19 20 21 22 23 24 25 26 27 28 29 30 1 1.1 1.2 1.3 1.4 1.5 1.6 10 nm, GF@RH 90% I I I I
II II II II II II III III III III IV III IV IV
10 11 12 13 14 15 16 17 18 19 20 21 22 23 24 25 26 27 28 29 30 0 50 100 Fraction of conc. (%) 10 11 12 13 14 15 16 17 18 19 20 21 22 23 24 25 26 27 28 29 30 101 102 103 104 105 106 10 nm (cm −3 ) 10 11 12 13 14 15 16 17 18 19 20 21 22 23 24 25 26 27 28 29 30 102 103 104 105 106 5 nm (cm − 3)
Mace Head September 1998
Fig. 7. UF-TDMA data of 10 nm particles in Mace Head (the coastal
site) in September 1998. On top the growth factors (blue) at 90% relative humidity (the second mode during external mixing is plot-ted with red symbol), then the concentration fraction of particles in the lower growth mode when external mixing was observed, thirdly the concentration of 10 nm particles (dN/d log Dp, cm−3) calcu-lated using the DMPS data. On the bottom the concentrations of 5 nm particles (DMPS data, dN/d log Dp) are shown - these data are presented as an indication of nucleation events, during which large numbers of 5 nm were detected. Particle formation event clas-sification from O’Dowd et al. (2002): Type I clean marine air flow from the south to north west; Type II clean marine air but with ad-vection over multiple tidal zones from northwest-to-north sector; Type III polluted air from the east to southerly sector and advect-ing over a tidal region 2–3 km from the station; Type IV conditions correspond to air trajectories with no advection of tidal regions; U = unclassified.
monium sulphate particles. On the other hand, the 10 nm (and 8 nm) particles nucleated during the new particle for-mation events were hydrofobic, or had growth factors close to 1.0. These particles were observed in westerly air flow during low tide periods. In air masses that entered the mea-surement site through several coastal source regions during low tide periods, but were still of marine origin, diurnal cycle of the hygroscopic behaviour similar to Hyytiälä nucleation event days was detected.
var-06 07 08 09 10 11 12 13 14 15 16 17 18 19 20 21 22 23 24 25 26 27 28 29 30 01 1 1.2 1.4 1.6 1.8 2 10 nm, GF@RH 90% I I I I I I II II U II II II II II U I,II I,U III III
06 07 08 09 10 11 12 13 14 15 16 17 18 19 20 21 22 23 24 25 26 27 28 29 30 01 100 102 104 106 10 nm (cm −3 ) 06 07 08 09 10 11 12 13 14 15 16 17 18 19 20 21 22 23 24 25 26 27 28 29 30 01 1 1.2 1.4 1.6 1.8 2 20 nm, GF@RH 90% I I I I I I II II U II II II II II U I,II I,U III III
06 07 08 09 10 11 12 13 14 15 16 17 18 19 20 21 22 23 24 25 26 27 28 29 30 01 100 102 104 106 20 nm (cm − 3) 06 07 08 09 10 11 12 13 14 15 16 17 18 19 20 21 22 23 24 25 26 27 28 29 30 01 102 104 106 5 nm (cm − 3)
Mace Head June 1999
Fig. 8. UF-TDMA data measured in Mace Head (the coastal site) in
June 1999. Shown are the growth factors at 90% relative humidity of 10 nm and 20 nm particles, below which the concentration plot of both sizes (dN/d log Dp, cm−3) calculated using the DMPS data. On the bottom the concentrations of 5 nm particles (DMPS data,
dN/dlog Dp) are shown - this data is presented as an indication of nucleation events, during which large numbers of 5 nm were de-tected. The particle formation event classification is presented in Fig. 7.
ied between 0.99 and 1.59, and in June 1999 10 nm growth factors varied between 0.97 and 1.97, and 20 nm growth fac-tors between 0.99 and 1.78. Also externally mixed particle populations were detected: during 1998 10 nm 6% of time, and during 1999 10 nm 3% and 20 nm 8% of time. A gen-eral conclusion was drawn that the externally mixed particles were connected to polluted air masses. The 20 nm particles affected by fresh combustion sources were non- or slightly hygroscopic, and the background marine particles more hy-groscopic. On the other hand, freshly nucleated 10 nm par-ticles that were formed in polluted air masses were hygro-scopic. This was explained by abundant sulphuric acid con-centrations (Berresheim et al., 2002).
0.9 1 1.1 1.2 1.3 1.4 1.5 1.6 1.7 1.8 0 100 200 404 observations 0.9 1 1.1 1.2 1.3 1.4 1.5 1.6 1.7 1.8 0 50 100 169 observations 0.9 1 1.1 1.2 1.3 1.4 1.5 1.6 1.7 1.8 0 500 1000 1509 observations 0.9 1 1.1 1.2 1.3 1.4 1.5 1.6 1.7 1.8 0 100 200 505 observ. 0.9 1 1.1 1.2 1.3 1.4 1.5 1.6 1.7 1.8 0 100 200 300 Number of observations 706 observations 0.9 1 1.1 1.2 1.3 1.4 1.5 1.6 1.7 1.8 0 100 200 300 794 observations 0.9 1 1.1 1.2 1.3 1.4 1.5 1.6 1.7 1.8 0 50 100 10 nm GF 297 observ. 0.9 1 1.1 1.2 1.3 1.4 1.5 1.6 1.7 1.80.1 1 10 100 1000 0.9 1 1.1 1.2 1.3 1.4 1.5 1.6 1.7 1.80.1 1 10 100 1000 0.9 1 1.1 1.2 1.3 1.4 1.5 1.6 1.7 1.80.1 1 10 100 1000 0.9 1 1.1 1.2 1.3 1.4 1.5 1.6 1.7 1.80.1 1 10 100 1000 0.9 1 1.1 1.2 1.3 1.4 1.5 1.6 1.7 1.80.1 1 10 100 1000 DMA2 Concentration 0.9 1 1.1 1.2 1.3 1.4 1.5 1.6 1.7 1.80.1 1 10 100 1000 0.9 1 1.1 1.2 1.3 1.4 1.5 1.6 1.7 1.80.1 1 10 100 1000 10 nm GF a) b) c) d) e) f) g)
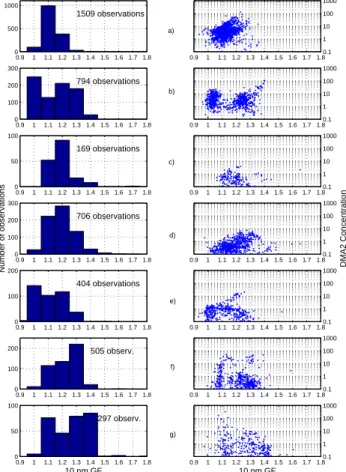
Fig. 9. Frequency of occurrence of different growth factors (left)
and growth factors versus measured DMA2 concentrations (right) for 10 nm particles. The actual ambient 10 nm (dN/d log Dp) con-centrations ( cm−3) are about three orders of magnitude larger than the presented values. (a) Helsinki May 1998; (b) Helsinki Decem-ber 1999; (c) Hyytiälä April–May 1998; (d) Hyytiälä March–April 1999; (e) Luukki February 1997; (f) Mace Head September 1998;
(g) Mace Head June 1999.
3.2 Frequency of occurrence
In Figs. 9 (10 nm data) and 10 (20 nm data) the frequency distributions of the observed growth factors are presented. Also plotted (on the right panel) are the growth factors versus DMA2 concentrations for each measurement (the ambient concentrations are two to three orders of magnitude higher than the DMA2 concentrations). This is to show that, for instance for 10 nm particles in Luukki growth factor 1 was observed most frequently, but particles with growth factor of about 1.2 were most abundant in number concentration. Similarly also for Hyytiälä and Helsinki 1998 measurements; concentration weighed mean growth factors (over the whole measurement period) tend to be bigger than judging by just the number of observations. At both of these sites (Hyytiälä and Helsinki, 1998) a relatively wide range of growth fac-tors was observed daily, and especially in Hyytiälä the high
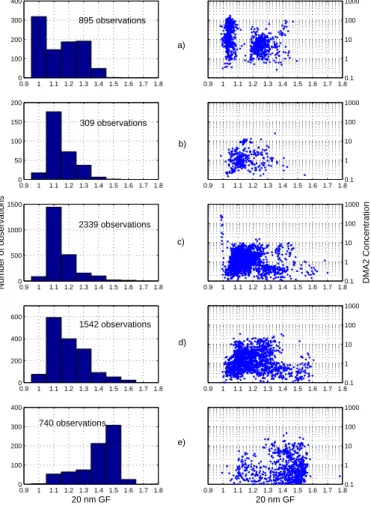
0.9 1 1.1 1.2 1.3 1.4 1.5 1.6 1.7 1.8 0 50 100 150 200 309 observations 0.9 1 1.1 1.2 1.3 1.4 1.5 1.6 1.7 1.8 0 500 1000 1500 Number of observations 2339 observations 0.9 1 1.1 1.2 1.3 1.4 1.5 1.6 1.7 1.8 0 200 400 600 1542 observations 0.9 1 1.1 1.2 1.3 1.4 1.5 1.6 1.7 1.8 0 100 200 300 400 740 observations 20 nm GF 0.9 1 1.1 1.2 1.3 1.4 1.5 1.6 1.7 1.8 0 100 200 300 400 895 observations 0.9 1 1.1 1.2 1.3 1.4 1.5 1.6 1.7 1.80.1 1 10 100 1000 0.9 1 1.1 1.2 1.3 1.4 1.5 1.6 1.7 1.80.1 1 10 100 1000 DMA2 Concentration 0.9 1 1.1 1.2 1.3 1.4 1.5 1.6 1.7 1.80.1 1 10 100 1000 0.9 1 1.1 1.2 1.3 1.4 1.5 1.6 1.7 1.80.1 1 10 100 1000 20 nm GF 0.9 1 1.1 1.2 1.3 1.4 1.5 1.6 1.7 1.80.1 1 10 100 1000 a) b) c) d) e)
Fig. 10. Frequency of occurrence of different growth factors (left) and growth factors versus measured DMA2 concentrations (right) for 20 nm par-ticles. The actual ambient 20 nm (dN/d log Dp) concentrations ( cm−3) are about two orders of magnitude larger than the presented values. (a)
Helsinki December 1999; (b) Hyytiälä April–May 1998; (c) Hyytiälä July– August 1998; (d) Hyytiälä March– April 1999; (e) Mace Head June 1999.
growth factors were mostly observed during only few day time hours during which also the concentrations were at their highest. This is also the case for the nucleation day in Luukki (February 19th 1997). On this day the highest number con-centrations during the whole measurement period were de-tected.
Comparison of 10 nm measurements performed in Helsinki in May and in December reveals major differences: in May "less hygroscopic" particles were observed system-atically, and in December particles were externally mixed. What is noteworthy in Fig. 9 is that there seems to be a gap in December in just those growth factors that are most abun-dant in May. The anthropogenic sources in an urban area dif-fer considerably between winter and summer owing to heat-ing of buildheat-ings. However, the heat energy production in Helsinki downtown area is organised centrally in few power plants having high stacks and the emissions are detected in downtown area only with certain wind direction. The emis-sions from traffic are likely to be similar (although perhaps not equal in magnitude) during the whole year, but natu-ral sources undoubtedly differ between summer and winter. Also meteorological conditions and atmospheric chemistry may significantly alter the behaviour of precursor gases and
condensable vapours between the summer and winter time measurement periods.
Hygroscopic properties of the 20 nm particles (Fig. 10) have clear differences between the measurement sites: hy-groscopic particles in Mace Head (coastal site) have higher growth factors than in the other sites. The observed growth factors indicate that these particles contain an inorganic salt compound (growth factor similar to ammonium sulphate). On the other hand, Helsinki is also situated on the shore-line, and therefore the observed hygroscopic particles might contain similar compounds to the Mace Head particles. The observed growth factors of hygroscopic particles in Helsinki are, however, smaller than in Mace Head. This does not nec-essarily rule out similarities: salt particles in Helsinki might be coated with, e.g. hydrocarbons from traffic and other com-bustion processes that affect their water solubility (Hansson et al., 1998; Xiong et al., 1998). Another potential explana-tion is that the higher growth mode in Helsinki results from ageing: originally less-hygroscopic particles tend to gain sol-uble properties when aged (e.g. Cocker et al., 2001; Swi-etlicki et al., 2000). If this is the case also the 10 nm particles (or the vapours that condensed on both particle sizes) have undergone a similar ageing process, since in December 1999
both 10 and 20 nm particles are very similar with respect to hygroscopic properties. Unfortunately UF-TDMA measure-ments of 20 nm particles are not available in Helsinki during summer time.
The hygroscopic properties of aerosol population are typi-cally used as input values in state-of-art aerosol dynamical models (see Pirjola and Kulmala, 2001) and cloud micro-physical models (see Kulmala et al., 1996). Therefore typ-ical growth factors, and DMA2 concentrations of different hygroscopic modes are given in Tables 1, 2 and 3. The two mode behaviour in urban air can clearly be seen from Table 2 for both 10 and 20 nm particles. On the other hand the be-haviour of 10 nm and 20 nm in coastal environment differs from each other.
4 Summary and conclusions
In all of the studied sites a background population of nu-cleation mode particles was observed frequently, but also a number of particle formation events was observed. In the ur-ban site the anthropogenic fraction of nucleation mode par-ticles dominates the lower end of the size distribution. The characteristics of the nucleation events are described in, e.g. Mäkelä et al. (1997), O’Dowd et al. (1998) and Väkevä et al. (2000). Apparently, the nucleation in atmosphere is impor-tant source for new particles. The relative importance of nucleation events in controlling the nucleation mode parti-cle population varies between the sites. Especially in urban air, the anthropogenic fraction dominates the 10 nm particle population most of the time. The multiple sources of nucle-ation mode particles are observable as external mixture of the aerosol. This was observed in all the measurement sites. However, the external mixing was much more frequent in ur-ban air compared with background air both in coastal and forest site.
The atmospheric aerosols are generally classified into four classes based on their hygroscopicity. The background of the growth factor classification is based on the earlier work for larger particles by other researchers, e.g. Swietlicki et al. (1999). Using the observations presented in this paper our aim was to investigate if similar classification is practical also for the nucleation mode particles. It should be noted that as the Kelvin correction for curvature is significant at this size range, the absolute values of the growth factors are lower than for accumulation mode particles. Some of the growth factor classes were obvious when studying the data sets: e.g. hydrophobic 10 nm particles were observed during the nu-cleation events at the coastal site (GF =1). During the occa-sions of externally mixed particles in downtown Helsinki in the winter of 1999, the less hygroscopic 10 nm particles had growth factors ranging between 1.0 and 1.1 and the more hy-groscopic particles between 1.2 and 1.4. Also when exter-nally mixed particles were observed at the coastal site the more hygroscopic mode had growth factors in the range 1.2–
1.4 or higher. Those particles with growth factors higher than 1.4 were classified as sea salt, due to their hygroscopic prop-erties resembling NaCl particles. Thus we suggest that the classification of nucleation mode particles is also based on four categories with the following values: the non hygro-scopic particles, with growth factor 1; the less-hygrohygro-scopic particles with growth factors ranging between 1.05 and 1.2; the more hygroscopic particles, with growth factors 1.2-1.4; and the sea salt particles, with growth factors larger than 1.4. In all the studied locations, the growth factors varied within these categories, however, most often between 1.0 and 1.4.
Low growth factors were occasionally detected at all sites, but especially connected with the urban measurements growth factors lower that 1 were observed. Growth factors lower than unity could be explained by soot or other ag-gregated particles that collapse when interacting with water vapour at high relative humidities. On the other hand, the values lower than 1 are typically within the accuracy of the experiments.
The growth factors that are only slightly larger than unity may partly be explained by adsorption of layers of water molecules on the particle surface. This phenomenon is more pronounced for small particle sizes and is experimentally verified for 10–20 nm particles using an UF-TDMA setup. Adsorption of water on nucleation mode particles using UF-TDMA data is discussed in detail by Romakkaniemi et al. (2001).
Based on the UF-TDMA studies 10 nm and 20 nm par-ticles have similar hygroscopic properties in urban (winter time) environment. Both the magnitude and the bimodal structure of the hygroscopic growth factors are similar for both sizes, when Kelvin effect due to the curvature of the particle surface is taken into account. The likely explanation is that most of the time both particle sizes belong to the same size mode and have same origin and composition.
In forest environment the diurnal behaviour with higher growth factors at day time and low at night time is also sim-ilar for both 10 nm and 20 nm particles. As in the urban site, also in forest environment both particle sizes belonged to the same size mode most of the time. During the most intensive nucleation events, the whole nucleation mode was in the be-ginning below 20 nm. However, the condensable vapour that grew the nucleated particles into observable size of 10 nm was probably condensing also on the surfaces of the pre-existing particles, as during those periods the pre-pre-existing 20 nm particles showed also hygroscopic properties similar to freshly nucleated 10 nm particles.
The coastal measurements showed systematically that the 20 nm particles were hygroscopic, whereas the freshly nu-cleated 10 nm particles were non-hygroscopic. The coastal observations during which 10 nm and 20 nm particles were clearly of different composition, are explained by different sources and ages of the particles. Particles that are formed during the coastal nucleation events consist of hydrofobic material. Whether this is the compound that originally was
responsible for the formation of the particles, or if some hy-drofobic vapour condensed on the stable clusters and grew them to 10 nm particles, can not be distinguished based on UF-TDMA measurements. During the most intense nucle-ation events the growth factors of 20 nm particles were also seen to decrease. This is an indication that there was a very strong source of hydrofobic vapour available, and the vapour also condensed on the pre-existing particles.
The urban site was the only one where the air mass origin did not seem to affect the hygroscopic growth behaviour of the studied particle sizes.
In the coastal site, Mace Head, the growth factors were obviously affected by air mass history: Nucleation events in clean coastal air produced particles with low growth factors. When air mass was possibly influenced by several source re-gions of condensable gases – yet clean air – diurnal temporal variations of growth factors resembled measurements in the forest site. When polluted air was detected growth factors varied just like in Helsinki during the May 1998 period. It should also be noted that during the September 1998 mea-surements in Mace Head smaller growth factors were de-tected than in June 1999. This difference is explained pos-sibly by differences in the condensing vapours or meteoro-logical conditions. This assumption was also backed by the cloud condensation nucleus counter (CCNC) measurements performed at the site during both the periods: in June Aitken and accumulation mode particles were also more soluble than the ones measured in September (Väkevä et al., 2002).
At the forest site, Hyytiälä, air mass history seemed to have an effect on growth factors. This was most evident in observations of external mixing. When air masses origi-nated from south-west (especially from western Atlantic over Great Britain) externally mixed 20 nm particles were often detected. When backward trajectories originated from Great Britain, the growth factors of the more hygroscopic mode were of the same magnitude as in Mace Head. When external mixing was observed in air masses traced back to Central Eu-rope, both hygroscopic modes showed temporal variations. On the average particles belonging to both modes were more soluble during day time than at night. One possible explana-tion for this is chemical transformaexplana-tion of the composiexplana-tion of the particles or condensing vapours due to oxidation and air chemistry. The origin of air masses seemed crucial also for the nucleation events, which mostly occurred in Arctic air (Nilsson et al., 2001b). However, diurnal pattern of hygro-scopic properties of nucleation mode particles (10 nm) was detected even during days with no observable new particle formation.
Acknowledgements. The financial support from European
Com-mission Environment and Climate Programme contracts ENV4-CT97-0405 (BIOFOR) and ENV4-CT97-0526 (PARFORCE) are acknowledged.
References
Berresheim, H., Elste, T., Tremmel, H. G., O’Dowd, C. D., Allen, A. G., Hansson, H.-C., Rosman, K., Dal Maso, M., Mäkelä, J. M., and Kulmala, M.: Gas-Aerosol relationships of H2SO4, MSA, and OH: Observations in the Coastal Marine Boundary Layer at Mace Head, Ireland, J. Geophys. Res., in press, 2002. Birmili, W. and Wiedensohler, A.: New particle formation in the
continental boundary layer: Meteorological and gas phase pa-rameter influence, Geophys. Res. Lett., 27, 3325–3328, 2000. Buzorius, G., Hämeri, K., Pekkanen, J., and Kulmala, M.: Spatial
variation of aerosol number concentration in Helsinki city, At-mos. Environ., 33, 553–565, 1999.
Cocker , D. R., Whitlock, N. E., Flagan, R. C., and Seinfeld, J.: Hy-groscopic properties of Pasadena, California Aerosol, Aerosol Sci. Technol., 35, 637–647, 2001.
Covert, D. S. and Heintzenberg, J.: Size distributions and chemical properties of aerosol at Ny Ålesund, Svalbard, Atmos. Environ., 27A, 2989–2997, 1993.
Djikaev, Y. S., Bowles, R., Reiss, H., Hämeri, K., Laaksonen, A., and Väkevä, M.: Theory of size dependent deliquescence of nanoparticles: Relation to heterogeneous nucleation and com-parison with experiments, J. Phys. Chem. B, 105, 7708–7722, 2001.
Hansson, H.-C., Wiedensohler, A., Koloutsou-Vakakis, S., Hämeri, K., and Orsini, D.: NaCl aerosol particle hygroscopicity depen-dence on mixing with organic compounds, J. Atmos. Chem., 31, 321–346, 1998.
Hämeri, K., Kulmala, M., Aalto, P., Leszczynski, K., Visuri, R., and Hämekoski, K.: The investigations of aerosol particle formation in urban background area of Helsinki, Atmospheric Research, 41, 281–298, 1996.
Hämeri, K., Väkevä, M., Hansson, H.-C., and Laaksonen, A.: Hy-groscopic growth of ultrafine ammonium sulphate aerosol mea-sured using an ultrafine tandem differential mobility analyser, J. Geophys. Res., 105, 22 231–22 242, 2000.
Hämeri, K., Laaksonen, A., Väkevä, M., and Suni, T.: Hygroscopic growth of ultrafine sodium chloride particles, J. Geophys. Res., 106, 20 749–20 758, 2001a.
Hämeri, K., Väkevä, M., Aalto, P. P., Kulmala, M., Swietlicki, E., Zhou, J., Seidl, W., Becker, E., and O’Dowd, C. D.: Hygroscopic and CCN properties of aerosol particles in boreal forest, Tellus, 53B, 359–379, 2001b.
Kulmala, M., Korhonen, P., Vesala, T., Hansson, H.-C., Noone, K., and Svenningsson, B.: The effect of hygroscopicity on cloud droplet formation, Tellus, 48B, 347–360, 1996.
Kulmala, M., Hämeri, K., Aalto, P. P., Mäkelä, J. M., Pirjola, L., Nilsson, E. D., Buzorius, G., Rannik, Ü., Dal Maso, M., Seidl, W., Hoffmann, T., Janson, R., Hansson, H.-C., Viisanen, Y., Laaksonen, A., and O’Dowd, C. D.: Overview of the interna-tional project on biogenic aerosol formation in the boreal forest (BIOFOR), Tellus, 53B, 324–343, 2001.
McMurry, P. H. and Stolzenburg, M. R.: On the sensitivity of par-icle size to relative humidity for Los Angeles aerosols, Atmos. Environ., 23, 497–507, 1989.
Mäkelä, J. M., Aalto, P., Jokinen, V., Pohja, T., Nissinen, A., Palm-roth, S., Markkanen, T., Seitsonen, K., Lihavainen, H., and Kul-mala, M.: Observations of ultrafine aerosol particle formation and growth in boreal forest, Geophys. Res. Lett., 24, 1219–1222, 1997.
Nilsson, E. D., Rannik, Ü., Kulmala, M., Buzorius, G., and O’Dowd, C. D.: Effect of the continental boundary layer evo-lution, convection, turbulence and entrainment on aerosol forma-tion, Tellus, 53B, 441–461, 2001a.
Nilsson, E. D., Paatero, J., and Boy, M.: Effects of air masses and synoptic weather on aerosol formation in the continental bound-ary layer, Tellus, 53B, 462–478, 2001b.
O’Dowd, C. D., Geever, M., Hill, M. K., Smith, M. H., and Jen-nings, S. G.: New particle formation and spatial scales in the clean marine coastal environment, Geophys. Res. Lett., 25, 1661–1664, 1998.
O’Dowd, C. D., Hämeri, K., Mäkelä, J. M., Väkevä, M., Aalto, P. P., de Leeuw, G., Kunz, G. J., Becker, E., Hansson, H.-C., Allen, A. G., Harrison, R. M., Berresheim, H., Kleefeld, C., Geever, M., Jennings, S. G., and Kulmala, M.: Coastal new particle for-mation: Environmental conditions and aerosol physico-chemical characteristics during nucleation bursts, J. Geophys. Res., in press, 2002.
Pirjola, L. and Kulmala, M.: Development of particle size and com-position distributions with a novel aerosol dynamics model, Tel-lus, 53B, 491–509, 2001.
Romakkaniemi, S., Hämeri, K., Väkevä, M., and Laaksonen, A.: Adsorption of water on 8–15 nm NaCl and (NH4)2SO4aerosols
measured using an ultrafine tamdem differential mobility ana-lyzer, J. Phys. Chem. A, 105, 8183–8188, 2001.
Stratmann, F., Orsini, D., and Kauffeldt, Th.: Inversion algorithm for TDMA measurements, J. Aerosol Sci. 28 S1, 701–702, 1997. Svenningsson, B., Hansson, H.-C., and Wiedensohler, A.: Hygro-scopic growth of aerosol particles in the Po Valley, Tellus, 44B,
556–569, 1992.
Swietlicki, E., Zhou, J., Berg, O. H., Martinsson, B. G., Frank, G., Cederfelt, S.-I., Dusek, U., Berner, A., Birmili, W., Wieden-sohler, A., Yuskiewicz, B., and Bower, K. N.: A closure study of sub-micrometer aerosol particle hygroscopic behaviour, At-mospheric Research, 50, 205–240, 1999.
Swietlicki, E., Zhou, J., Covert, D. S., Hämeri, K., Busch, B., Väkevä, M., Dusek, U., Berg, O. H., Wiedensohler, A., Aalto, P., Mäkelä, J., Martinsson, B. G., Papaspiropoulos, G., Mentes, B., Frank, G., and Stratmann, F.: Hygroscopic properties of aerosol particles in the north-eastern Atlantic during ACE-2, Tellus, 52B, 201–227, 2000.
Väkevä, M., Hämeri, K., Puhakka, T., Nilsson, E. D., Hohti, H., and Mäkelä, J. M.: Effects of meteorological processes on aerosol particle size distribution in an urban background area, J. Geo-phys. Res., 105, 9807–9821, 2000.
Väkevä, M., Hämeri, K., and Aalto, P. P.: Hygroscopic properties of nucleation mode and Aitken mode particles during nucleation bursts and in background air on west coast of Ireland, J. Geophys. Res., in press, 2002.
Yuskiewicz, B., Stratmann, F., and Kauffeldt, Th.: Resolution of a TDMA-inversion algorithm, J. Aerosol Sci., 29 S1, 1245–1246, 1998.
Xiong, J. Q., Zhong, M., Fang, C., Chen, L. C., and Lippmann, M.: Influence of organic films on the hygroscopicity of ultrafine sul-furic acid aerosol, Environ. Sci. Technol., 32, 3536–3541, 1998. BIOFOR: http://www.mist.helsinki.fi/Projects/Project.html#biofor PARFORCE: http://www.macehead.physics.nuigalway.ie/parforce/