HAL Id: hal-00300828
https://hal.archives-ouvertes.fr/hal-00300828
Submitted on 3 Apr 2002HAL is a multi-disciplinary open access
archive for the deposit and dissemination of sci-entific research documents, whether they are pub-lished or not. The documents may come from teaching and research institutions in France or abroad, or from public or private research centers.
L’archive ouverte pluridisciplinaire HAL, est destinée au dépôt et à la diffusion de documents scientifiques de niveau recherche, publiés ou non, émanant des établissements d’enseignement et de recherche français ou étrangers, des laboratoires publics ou privés.
Surface ozone depletion episodes in the Arctic and
Antarctic from historical ozonesonde records
D. W. Tarasick, J. W. Bottenheim
To cite this version:
D. W. Tarasick, J. W. Bottenheim. Surface ozone depletion episodes in the Arctic and Antarctic from historical ozonesonde records. Atmospheric Chemistry and Physics Discussions, European Geosciences Union, 2002, 2 (2), pp.339-356. �hal-00300828�
ACPD
2, 339–356, 2002 Surface ozone depletion episodes D. W. Tarasick and J. W. Bottenheim Title Page Abstract Introduction Conclusions References Tables Figures J I J I Back CloseFull Screen / Esc
Print Version Interactive Discussion
c
EGS 2002
Atmos. Chem. Phys. Discuss., 2, 339–356, 2002 www.atmos-chem-phys.org/acpd/2/339/
c
European Geophysical Society 2002
Atmospheric Chemistry and Physics Discussions
Surface ozone depletion episodes in the
Arctic and Antarctic from historical
ozonesonde records
D. W. Tarasick and J. W. Bottenheim
Environment Canada, 4905 Dufferin Street, Downsview, ON, M3H 5T4 Canada Received: 5 March 2002 – Accepted: 15 March 2002 – Published: 3 April 2002 Correspondence to: D. W. Tarasick (david.tarasick@ec.gc.ca)
ACPD
2, 339–356, 2002 Surface ozone depletion episodes D. W. Tarasick and J. W. Bottenheim Title Page Abstract Introduction Conclusions References Tables Figures J I J I Back CloseFull Screen / Esc
Print Version Interactive Discussion
c
EGS 2002
Abstract
Episodes of ozone depletion in the lowermost Arctic atmosphere (0–2 km) at polar sunrise have been intensively studied at Alert, Canada, and are thought to result from catalytic reactions involving bromine. Recent observations of high concentrations of tropospheric BrO over large areas of the Arctic and Antarctic suggest that such
deple-5
tion events should also be seen by ozonesondes at other polar stations. An examina-tion of historical ozonesonde records shows that such events occur frequently at Alert, Eureka and Resolute, but much less frequently at Churchill and at other stations. The differences appear to be attributable to differences in surface meteorology. The long record at Resolute shows depletions since 1966, but with an apparent increase in their
10
frequency since about 1985. This is surprising, since the Br involved in the depletion mechanism is believed to be entirely of natural origin.
1. Introduction
Observations of anomalously low ozone at the surface in the Arctic spring have been reported by several authors (Bottenheim et al., 1986; Oltmans and Kohmyr, 1986;
An-15
lauf et al., 1994) and are thought to be caused by catalytic reactions involving reactive halogen atoms, especially bromine, originating in the polar ocean (Barrie et al., 1988; Barrie and Platt, 1997). The reaction of bromine with ozone yields BrO, so that the presence of tropospheric BrO should be an indicator of ozone depletion. Recent air-craft and satellite observations indicate that significant amounts of BrO are found in the
20
lower troposphere over a large area of the Arctic at polar sunrise (McElroy et al., 1999; Richter et al., 1998; Wagner and Platt, 1997). In particular Richter et al. (1998) find a large area of enhanced BrO centred over Hudson Bay, north of Churchill, Canada. Images from the GOME instrument aboard ERS-2 also show BrO in the Antarctic, near the edges of the polar continent. This suggests that boundary-layer depletions should
25
ACPD
2, 339–356, 2002 Surface ozone depletion episodes D. W. Tarasick and J. W. Bottenheim Title Page Abstract Introduction Conclusions References Tables Figures J I J I Back CloseFull Screen / Esc
Print Version Interactive Discussion
c
EGS 2002
records at a number of Canadian and other sites.
In addition to the extensive observations at Alert (83 N, 62 W), such events have in fact previously been reported (primarily in surface data) for Barrow, Alaska (71 N, 157 W) (Oltmans and Kohmyr, 1986), Ny- ˚Alesund (79 N, 12 E) and Bear Island (74 N, 19 E) in the Norwegian Arctic (Solberg et al., 1996), Thule (77 N, 69 W) and Søndre
5
Strømfjord (67 N, 51 W) in Greenland (Rasmussen et al., 1997; Miller et al., 1997), as well as Marambio (64 S, 57 W) (Taalas et al., 1993), Neumayer (71 S, 8 W) (Wessel et al., 1998), and apparently Syowa (69 S, 40 E) (Murayama et al., 1992), in the Antarctic. In general these have been studied as individual events, or (usually short) time series of surface measurements. For this reason little is known about how frequently they
10
occur, or have occurred in the past, at different locations in the Arctic and Antarctic. The ozonesonde record for a number of stations, particularly in Canada (where son-des have been launched regularly since 1966) offers a unique opportunity to examine several time series of this interesting phenomenon, with measurements that are both long-term, and vertically-resolved.
15
2. Recent observations
Figure 1 shows examples of depletion events observed recently at three Canadian ozonesonde stations: Eureka (80 N, 86 W), Resolute (75 N, 95 W) and Churchill (59 N, 94 W). Like Alert, all three stations are near polar sea ice and are close to or within the area of maximum BrO concentration found in March and April in the GOME dataset.
20
These examples illustrate a number of features of these events: depletions can be partial (Fig. 1c) or complete (Fig. 1b), where the ozone drops below measurable levels (∼ 1 ppb); they are generally associated with an inversion layer (layer of strongly posi-tive potential temperature gradient, shown on the right of each figure); in vertical extent they can be from less than 100 m to more than 1 km; they are observed in the Arctic
25
ACPD
2, 339–356, 2002 Surface ozone depletion episodes D. W. Tarasick and J. W. Bottenheim Title Page Abstract Introduction Conclusions References Tables Figures J I J I Back CloseFull Screen / Esc
Print Version Interactive Discussion
c
EGS 2002
3. Historical data
While the high resolution data in Fig. 1 is available only for the last few years, there is a much larger archive of lower resolution data. The effective resolution of these data is much better than might be apparent, as the older sondes actually made an ozone measurement every 15–20 s, a frequency comparable to the 10-second measurements
5
that are currently archived. This was recorded mechanically and reduced by hand, the operator recording all inflections in the profile considered significant (points whose omission would induce an error in the reconstructed profile greater than ∼ 2%). This is more properly regarded as a “data compression” technique (to use modern terminol-ogy) than a low-resolution transcription. Events like those in Fig. 1 should therefore be
10
clearly captured in the older record. This is easily verified, as the older format is still routinely produced for Canadian flights. Figure 2 shows the same soundings as in the previous figure, but in the older format. While the nominal resolution of these profiles is lower than of Fig. 1, the effective resolution is clearly adequate to identify both the degree of depletion and the vertical extent of the depleted layer and the accompanying
15
temperature inversion.
The soundings in the preceding figures were all made with ECC sondes. Before 1980 the Canadian network used Brewer-Mast (BM) sondes, which are believed to have had a negative bias in the troposphere, as well as a greater frequency of sonde malfunction. Despite these deficiencies, the Brewer-Mast record also clearly shows these events.
20
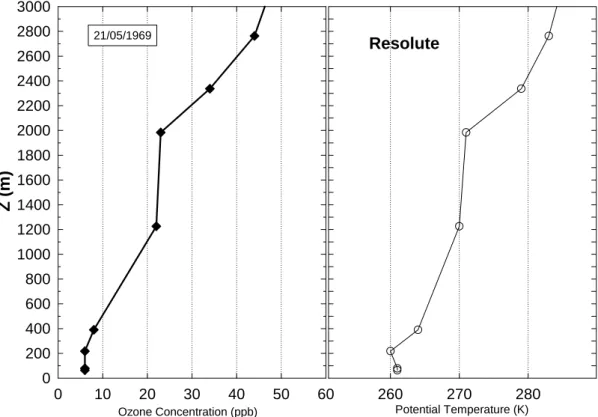
Figure 3, from May, 1969, shows what appears to be a two-layer depletion, a strong depletion from the surface to about 250 m, with a weaker one above it, extending to about 2 km in height.
Depletions are in fact sufficiently frequent and persistent at Resolute, Eureka and Alert that average surface ozone there shows a springtime minimum, even though
25
ozone in the middle and upper troposphere at these stations has an annual maximum in May (Tarasick et al., 1995). In addition, the Canadian ozonesonde record is quite extensive, and regular: sondes are flown weekly at Canadian stations, with additional
ACPD
2, 339–356, 2002 Surface ozone depletion episodes D. W. Tarasick and J. W. Bottenheim Title Page Abstract Introduction Conclusions References Tables Figures J I J I Back CloseFull Screen / Esc
Print Version Interactive Discussion
c
EGS 2002
flights during times of special interest, like the arctic spring. This makes it possible to examine the climatology of these events.
A number of other ozonesonde stations are also situated where they might be ex-pected to experience frequent surface depletion episodes: Ny- ˚Alesund, Bear Island, Thule and Scoresbysund (71 N, 22 W) in the Arctic, as well as Syowa, Marambio and
5
Neumayer in the Antarctic. We examined ozonesonde records for these stations as well. Only a few years of data were available to us for Bear Island (1993–5), Thule (1994–6; March 2000) and Scoresbysund (1994–7; March 1999, 2000); we found two events at Thule and none at Bear Island or Scoresbysund.
Syowa, Neumayer and Marambio are close to polar ice and to areas where the
10
GOME instrument shows high BrO concentrations around the Antarctic continent in the September–November period of Antarctic spring. The Syowa record is also very long, beginning in 1966. Unfortunately the data resolution in the troposphere is very low (only standard levels are reported), making the unambiguous detection of depletion events difficult. Sondes are also of a different type (carbon-iodine). No events were
15
found at Syowa.
The other three stations (Ny- ˚Alesund, Marambio and Neumayer) have sufficient res-olution and long enough records for several unambiguous examples of depletion events to be detected in each case. Table 1 shows the number of soundings indicating surface depletion, as well as the total number of soundings (in parentheses) at these and the
20
Canadian stations. Here surface depletion was defined as [O3] < 10 ppb at the surface and the first recorded level. This is a relatively severe selection criterion: it would ex-clude several of the events in Fig. 1. The data set employed consists of all ECC flights, without total ozone correction, and all Brewer-Mast flights with total ozone correction factors between 0.8 and 1.6. Brewer-Mast data were also corrected for a known bias
25
in the troposphere (Tarasick et al., 2002). Results varied only slightly when this bias correction was omitted, or when all BM flights were included, or total ozone corrected ECC data was used. All flights were analyzed in the old lower-resolution format in or-der to avoid possible biases that might be introduced by the switch to higher resolution
ACPD
2, 339–356, 2002 Surface ozone depletion episodes D. W. Tarasick and J. W. Bottenheim Title Page Abstract Introduction Conclusions References Tables Figures J I J I Back CloseFull Screen / Esc
Print Version Interactive Discussion
c
EGS 2002
digital sondes in the mid-1990s.
As anticipated, there are relatively few soundings indicating surface depletion at Alert, Eureka and Resolute outside of the March–May period. There are, however, relatively few surface depletion episodes altogether at Churchill, which is surprising, given its central location with respect to the large area of enhanced BrO observed by
5
GOME. Similar remarks may be made for Ny- ˚Alesund, Marambio and Neumayer. At the two antarctic stations a surprising number of soundings in the December–February period (summer) indicate surface depletion. Comparison of these profiles with those indicating surface depletion in the September–November period showed that in al-most every case the summer soundings indicated low ozone throughout the lower and
10
middle troposphere, while the spring soundings demonstrated the characteristic sharp ozone recovery at modest altitude. Ozone soundings at Edmonton and Goose Bay were also examined. These stations are far from polar ice, and would not be subject to Br-induced depletion. While a few soundings indicate surface depletion at these sites during the March–May period, unlike the other sites, there are a large number outside
15
this period. This suggests that these depletion episodes, including those during the March–May period, are actually due to local pollution events (NO titration).
The older BM soundings show a seasonal pattern similar to that for the ECC sound-ings, with the caveat that the Canadian BM sondes were less reliable in the tropo-sphere. Laboratory work has shown that preparation methods employed in the 1960s
20
and 1970s for these instruments tended to produce tropospheric values that were about 15% low on average (Tarasick et al., 2002), while the overall response shows consid-erably more variation than is the case for the ECC sondes. They also appear to have suffered a greater frequency of sonde malfunction. These factors may account for the larger number of soundings indicating surface depletion at Resolute and Churchill
out-25
side of the March–May period in the BM record. Unfortunately there are no older data for Alert or Eureka.
Since depletion episodes can on occasion persist for several days, this may introduce some autocorrelation in the time series, particularly for Eureka and Alert, where sondes
ACPD
2, 339–356, 2002 Surface ozone depletion episodes D. W. Tarasick and J. W. Bottenheim Title Page Abstract Introduction Conclusions References Tables Figures J I J I Back CloseFull Screen / Esc
Print Version Interactive Discussion
c
EGS 2002
are often launched more frequently than once per week. In order to properly estimate the frequency of depletions at Alert and other stations, soundings were grouped by week, over the 13-week period from Julian day 61 through 151 (244 through 334 for the antarctic stations), and the 13 weekly frequencies were averaged to find an overall average for each year. The results of this exercise are shown in Fig. 4.
5
One observation that may be made immediately is that depletion events have been occurring regularly in the Canadian Arctic at least since 1966, when regular ozone soundings began. This is consistent with evidence from other sources that the deple-tions are caused by naturally produced Br (Barrie and Platt, 1997). It is also evident that there is some correlation between the frequency observed at Alert, Eureka and
10
Resolute, for the period of simultaneous records. This is suggestive of a common me-teorological influence, such as the frequency or strength of boundary layer temperature inversions. In addition, despite its high variability, there is an evident increase of the fre-quency of occurrence at Resolute. Over the 35-year period 1966–2000 the linear trend is 0.66 ± 0.59% per year (95% confidence limits). This trend is quite robust: a weighted
15
regression (taking into account the slightly different number of weeks of soundings each year) gives a somewhat larger trend; treating the peak values of 1989–1991 as outliers and either simply omitting them or replacing them with the lower frequencies observed in the same years at Alert produces somewhat smaller trends; in all cases, however, trends are still significant at the 95% level. If only the ECC data (1980–2000)
20
are considered, the linear trend is 1.03 ± 1.51% per year. Churchill and Alert, with shorter records, also show smaller, positive but non-significant trends: 0.14 ± 0.28% and 0.39 ± 2.31% per year.
It is interesting to consider the possible causes of such an increase in the frequency of depletion events. Surface ozone destruction at polar sunrise occurs via the following
25
reactions:
Br+ O3−→ BrO+ O2 (1)
ACPD
2, 339–356, 2002 Surface ozone depletion episodes D. W. Tarasick and J. W. Bottenheim Title Page Abstract Introduction Conclusions References Tables Figures J I J I Back CloseFull Screen / Esc
Print Version Interactive Discussion c EGS 2002 HOBr+ hν −→ OH + Br (3) BrO+ BrO −→ Br2+ O2 (4) Br2+ hν −→ 2Br (5)
Rapid loss of reactive Br to inactive HBr implies that the heterogeneous reaction
HOBr+ Br−+ H+ ice−→ Br2+ H2O (6)
5
on aerosols or surface ice and snow (Fan and Jacob, 1992; Tang and McConnell, 1996) is also necessary to recycle HBr and sustain the observed levels of Br2 and rates of ozone loss. The large amounts of bromine required imply that sea salt bromide is the most likely source, and evidence for Reaction (6) on the arctic snowpack has in fact been reported (Foster et al., 2001; Peterson and Honrath, 2001).
10
Surface meteorological conditions could affect the rates of some of the above pro-cesses in several ways; for example, greater atmospheric stability would lead to less mixing of ozone-rich air from above; temperature or wind changes could lead to more frequent open leads in sea ice and therefore more saline ice crystals laden with bro-mide; other changes could affect the surface area available for Reaction (6).
Un-15
fortunately the available site-specific meteorological data offer little evidence of such changes. We examined temperature inversion strengths (defined as T1000− Ts, the dif-ference between the temperature at 1000 m and that at the surface), surface tempera-tures and surface winds, as well the variability in each, for the March–May period: none of these parameters showed any correlation with the frequency of depletion events at
20
Resolute. Over the 35-year record, only surface temperatures and temperature inver-sion strengths showed any trend. The average strength of temperature inverinver-sions was found to be decreasing, (i.e. implying less atmospheric stability) both at Resolute and Churchill (while increasing dramatically at Alert). This is primarily due to the fact that surface temperatures have increased both at Resolute (0.17 ± 0.08◦C per year) and
25
Churchill (0.22 ± 0.18◦C per year), while decreasing at Alert. While this suggests the possibility that the increases in Fig. 4 are due in some way to surface warming, contrary
ACPD
2, 339–356, 2002 Surface ozone depletion episodes D. W. Tarasick and J. W. Bottenheim Title Page Abstract Introduction Conclusions References Tables Figures J I J I Back CloseFull Screen / Esc
Print Version Interactive Discussion
c
EGS 2002
evidence is found in the average temperature during depletion events (Table 2). This is lower at most stations, implying that depletion events are associated with colder than average surface temperatures. The lack of an observed correlation with meteorological variables does not, of course, rule out the possibility that the increase in frequency of depletion events in Fig. 4 is a real effect, and related to meteorological changes, but
5
it does imply that, if so, other factors are also at play, such as long-range transport of air masses and non-local chemistry. This, of course, is not surprising, as there is con-siderable evidence that long-range transport plays a major role in surface depletions (Bottenheim et al. 1990; Barrie and Platt, 1997).
Table 2 compares the average frequency of depletions over the period 1990–2000
10
for the seven polar stations, as well as average surface temperatures (T ) and average strength of boundary layer temperature inversions (T1000− Ts). It will be evident that the stations divide into two groups. For Alert, Resolute and Eureka, depletion episodes are common, and average springtime surface temperatures are below −20◦C, while for Churchill, Ny- ˚Alesund, Neumayer and Marambio, episodes of surface ozone depletion
15
are infrequent, and average springtime surface temperatures are above −20◦C. Tem-perature inversions are also stronger at the stations in the first group. Average surface temperatures during depletion events are also shown; with the caveat that these have large standard errors due the small number of data points in each average, it is notable that in general they are much colder than the overall seasonal average.
20
The apparent division on the basis of average springtime surface temperatures (above or below −20◦C) is intriguing because the eutectic temperature for an NaCl/H2O mix-ture (and therefore, approximately, for seawater) is about −20◦C. It is conceivable that the critical step in the polar boundary layer ozone depletion mechanism, namely Reac-tion (6), occurs efficiently on solid ice but not in aqueous brine solution. Furthermore
25
we note that −20◦C appears to be a critical temperature for the formation of “frost flow-ers”: fragile, highly saline ice crystals that are a common surface feature of young sea ice (Martin et al., 1996). As these would greatly increase the surface area available for heterogeneous reactions, they may be important in the rapid catalytic cycle of ozone
ACPD
2, 339–356, 2002 Surface ozone depletion episodes D. W. Tarasick and J. W. Bottenheim Title Page Abstract Introduction Conclusions References Tables Figures J I J I Back CloseFull Screen / Esc
Print Version Interactive Discussion c EGS 2002 destruction. 4. Conclusions
An examination of the historical ozonesonde record shows that boundary-layer deple-tion events occur frequently at Alert, Eureka and Resolute in Canada, but infrequently at Churchill, and at other stations in the Arctic and Antarctic. Since all of these stations
5
are close to apparent BrO sources observed by GOME, the difference seems likely to lie in different meteorological conditions. Temperature profiles near polar sunrise at the three Canadian Arctic stations are characterized by strong surface temperature inversions and cold (below −20◦C) surface temperatures. However, little correlation is observed between these temperature conditions and the frequency of occurrence
10
of depletion events, as these may be a result of non-local chemical destruction and transport. The frequency of occurrence of boundary-layer ozone depletion episodes is found to be increasing, particularly at Resolute (the only site with a sufficiently long record for proper trend analysis). As cold (∼ −20◦C) surface temperatures appear to be a necessary condition for the production of depletion episodes, we speculate that this
15
may be because the heterogeneous reaction converting bromide to bromine occurs more rapidly on saline ice crystals than in aqueous brine solution.
Acknowledgements. All data presented here were supplied by the World Ozone and UV Data
Centre in Canada. Some additional data (for Thule, Scoresbysund, Bear Island and
Ny-˚
Alesund) was supplied by the NADIR data centre in Norway. We thank the many observers
20
who obtained these data over many years of careful work. We also thank P. von der Gathen, H. Gernandt, I. S. Mikkelsen, J. Davies and E. Hare for assistance with the data and for helpful suggestions, and J. Abbatt, C. T. McElroy and D. I. Wardle, for comments and discussions.
ACPD
2, 339–356, 2002 Surface ozone depletion episodes D. W. Tarasick and J. W. Bottenheim Title Page Abstract Introduction Conclusions References Tables Figures J I J I Back CloseFull Screen / Esc
Print Version Interactive Discussion
c
EGS 2002
References
Anlauf, K. G., Mickle, R. E., and Trivett, N. B. A.: Measurement of ozone during Polar Sunrise Experiment 1992, J. Geophys. Res., 99, 25 345–25 353, 1994.
Barrie, L. A., Bottenheim, J. W., Schnell, R. C., Crutzen, P. J., and Rasmussen, R. A.: Ozone destruction and photochemical reactions at polar sunrise in the lower Arctic atmosphere,
5
Nature, 334, 138–141, 1988.
Barrie, L. and Platt, U.: Arctic tropospheric chemistry: an overview, Tellus, 49B, 450–454, 1997.
Bottenheim, J. W., Gallant, A. G., and Brice, K. A.: Measurements of NOY species and O3at
82◦N latitude, Geophys. Res. Lett., 13, 113–116., 1986.
10
Bottenheim, J. W., Barrie, L. A., Atlas, E., Heidt, L. E., Niki, H., Rasmussen, R. A., and Shep-son, P. B.: Depletion of lower tropospheric ozone during Arctic spring: the Polar Sunrise Experiment 1988, J. Geophys. Res., 95, 101–127, 1990.
Bottenheim, J. W., Fuentes, J. D., Tarasick, D. W., and Anlauf K. G.: Ozone in the Arctic lower troposphere during winter and spring 2000 (ALERT2000), Atmospheric Environment,
15
ALERT2000 special issue, in press, 2001.
Fan, S-M. and Jacob, D. J.: Surface ozone depletion in Arctic spring sustained by bromine reactions on aerosols, Nature, 359, 522–524, 1992.
Foster, K. L., Plastridge, R. A., Bottenheim, J. A., Shepson, P. B., Finlayson-Pitts, B. J., and
Spicer, C. W.: The role of Br2and BrCl in surface ozone destruction at polar sunrise, Science,
20
291, 471–474, 2001.
Martin, S., Yu, Y., and Drucker, R.: The temperature dependence of frost flower growth on
laboratory sea ice and the effect of the flowers on infrared observations of the surface, J.
Geophys. Res., 101, 12 111–12 125, 1996.
McElroy, C. T., McLinden, C. A., and McConnell, J. C.: Evidence for bromine monoxide in the
25
free troposphere during the Arctic polar sunrise, Nature, 397, 338–340, 1999.
Miller, H. L., Weaver, A., Sanders, R. W., Arpag, K., and Solomon, S.: Measurements of arctic sunrise surface ozone depletion events at Kangerlussuaq, Greenland, Tellus, 49B, 496–509, 1997.
Murayama, S., Nakazawa, T., Tanaka, M., Aoki, S., and Kawaguchi, S.: Variations of
tropo-30
spheric ozone concentration over Syowa station, Antarctica, Tellus, 44B, 262–272, 1992. Oltmans, S. J. and Komhyr, W. D.: Surface ozone distributions and variations from 1973–
ACPD
2, 339–356, 2002 Surface ozone depletion episodes D. W. Tarasick and J. W. Bottenheim Title Page Abstract Introduction Conclusions References Tables Figures J I J I Back CloseFull Screen / Esc
Print Version Interactive Discussion
c
EGS 2002
1984 measurements at the NOAA Geophysical Monitoring For Climatic Change baseline observatories, J. Geophys. Res., 91, 5229–5236, 1986.
Peterson, M. C. and Honrath, R. E.: Observations of rapid photochemical destruction of ozone in snowpack interstitial air, Geophys. Res. Lett., 28, 511–514, 2001.
Rasmussen, A., Kiilsholm, S., Havskov Sørensen, J., and Steen Mikkelsen, I.: Analysis of
5
tropospheric ozone measurements in Greenland, Tellus, 49B, 510–521, 1997.
Richter, A., Wittrock, F., Eisinger, M., and Burrows, J. P.: GOME observations of tropospheric BrO in northern hemispheric spring and summer 1997, Geophys. Res. Lett., 25, 2863–2686, 1998.
Solberg, S., Schmidtbauer, N., Semb, A., and Stordal, F.: Boundary-layer ozone depletion as
10
seen in the Norwegian Arctic in spring, J. Atmos. Chem., 23, 301–332, 1996.
Taalas, P., Kyr ¨o, E., Supperi, A., Tafuri, V., and Ginzburg, M.: Vertical distribution of tropospheric ozone in Antarctica and in the European Arctic, Tellus, 45B, 106–109, 1993.
Tang, T. and McConnell, J. C.: Autocatalytic release of bromine from arctic snow pack during polar sunrise, Geophys. Res. Lett., 23, 2633–2636, 1996.
15
Tarasick, D. W., Kerr, J. B., Wardle, D. I., Bellefleur, J. J., and Davies, J.: Tropospheric ozone trends over Canada: 1980–1993. Geophys. Res. Lett., 22, 409–412, 1995.
Tarasick, D. W., Davies, J., Anlauf, K., Watt, M., Steinbrecht, W., and Claude, H. J.: Laboratory investigations of the response of Brewer-Mast sondes to tropospheric ozone, J. Geophys. Res., in press, 2002.
20
Wagner, T. and Platt, U.: Satellite mapping of enhanced BrO concentrations in the troposphere, Nature, 395, 486–490, 1998.
Wessel, S., Aoki, S., Winkler, P., Weller, R., Herber, A., Gernandt, H., and Schrems, O.: Tro-pospheric ozone depletion in polar regions: A comparison of observations in the Arctic and Antarctic, Tellus, 50B, 34–50, 1998.
ACPD
2, 339–356, 2002 Surface ozone depletion episodes D. W. Tarasick and J. W. Bottenheim Title Page Abstract Introduction Conclusions References Tables Figures J I J I Back CloseFull Screen / Esc
Print Version Interactive Discussion
c
EGS 2002
Table 1. Number of soundings indicating surface depletion events in the historical ozonesonde
record, grouped by season. The number in brackets is the total number of soundings in each period. Data up to the end of 2000 have been included. Canadian data are shown separately for the pre-1980 (BM) period and for the last two decades (ECC)
Station ECC Brewer-Mast
DJF MAM JJA SON DJF MAM JJA SON
Alert 0 (250) 64 (207) 5 (146) 1 (150) – – – – Resolute 6 (246) 61 (225) 7 (190) 3 (189) 1 (142) 22 (166) 9 (150) 1 (141) Eureka 1 (264) 28 (139) 1 (96) 0 (105) – – – – Churchill 2 (222) 8 (240) 3 (218) 1 (194) 1 (62) 1 (57) 12 (69) 5 (62) Goose Bay 2 (237) 2 (239) 19 (226) 20 (221) 4 (134) 1 (117) 16 (123) 15 (122) Edmonton 24 (222) 6 (239) 9 (225) 15 (203) 7 (86) 1 (83) 2 (81) 4 (82) Ny- ˚Alesund 0 (370) 11 (305) 1 (136) 0 (149) – – – – Neumayer 7 (163) 1 (126) 1 (170) 7 (246) – – – – Marambio 5 (45) 0 (23) 1 (92) 5 (156) – – – –
ACPD
2, 339–356, 2002 Surface ozone depletion episodes D. W. Tarasick and J. W. Bottenheim Title Page Abstract Introduction Conclusions References Tables Figures J I J I Back CloseFull Screen / Esc
Print Version Interactive Discussion
c
EGS 2002
Table 2. Column 2: Average frequency of occurrence of surface ozone depletion events at polar
stations over the period 1990–2000. Column 3: Average surface temperatures (T ). Column 4:
Average surface temperatures (T ) during depletion episodes. Column 5: Difference between
surface temperature and that at 1000 m (T1000− Ts). Data have been adjusted for the effects of
occasional irregular sampling
Station Adjusted frequency (%) T (◦C) TDE (◦C) T1000− Ts (
◦ C) Alert 29.1 −21.9 −19.6 3.9 Resolute 26.4 −21.9 −23.5 4.0 Eureka 26.4 −24.3 −24.4 6.4 Churchill 3.4 −11.5 −17.1 3.0 Ny− ˚Alesund 2.9 −7.8 −9.9 −3.8 Neumayer 2.8 −17.4 −18.8 1.3 Marambio 2.9 −6.3 −9.2 −2.8
ACPD
2, 339–356, 2002 Surface ozone depletion episodes D. W. Tarasick and J. W. Bottenheim Title Page Abstract Introduction Conclusions References Tables Figures J I J I Back CloseFull Screen / Esc
Print Version Interactive Discussion c EGS 2002 Eureka Potential Temperature (K) 250 260 270 Figure 1a Ozone Concentration (ppb) 0 10 20 30 40 50 Z (m) 0 100 200 300 400 500 600 700 800 900 1000 1100 1200 1300 1400 1500 5/ 4/2000 10/ 5/2000 Resolute Ozone Concentration (ppb) 0 10 20 30 40 50 Z (m) 0 100 200 300 400 500 600 700 800 900 1000 1100 1200 1300 1400 1500 21/3/2000 14/4/2000 19/4/2000 4/5/2000 Potential Temperature (K) 250 260 270 Figure 1b Ozone Concentration (ppb) 0 10 20 30 40 50 60 Z (m) 0 100 200 300 400 500 600 700 800 900 1000 1100 1200 1300 1400 1500 14/5/2000 15/5/2000 Potential Temperature (K) 260 270 280 Churchill Figure 1c
Fig. 1. (a) Recent surface ozone depletion events at Eureka, Canada, from regular ozone
soundings. (b) Recent surface ozone depletion events at Resolute, Canada. (c) Recent
(par-tial) surface depletion events at Churchill, Canada. Note that in most cases the depleted layer is capped by an inversion layer (layer of strongly positive potential temperature gradient, shown on the right of the figure).
ACPD
2, 339–356, 2002 Surface ozone depletion episodes D. W. Tarasick and J. W. Bottenheim Title Page Abstract Introduction Conclusions References Tables Figures J I J I Back CloseFull Screen / Esc
Print Version Interactive Discussion c EGS 2002 Eureka Potential Temperature (K) 250 260 270 Figure 2a Ozone Concentration (ppb) 0 10 20 30 40 50 Z (m) 0 100 200 300 400 500 600 700 800 900 1000 1100 1200 1300 1400 1500 5/ 4/2000 10/ 5/2000 Resolute Ozone Concentration (ppb) 0 10 20 30 40 50 Z (m) 0 100 200 300 400 500 600 700 800 900 1000 1100 1200 1300 1400 1500 21/3/2000 14/4/2000 19/4/2000 4/5/2000 Potential Temperature (K) 250 260 270 Figure 2b Ozone Concentration (ppb) 0 10 20 30 40 50 60 Z (m) 0 100 200 300 400 500 600 700 800 900 1000 1100 1200 1300 1400 1500 14/5/2000 15/5/2000 Potential Temperature (K) 260 270 280 Churchill Figure 2c
Fig. 2. (a) As Fig. 1a, in old (compressed) data format. (b) As Fig. 1b, in old (compressed)
data format. (c) As Fig. 1c, in old (compressed) data format. Although the nominal resolution
of the profiles is less than that of Fig. 1, the effective resolution is clearly adequate to identify
both the degree of depletion and the vertical extent of the depleted layer and the accompanying temperature inversion.
ACPD
2, 339–356, 2002 Surface ozone depletion episodes D. W. Tarasick and J. W. Bottenheim Title Page Abstract Introduction Conclusions References Tables Figures J I J I Back CloseFull Screen / Esc
Print Version Interactive Discussion c EGS 2002 Ozone Concentration (ppb) 0 10 20 30 40 50 60 Z (m) 0 200 400 600 800 1000 1200 1400 1600 1800 2000 2200 2400 2600 2800 3000 Potential Temperature (K) 260 270 280 Resolute Figure 3 21/05/1969
Fig. 3. A surface ozone depletion event at Resolute: 21 May 1969. Despite the poorer quality
ACPD
2, 339–356, 2002 Surface ozone depletion episodes D. W. Tarasick and J. W. Bottenheim Title Page Abstract Introduction Conclusions References Tables Figures J I J I Back CloseFull Screen / Esc
Print Version Interactive Discussion c EGS 2002
Year
1970 1975 1980 1985 1990 1995 2000Frequen
c
y
o
f o
c
c
u
rr
e
n
c
e
(%
)
0 10 20 30 40 50 60 70 80 Resolute Churchill Alert Eureka Marambio Neumayer Ny-Aalesund Figure 4Fig. 4. Frequency of occurrence of surface ozone depletion events at selected ozonesonde