HAL Id: hal-01293011
https://hal.sorbonne-universite.fr/hal-01293011
Submitted on 24 Mar 2016HAL is a multi-disciplinary open access archive for the deposit and dissemination of sci-entific research documents, whether they are pub-lished or not. The documents may come from teaching and research institutions in France or abroad, or from public or private research centers.
L’archive ouverte pluridisciplinaire HAL, est destinée au dépôt et à la diffusion de documents scientifiques de niveau recherche, publiés ou non, émanant des établissements d’enseignement et de recherche français ou étrangers, des laboratoires publics ou privés.
vasomotion of paws and tail in the rat: implication for
pain studies
Nabil El Bitar, Bernard Pollin, Gan Huang, André Mouraux, Daniel Le Bars
To cite this version:
Nabil El Bitar, Bernard Pollin, Gan Huang, André Mouraux, Daniel Le Bars. The rostral ventro-medial medulla control of cutaneous vasomotion of paws and tail in the rat: implication for pain studies. Journal of Neurophysiology, American Physiological Society, 2016, 115 (2), pp.773-789. �10.1152/jn.00695.2015�. �hal-01293011�
1 2 3
The rostral ventro-medial medulla (RVM) control of
4
cutaneous vasomotion of paws and tail in the rat. Implication for pain studies.
5 6 7
Nabil El Bitar1,2,*, Bernard Pollin1,2*, Gan Huang3, André Mouraux3, Daniel Le Bars1,2,†
8 9
This paper is dedicated to our colleague and friend Bernard Pollin, who passed away while our work was 10
under redaction and whose contributions to this work were invaluable. 11
12 13 14 15
1 Sorbonne Universités, Université Pierre et Marie Curie, Faculté de Médecine Paris, France. 16
2 Neurosciences Paris-Seine, Institut National de la Santé et de la Recherche Médicale UMRS-1130, Centre 17
National de la Recherche Scientifique UMR-8246, Paris, France. 18
3 Institute of Neuroscience, Université Catholique de Louvain, Brussels, Belgium 19
* These authors contributed equally to this work. 20
† To whom correspondence should be addressed. E-mail: daniel.le_bars@upmc.fr
21 22 23 24 25 Number of pages: 44 26
Number of figures and tables: 10 figures, 3 tables
27
Number of words: Abstract, 249; Introduction, 781; Discussion, 3438.
28
Supplemental material: 1 video
29 30
Running head: RVM control of cutaneous vasomotion
31 32
Key words: rat, thermoregulation, ambient temperature, skin temperature, environmental impact, blood
33
pressure, heart rate, infrared camera, rostral ventro-medial medulla, RVM, rostral Medullary Raphe, rMR. 34
ABSTRACT
36
Thermal neutrality in rodents is achieved by large cyclic variations of the sympathetic drive of the 37
vasomotion of the tail and paws, the most widely used target organs in current acute or chronic animal 38
models of pain. Given the pivotal functional role of rostral ventro-medial medulla (RVM) in nociception and 39
rostral Medullary Raphe (rMR) in thermoregulation, two largely overlapping brain regions, we aimed at 40
circumscribing the brainstem regions that are the source of premotor afferents to sympathetic preganglionic 41
neurons that control the vasomotor tone of the tail and hind-paws. A thermometric infrared camera recorded 42
indirectly the vasomotor tone of the tail and hind-paws. During the control period, the rat was maintained in 43
vasoconstriction by preserving a stable, homogeneous and constant surrounding temperature, slightly below 44
the core temperature. The functional blockade of the RVM/rMR by the GABAA receptor agonist muscimol
45
(0.5 nmol, 50 nl) elicited an extensive increase of the temperature of the paws and tail, associated to slight 46
decrease of blood pressure and heart rate. Both the increased heat loss through vasodilatation and the 47
decrease heart-induced heat production elicited a remarkable reduction of the central temperature. The 48
effective zones were circumscribed to the parts of the RVM/rMR facing the facial nucleus. They match very 49
exactly the brain regions often described as specifically devoted to the control of nociception. Our data 50
support and urge on the highest cautiousness regarding the interpretation of results aimed at studying the 51
effects of any pharmacological manipulations of RVM/rMR with the usual tests of pain. 52
INTRODUCTION
54
Numerous studies have explored the descending systems that control the spinal transmission of 55
nociceptive messages, notably through the Rostral Ventromedial Medulla (RVM) in the brainstem. The 56
RVM includes the nucleus raphe magnus and the neighboring part of the reticular formation, which extends 57
under the gigantocellular reticular nucleus (Fields et al. 2006). Two main categories of neurons, so-called 58
"on-" and "off-" cells, were highlighted that: (1) exhibit irregular spontaneous activities in opposition of 59
phase (Barbaro et al. 1989) and (2) are activated and inhibited by nociceptive stimuli, respectively (Fields et 60
al. 1983; Vanegas et al. 1984). These two neuronal types were proposed to belong to a double spino-bulbo-61
spinal positive feedback loop that facilitates the spinal transmission of nociceptive messages, either directly 62
or through a mechanism of disinhibition, the "on-" and "off-" cells being supposed to produce an excitatory 63
and an inhibitory drive on the spinal neurons, respectively. 64
However, RVM neurons could play a much less specific role than that of a descending pathway 65
modulating nociception at spinal level (Le Bars et al. 2001; Lefler et al. 2008; Lovick 1997; Mason 2001; 66
2005a; 2005b; 2006; 2011; 2012; Thurston and Helton 1996; Thurston and Randich 1992; 1995). For 67
example, we described recently the probable involvement of "on-" and "off-" cells in autonomic regulation, 68
notably thermoregulation (El Bitar et al. 2014b). 69
On the basis of three animal models used in thermoregulation studies, namely the tail of the rat, the 70
ear of the rabbit and the interscapular brown adipose tissue (BAT) of the rat, it became apparent that neurons 71
in the midline region of the ventral medulla play a critical role in responding to cold (Blessing et al. 1999; 72
McAllen et al. 2010, Morrison 1999, 2011; Morrison et al. 1999, 2008, 2012; Nakamura 2011; Nakamura 73
and Morrison 2008, 2011; Rathner et al. 2001; Rathner and McAllen 1999; Tanaka et al. 2002). Broadly, 74
cooling the animal results in (1) reduced heat loss through increased skin vasoconstriction of the ear in the 75
rabbit or the tail in the rat and (2) increased heat production by BAT in the rat. These phenomena are 76
triggered by activation of sympathetic preganglionic neurons in the spinal intermediolateral cell column, 77
themselves under the control of premotor neurons located in the rostral Medullary Raphe (rMR), a region 78
immediately rostral to the rostral pole of the inferior olivary complex, that includes the raphe pallidus, the 79
raphe magnus and the laterally extending parapyramidal nucleus (Blessing 2003; McAllen et al. 2010; 80
Morrison 2011; Nakamura 2011; Nakamura and Morrison 2008, 2011), where the expression of Fos 81
immunoreactivity is increased following cold exposure (Bonaz and Taché 1994; Cano et al. 2003; Morrison 82
et al. 1999; Nakamura et al., 2004). 83
Yet a possible discrepancy was noted. Studies focusing on the descending systems postulated to 84
control nociception emphasize a region which includes the nucleus raphe magnus and the gigantocellular 85
reticular nucleus pars alpha, mainly at the level of the facial nucleus (e.g. Brink et al. 2006; Carlson et al. 86
2007; Fields et al. 1995; Heinricher and Kaplan 1991; Heinricher and Tortorici 1994; Kaplan and Fields 87
1991; Morgan and Fields, 1994; Neubert et al. 2004; Vanegas et al. 1984; Thurston and Helton, 1996; 88
Thurston and Randich, 1995; Xu et al. 2007), while studies focusing on thermoregulation emphasize a 89
slightly more caudal region including the raphe pallidus (e.g. Blessing and Nalivaiko, 2001; Cao and 90
Morrison 2003; Cao et al. 2004, 2010; Cerri et al. 2010; Fan et al. 2007; Madden and Morrison 2003, 2005; 91
Morrison 1999, 2003, 2004; Morrison et al. 1999, 2000; Nakamura and Morrison 2007, 2011; Nakamura et 92
al. 2004; Ootsuka and McAllen 2005; Rathner et al. 2001, 2008; Salo et al. 2009; Tanaka et al. 2002, 2007; 93
Yoshida et al. 2003). 94
The aim of the present study was therefore to map exactly the brainstem regions that contain the 95
premotor sympathetic neurons controling the vasomotor tone of the tail and hind-paws of the rat, and to 96
compare these locations with that of nociception-related brainstem areas. This choice was made specifically 97
because many behavioral models of pain/nociception are based on the assessment of the response of a rodent 98
to a thermal stimulus applied to the tail or a hind-paw (reviewed in Le Bars et al. 2001, 2009). 99
Specifically, we measured in 160 adult male Sprague-Dawley rats, the dynamic changes in 100
vasomotor tone induced by microinjections of muscimol within these regions. During the injection, the rats 101
were maintained in a stable state of tail and hind-paw vasoconstriction. Microinjection of muscimol within 102
the RVM/rMR was expected to elicit vasodilation of the tail and hind-paw. When a vasomotor response was 103
present, the latency at which vasodilation occurred was used as an index of the distance between the 104
injection site and the structure generating the response. 105 106 GLOSSARY 107 108 7 Facial nucleus
α Slope of the squared temperature variation elicited by a radiant heat source (°C2/s)
BAT Brown adipose tissue
bpm Beats per minute
ΔTskin Amplitude of the skin temperature variation (°C)
Δt Duration of the ascending phases of vasodilatation (= tmax - tmin) ETCO2 End-tidal CO2
GiA Gigantocellular reticular nucleus pars alpha
HLI Heat Loss Index
HR Mean heart rate (bpm)
LPGi lateral paragigantocellular nucleus. MAP Mean arterial blood pressure (mmHg)
ml Medial lemniscus
paw-contra Mid-plantar area on the hind-paw, contralateral to the injection site paw-ipsi Mid-plantar area on the hind-paw, ipsilateral to the injection site
PPy Parapyramidal nucleus
py Pyramidal tract
RMg Raphe magnus nucleus
rMR Rostral Medullary Raphe
ROI Region of interest RVM Rostral Ventro-medial Medulla RVM/rMR Combination of RVM and rMR s spread of the sigmoid curve
tmin Beginning time of the ascending phase of vasodilatation (min) tmax End time of the ascending phase of vasodilatation (min) tx Abscissa of the inflection point of Boltzmann sigmoid (min) Tadj Sigmoid Boltzmann curve adjusted to the recorded temperature
Tamb Ambient temperature (°C)
Tcore Core body temperature (°C)
Tmax Adjusted maximal skin temperature at the end of the process of vasodilatation (°C) Tmin Adjusted skin temperature during the control period (°C)
Tpaw-contra Temperature of the plantar aspect of the hind-paw, contralateral to the injection site (°C) Tpaw-ipsi Temperature of the plantar aspect of the hind-paw, ipsilateral to the injection site (°C) Tskin Temperature of the skin (°C)
Ttail-dist Temperature of the distal part of the tail (°C) Ttail-mid Temperature of the mid part of the tail (°C) Ttail-prox Temperature of the proximal part of the tail (°C)
Tx Ordinate of the inflection point of Boltzmann sigmoid (°C) tail-dist Distal area of the tail, located at 3 cm from the tip tail-mid Intermediate area of the tail, located at mid-tail
tail-prox Proximal area of the tail, located at 3 cm from the root of the tail TFL Tail-flick latency (s)
Ttail-mid Temperature of the mid part of the tail (°C) Ttail-prox Temperature of the proximal part of the tail (°C)
Twarm Warming temperature (°C)
x latero-lateral coordinate with reference to the interaural line y ventro-dorsal coordinate with reference to the interaural line z rostro-caudal coordinate with reference to the interaural line 109
METHODS
110 111
Ethic statement
112
Animal experiments were performed with permission of the Board of the Veterinarian Services of 113
the French Ministry of Agriculture (permit number 75-151) in accordance with the National Institute of 114
Health's “Guide for the care and use of Laboratory animals”, the European Communities Council Directive 115
86/609/EEC regulating animal research, and the ethics committee of the International Association for the 116
Study of Pain (Covino et al. 1980; Zimmermann 1983). The Committee of Ethics for the Animal Experiment 117
of our Institution approved the procedures. 118
119
Animals
120
Experiments were performed on 160 adult male Sprague-Dawley rats (Janvier Labs, Saint-Berthevin, 121
France) weighing 320-370 g. They were housed in groups of 3-4 per cage, allowed free access to food and 122
water with a 12 h alternating light-dark cycle, and acclimatized to the laboratory for at least one week before 123
the experiment. The experiments were conducted between 9 AM and 5 PM. 124
125
Experimental procedure
126
The animals were deeply anesthetized with 2.5% halothane in 100% oxygen. A tracheal cannula was 127
inserted and the ventilation was controlled mechanically with an open circuit respirator equipped with a 128
scavenging system, at a rate of 50 breaths/min. The tidal volume was adjusted to maintain a normal end-tidal 129
CO2 (ETCO2). The expiratory halothane level and ETCO2 were assessed with a capnometer (Capnomac II,
130
Datex Instruments, Helsinki, Finland), recorded each ten seconds and under control of alarms throughout the 131
experiment. The mean arterial blood pressure (MAP) and heart rate (HR) were monitored continuously via a 132
catheter inserted into the common carotid artery and connected to a computer via a transducer. MAP and HR 133
were calculated and recorded using the NOTOCORD® blood pressure analyzer system.
134
The body of the animal was wrapped up in a water-warming pad connected to an extra-capacity 135
water circulator (TP 220-Kent, scientific corporation) sparing the head, the paws and the tail. The heating 136
blanket was covered with an isothermic metalized polyester film (“survival blanket”) to stabilize the space 137
temperature around the body. A two channel OMEGA® HH506RA digital thermometer and two
VIP-T-138
CT25515 Probes (0.1°C resolution) were used to measure the core temperature Tcore (throughout a rectal
139
probe inserted 10 cm) and the heating temperature Twarm (probe placed between the warming pad and the
140
trunk of the rat). We adjusted Twarm in order to maintain (1) Tcore stable within normal physiological values
141
and (2) the tail and hind-paws in vasoconstriction. 142
The rat was mounted on a Horsley-Clarke stereotaxic frame. 0.5 ml of xylocaine 2% was injected 143
subcutaneously in the scalp, followed by a 2-cm midline incision. After trepanation, a small incision of the 144
dura-mater was made to introduce the tip of a microinjection glass needle. 145
After surgery, halothane was decreased to 0.8-0.9% with oxygen being kept at 100%, the tidal 146
volume was adjusted to keep the ETCO2 around 3.5% and at least 30-min were waited before starting the
experimental procedure. After 15-min of control period in steady vasoconstriction, 57 ng (50 nl) muscimol 148
were injected in the RVM/rMR (target zone between -0.8 and -3.3 rostral to inter-aural line) over 60-149
seconds. Since RVM and rMR largely overlap, we will refer to “RVM/rMR” for brain regions that include 150
the raphe pallidus, raphe magnus, parapyramidal nucleus and the reticular formation that extends under the 151
gigantocellular reticular nucleus (Mason 2001, 2005a, 2005b, 2006, 2011). Control experiments were 152
conducted with the same procedure, except that muscimol was injected outside the RVM/rMR. 153
154
Experimental conditions
155
The experiments were made in anesthetized rat with unremitting halothane level [0.85 (0.83-156
0.86)%], while ventilation was controlled in order to achieve a stable and normal acid-base equilibrium 157
during the control period ETCO2 = 3.65 (3.57-3.73)%. The mean room temperature Tamb was stable at 24.2
158
(24.1-24.4)°C. The paws and tail of the rat were maintained in vasoconstriction during the control period by 159
preserving a stable, homogeneous and constant surrounding temperature [Twarm = 37.4 (37.2-37.5)°C], ≈
160
0.3°C below Tcore [37.7 (37.6-37.8)°C], and kept constant till the end of the experiment. In the control period,
161
MAP and HR were 83.9 (77.4-90.4) mmHg and 321 (309-332) bpm, respectively. 162
163
Muscimol preparation
164
We prepared muscimol solution in a concentration of 0.01 nmol/nl, added pontamine sky blue to 165
identify the site of injection, fractioned the solution in 2 µl aliquots for single use and preserved them at -166
20°C. Muscimol produces a rapid and persistent hyperpolarization of neurons (Hikosaka and Wurtz 1985; 167
Martin and Ghez 1999) based on its high affinity and selectivity for the GABAA receptor (Beaumont et al.
168
1978; Enna and Snyder 1975; Gallagher et al. 1983; Krogsgaard-Larsen et al. 1977; Nicholson et al. 1979). 169
The day of the experiment, we filled the circuit of the glass needle with paraffin to wash out air bubbles, 170
aspirated 0.5 µl of muscimol solution at the tip of the needle using a 1-µl Hamilton syringe and introduced 171
the needle in the brain at the end of the surgery.. 172
173
Thermographic recordings
174
Under stable environmental temperature, skin temperature is a reliable indicator of skin blood flow 175
variations (El Bitar et al. 2014a, Hertzman 1953). Heat transmission from deeper tissue to the skin occurs by 176
conduction and vascular convection, and then heat dissipation to the environment through conduction, 177
convection, evaporation and radiation processes. The spatial and temporal evolution of the skin temperature 178
at the level of the tail and paws was monitored using a JADE MWIR (3-5 µm optical bandpass) camera 179
(CEDIP Infrared Systems, Croissy-Beaubourg, France) with a 500 µs integration time, which supplied 180
images of 320x240 pixels at 1 Hz with a sensitivity of 0.02°C at 25°C. The camera was placed 1.5 m upright 181
to the scene and was controlled by the software Cirrus© (CEDIP Infrared Systems, Croissy-Beaubourg,
182
France). It was calibrated by means of a black body as previously described (Benoist et al. 2008). 183
Recently, we verified the highly significant positive linear correlation between skin temperature and 184
skin blood flow measured by a laser-Doppler probe. The mean time lag between vasodilatation and skin 185
temperature increase was estimated at around half a minute (El Bitar et al. 2014a). Such an approach based 186
on thermal imaging has the advantage of giving accurate measures of temperature at both temporal and 187
spatial levels. 188
Analysis of the thermographic films was made using the software Altair© (CEDIP Infrared
189
Systems, Croissy-Beaubourg, France). Ten regions of interest (ROI) were defined in the recorded scene, 190
each comprising 10 pixels. Five ROIs were located on the dorsal aspect of the tail. A proximal ROI (tail-191
prox) was placed 3 cm from the root of the tail, an intermediate ROI (tail-mid) was placed at the middle of 192
the tail, and a distal ROI (tail-distal) was placed 3 cm from the tip of the tail. The remaining two zones were 193
distributed equidistantly between tail-prox and tail-mid and tail-mid and tail-dist. Two additional ROIs were 194
located on the plantar aspect of each hind paw; their final designation was defined respective to the side of 195
muscimol microinjection, ipsilateral (paw-ipsi) or contralateral (paw-contra), as determined following 196
histological controls. Finally, a ROI was located over a piece of wood placed in the scene to monitor the 197
ambient temperature (Tambient). For each time point, the mean of the ten pixels defining each ROI was
198
computed to obtain one single temperature time course for each ROI (Ttail-prox, Ttail-mid, Ttail-dist, Tpaw-left, T
paw-199
right and Tambient).
200 201
Histological identification of microinjection sites
202
At the conclusion of the experiment, the rat was deeply anesthetized with 3% halothane and the brain 203
was perfused through the heart with 0.9% NaCl, followed by 10% formaldehyde and removed. The brain 204
was frozen, cut in serial 100-µm thick sections and Nissl-stained with cresyl violet or carmin. Sites of 205
microinjections were determined from microscopic visualization of the serial sections and reported on 206
schemas of frontal sections of the brain (Paxinos and Watson 2005). Coordinates were then expressed 207
relative to the interaural line: x-axis = latero-lateral; y-axis = ventro-dorsal; z-axis = rostro-caudal. The 208
center of injection was easy to delimit. On average ~1 hour post injection, the overall rostro-caudal diffusion 209
of pontamine blue was 1.1 mm (1.0-1.2 mm), and two times larger than diffusion in the coronal plane. 210
211
Assessing the dynamic effects of muscimol on skin temperature
212
The skin temperature evolution following muscimol microinjection matched a sigmoid curve. The 213
curves were adjusted to a Boltzmann sigmoid according to the equation Tadj = Tmin + ΔTskin/{1 + exp[-(t -
214
tx)/s]}, using the SigmaPlot© software. Time t = 0 corresponded to the end of the microinjection (Fig. 1A).
215
The following parameters were fitted to the data: Tmin (adjusted skin temperature during the control period),
216
Tmax (adjusted maximal skin temperature at the end of the process), ΔTskin = Tmax - Tmin (amplitude of the skin
217
temperature variation), tₓ (abscissa of the inflection point of the sigmoid), Tₓ (ordinate of the inflection point 218
of the sigmoid), s = spread of the sigmoid curve. These parameters were calculated for the proximal and 219
distal parts of the tail, and for each hind-paw. The regression coefficients R² of the adjusted curves were 220
always highly significant (> 0.98). 221
The regulation of the laboratory air-conditioning system was a source of change of ambient 222
temperature in the ∼ 0.5°C range. This represented ∼10% of the magnitude of the ascending phase of 223
muscimol-induced increases in skin temperature at the hind-paws and distal part of the tail and ∼15% of the 224
increases in skin temperature at the proximal tail. Therefore, the beginning (tmin) of the ascending phase of
225
vasodilatation at the hind-paws and distal part of the tail was calculated by considering the 10% percentile of 226
ΔTskin: tmin = tₓ - S*Ln(1/0.1-1) (Fig. 1B). A slightly different cutoff (15%) was chosen to estimate the onset
227
of vasodilation at the proximal part of the tail, because of the slower evolution of the process at that location. 228
The end (tmax) of the ascending phase of vasodilatation was calculated by considering the 90% percentiles of
229
ΔTskin: tmax = tₓ - S*Ln(1/0.9-1).
230
Then, the latency of the vasomotor reactions were divided into three groups according to the 231
distribution of the beginning time tmin of the ascending phase of vasodilatation: tmin < 7.5 min, 7.5 < tmin < 15
232
min and tmin > 15 min. This categorization was justified by the clear bimodal distribution of tmin, centered on
233
3-5 and 10-12 min, respectively (Fig. 1C). Beyond 15 min, the distribution of tmin was flat, and the observed
234
effects if any were interpreted as resulting from uncontrolled diffusion of muscimol (Edeline et al. 2002). 235
Together with a small volume of injection (50 nl) and a large number of negative sites of injection, this 236
approach provided an acute delineation of the structures controling sympathetic cutaneous vasoconstrictor 237
activity. 238
239
Three-dimensional mapping of response latencies
240
The large number of microinjection sites provided the opportunity of building a three-dimensional 241
mapping of response latencies as a function of injection site, using interpolation. The interpolation was 242
performed by computing an average of the responses obtained at all injection sites, weighted by the distance 243
between the interpolated voxel and each injection site. This ensured that the interpolated values were most 244
dependent on the responses of the nearest injection sites. In addition, because of the non-homogeneous 245
sampling of the interpolated volume, a mask was used to exclude voxels that were not close to at least one 246
injection point. 247
For each measurement location (left paw, right paw, proximal tail, distal tail), a 3D volume 248
representing response latencies as a function of injection site was obtained using interpolation. The responses 249
obtained from the left and right paw were merged, by expressing the location of the injection site as 250
ipsilateral (positive x-axis) vs. contralateral (negative x-axis) relative to the paw. The interpolated 3D 251
volume extended from -2 mm to +2 mm along the x-axis, -1.5 mm to +1 mm along the y axis, and -1 mm to 252
+3.5 mm along the z-axis (200 points along each dimension). For each voxel of the volume, an interpolated 253
latency was obtained by computing a weighted average of all latency values: 254
latency( , , ) =∑ latency 255
The weight assigned for each latency value ( ) was determined by the distance between the voxel 256
( , , ) and the injection site ( , , ): 257
= 1
This weight is inversely proportional to the sixth power of the distance. This ensured that at any 258
given location of the interpolated volume, interpolated latencies were more dependent on the latencies of the 259
nearest injection site. Because the 3D volume was not homogeneously sampled (i.e. injection sites were 260
clustered in some regions of the volume), a mask was used to exclude voxels, which were not located at a 261
distance < 0.5 mm of at least one injection point. Finally, because injection at a large amount of sites did not 262
elicit any response, a second mask was computed to distinguish voxels located in regions where injection 263
elicited a response from voxels located in regions where injection did not elicit a response after 55 min of 264
recording. After assigning a latency of 55 min to these trials, the second mask was computed by taking all 265
voxels of the interpolated volume having interpolated latencies above an arbitrary interpolated latency value 266
of 53.5 min. 267
268
Heat loss Index
269
The skin is an interface between core temperature (Tcore) and ambient temperature, (Tamb) acting as a
270
radiator. In addition to active changes secondary to vasomotor tone of skin vessels, the temperature T of the 271
skin can be affected passively by either Tamb or Tcore). To cancel out these passive changes, we computed the
272
Heat Loss Index (HLI) = (Tskin - Tamb)/(Tcore - Tamb) as initially proposed by Székely (1986). The value of HLI
273
can vary between 0 and 1, representing complete vasoconstriction (T = Tamb) and complete vasodilatation (T
274
= Tcore), respectively (Gordon et al. 2002; Romanovsky et al. 2002).
275 276
Analysis of vital signs
277
To study the systemic effects of muscimol on MAP, HR, ETCO2 and Tcore with respect to the
278
microinjection sites, we divided the experiments in three groups on the basis of the beginning time tmin of the
279
ascending phase of vasodilatation. Group 1: (1) tmin < 15 min for all considered skin areas either on the tail or
280
the paws. Group 2: tmin < 15 min for at least one but not all the areas considered on the tail or the hind-paws.
281
Group 3: tmin > 15 min for all considered skin areas either on the tail or the paws. The mean of each variable
282
during the control period was considered as the reference level, and the temporal evolution was calculated in 283
terms of variation of this level, namely Tcore (Δ°C), MAP (ΔmmHg), HR (Δ°C) and ETCO2 (Δ%).
284 285
Data processing and statistical analyses
286
The temporal evolution of the mean skin temperature, MAP and HR were synchronized and 287
measured with a second-time resolution. The corresponding time courses were downsampled to a one-288
minute time resolution by averaging. Data were expressed as means (± confident interval 95%). The 289
comparisons were done using the Mann Whitney U test and the Friedman repeated measures ANOVA on 290
ranks test. 291
RESULTS
293 294
The paws and tail of the rat were successfully maintained in vasoconstriction during the control 295
period by preserving a stable, homogeneous and constant surrounding temperature Twarm, adjusted to a few 296
tenths degrees below Tcor, and by keeping this temperature constant throughout the experiment. Following a
297
15-min period of control in steady vasoconstriction, muscimol (0.5 nmol, 50 nl) was injected over 60-298
seconds. 299
We will first describe in details a typical recording. Then the effects of muscimol will be detailed 300
with reference to the injection sites determined post-mortem. Emphasis will be made on the comparison 301
between hind-paws (ipsilateral vs. contralateral to the injection site). We seized the opportunity of the large 302
number of microinjection sites to build three-dimensional mappings of response latencies as a function of 303
injection site, using interpolation. Results will also be synthesized by taking into account concomitant 304
variations of MAP, HR and Tcore. Finally, the potential effect of muscimol on a widely used nociceptive test,
305
the tail-flick test, will be assessed by using the present results to compute expected variations in tail-flick 306
latency elicited by the effects of muscimol on both tail temperature and Tcore.
307 308
A typical example of the effects of muscimol microinjection within the RVM/rMR
309 310
An example of a thermographic film is provided as supporting information (Supporting video), from 311
which a series of seven images recorded during 30-min are shown in figure 2A. These images correspond to 312
a typical example of a microinjection centered to the RMg, as determined following histological examination 313
(Fig. 2H). Figure 2B shows the temporal evolution of the temperature of (1) the hind-paws, ipsilateral (T
paw-314
ipsi) and contralateral (Tpaw-contra) to the microinjection site, (2) five sites on the tail and (3) a small piece of
315
wood, indicator of the ambient temperature (Tamb). Figure 2C shows the temporal evolution of the core
316
temperature (Tcore). During the control period, Tamb and Tcore were stable while the hind-paws and tail were in
317
vasoconstriction with skin temperatures slightly above Tamb. Following the injection of muscimol, a
318
progressive increase of skin temperature is observed, starting at the ipsilateral paw (Tpaw-ipsi: 4.9 min
post-319
injection), followed by the proximal tail (Ttail-prox: 6.6 min), the distal tail (Ttail-dist: 11.6 min), and, finally, the
320
contralateral paw (Tpaw-contra: 12.6 min). The time courses of Tpaw-ipsi and Tpaw-contra were similar, increasing by
321
8.2 and 7.4°C, within 7.7 and 8.0 min respectively, and remaining stable afterwards. The temporal evolution 322
of the temperature of the tail was quite different, taking 26.6 min to achieve a 6.4°C increase for Ttail-prox vs.
323
21.2 min to achieve a 7.8°C increase for Ttail-dist. The intermediate parts of the tail showed a similar evolution
324
whose parameters spread out between those of the extreme parts. 325
Shortly after vasodilatation of the ipsilateral hind-paw, one sees a decrease in core temperature (Tcore)
326
(Fig. 2C) that was accentuated by the later vasodilation of the tail and contralateral hind-paw. Overall, Tcore
327
was reduced by 0.8°C within the 30 min post-injection period despite the active warming that remained 328
stable all over the experiment. The Heat Loss Indexes are shown in figure 2D for each site of Tskin skin
329
recording. 330
MAP (Fig. 2E) and HR (Fig. 2F) were also affected by muscimol. Both parameters dropped and 331
stabilized within 8 min, that is a few minutes earlier than the vasodilatation. At 30 min, the final MAP and 332
HR were 36% and 20% less than during the control period, respectively. These variations were associated 333
with a decrease of ETCO2 (Fig. 2G).
334
From such an example, one can infer that microinjection of muscimol centered on the RMg is able to 335
block the drive of the sympathetic control of vasomotion of the hind-paws and the tail, leading to an increase 336
in their skin temperature and a subsequent decrease in Tcore. The effects were dominant on the part of the
337
body ipsilateral to the microinjection site. These variations were associated with a decrease in MAP, HR and 338
ETCO2.
339 340
Overall effect of muscimol microinjection within the RVM/rMR on the vasomotion of the hind-paws
341 342
During the control period, both hind-paws were vasoconstricted at a stable skin temperature, close to 343
the ambient temperature. The microinjection of muscimol in the RVM/rMR elicited an increase of the 344
plantar skin temperature, indicating increasing blood flow. This reaction always started first in the ipsilateral 345
hind-paw. Following adjustment of each individual curve to a sigmoid by a Boltzmann regression (see Fig. 346
1AB), the experiments were divided in three groups on the basis of the distribution of the beginning (tmin) of
347
the ascending phase of vasodilatation at the hind-paw ipsilateral to the microinjection site (Fig. 1C): group 1 348
(acute onset group: tmin < 7.5 min); group 2 (intermediate onset group: 7.5 < tmin < 15 min); group 3 (late
349
onset or no response group: tmin > 15 min). The corresponding temporal evolutions of adjusted skin
350
temperatures are shown in Figure 3 for the 3groups. Regarding the two groups showing responses with acute 351
or intermediate onset, the ipsilateral and contralateral curves were essentially parallel, but the response 352
elicited in the latter was postponed by 11-12 minutes. The ascending phase of vasodilatation Δt was short 353
lasting (in the 6-8 min range) and large (in the 7-8°C/min range), therefore steep (in the 1°C/min range). The 354
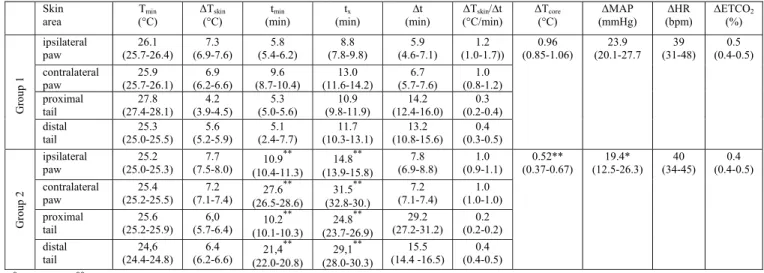
corresponding numerical data are provided in table 1A. 355
Figure 4 shows the corresponding localization of the muscimol microinjection sites reported on the 356
atlas of the rat brain by Paxinos and Watson (2005). For clarity of presentation, the data related to the hind-357
paws, ipsilateral and contralateral to the microinjection sites, are shown on the right and left parts of the 358
figure, respectively. The black, grey and white circles represent microinjection sites related to experiments 359
belonging to the first, second and third groups, respectively. Regarding the ipsilateral hind-paw, the most 360
effective sites are located between planes -1.3 and -2.8 mm with reference to the inter-aural line, mainly in 361
raphe pallidus, inner layer of raphe magnus and parapyramidal nucleus (Fig. 4B). These points are 362
surrounded laterally and rostro-caudally by the second group (grey symbols), often localized in the outer 363
layer of the raphe magnus. The non-reactive regions are outside these zones. The effects of microinjection on 364
the contralateral hind-paw (Fig. 4A) were very much dependent on its proximity to the midline. 365
Microinjections distant from the midline by less than 0.1 mm exhibited an acute onset effect, and those by 366
less than 0.3 mm an intermediate onset effect. 367
We seized the opportunity of the large number of microinjection sites to build a three-dimensional 368
mapping of response latencies as a function of injection site, using interpolation (Fig. 5). Since the effects 369
were clearly lateralized, the responses obtained from the left and right paw were merged, by expressing the 370
location of the injection site as ipsilateral (positive x-axis) vs. contralateral (negative x-axis) relative to the 371
paw. The earliest responses latencies were observed between planes z = -1.3 and z = -2.8 mm both from the 372
midline (raphe pallidus and raphe magnus) and a more lateral part centered on the lateral paragigantocellular 373
nucleus (LPGi) and the Parapyramidal nucleus (PPy). 374
375
Overall effect of muscimol microinjection within the RVM/rMR on the vasomotion of the tail
376 377
During the control period, the tail was vasoconstricted, with a decreasing thermal gradient from T
tail-378
prox to Ttail-dist [27.1 (26.9-27.3) vs. 24.9 (24.7-25.1)°C; P < 0.001]. The microinjection of muscimol within the
379
RVM/rMR elicited an increase of the tail skin temperature. However, a proximal-distal gradient was also 380
seen regarding the reactivity of the tail. Knowing these gradients, we analyzed the proximal and distal parts 381
of the tail, separately, using the type of grouping already made but based on the starting point of the acute 382
ascending phase of vasodilatation on the distal part of the tail (1st group (acute onset group): 0 < t
min< 7.5
383
min; 2nd group (intermediate onset group): 7.5 < t
min < 15 min; 3rd group (late or none reactive): tmin > 15
384
min), following sigmoidal adjustment of each individual. The corresponding temporal evolutions of adjusted 385
skin temperatures are shown in Figure 6 for the 3groups. Regarding the first two groups, the corresponding 386
numerical data are provided in table 1B. By comparison with the paws the process was slower (in the 0.3-387
0.5°C/min range) and less pronounced (in the 4-6°C range), possibly because we recorded the dorsal facet of 388
the tail (see discussion). 389
Figure 7 shows the corresponding localization of the muscimol microinjection sites for the proximal 390
(Fig. 7A) and the distal (Fig. 7B) parts of the tail. Again, the black grey and white symbols represent the 391
acute, intermediate and late or none reactive group respectively. The black symbols are located mainly 392
between planes -1.3 and -2.8 mm, close to the midline, in the raphe pallidus and raphe magnus. The grey 393
symbols surround the black ones and are located in the raphe magnus and parapyramidal region. In these two 394
groups, the proximal and distal parts of the tail reacted concomitantly. Overall, the proximal part of the tail 395
was more responsive to the microinjection; in particular, one can see several points from which a 396
vasodilatation was elicited on the proximal but not on the distal part of the tail, at least within the 15-min 397
early period. Most of these points were however located in the raphe magnus and parapyramidal nucleus. 398
Figure 8 represents the three-dimensional mapping of response latencies tmin as a function of
399
injection site. For both the proximal (Fig. 8A) and the distal (Fig. 8B) parts of the tail, the earliest response 400
latencies were observed between planes z = -1.3 and z = -2.8 mm from the midline (raphe pallidus and raphe 401
magnus) and a more lateral part. Interestingly, the lateral part centered on the Parapyramidal nucleus was 402
restricted to planes z = -2.3 to -2.8 mm without any obvious participation of the lateral paragigantocellular 403
nucleus. 404
Comparison of Heat Loss Indexes in various vasomotor states
406 407
The potential extent of skin temperature variations was physically restricted to the Tamb-Tcore range.
408
In terms of thermoregulation, these changes are best described using the Heat Loss Index as it eliminates the 409
passive changes and range limitation due to any Tamb and Tcore variations (Gordon et al. 2002; Romanovsky
410
et al. 2002; Székely 1986): HLI = (Tskin-Tamb)/(Tcore-Tamb). Table 2 compares results of skin temperature,
411
converted in terms of HLI, obtained in the present study (acute onset group 1, black symbols) to previous 412
experiments performed on anesthetized rats maintained in thermo-neutral conditions (El Bitar et al. 2014a). 413
The HLI values in the control period of the present study were close to those recorded during 414
vasoconstrictions in our previous study and identical in terms of ranking (Ttail-dist < Tpaw-ipsi < Ttail-prox).
415
However, the HLI values following muscimol microinjection were 20-25% lower than the HLI seen during 416
the maximal physiological vasodilatation achieved during thermo-neutrality. This observation suggests that 417
the ongoing hind-paws and tail fiber sympathetic activity was not completely silenced following the 418
muscimol microinjections, in spite of an apparent ceiling effect. 419
420
Overall results, including the effects on vital signs
421 422
In order to homogenize the results for further analyzes, the experiments were reorganized in three 423
new groups, again on the basis of the onset time tmin of the ascending phase of vasodilatation (Fig. 9). The
424
first includes experiments where tmin was < 15 min for all considered skin areas either on the tail or the paws
425
(black circles in figure 9A). They were located between planes -0.8 and -2.8 mm, not more lateral than 0.3 426
mm from the midline, mainly in the inner part of raphe magnus and raphe pallidus. The second includes 427
experiments where tmin was < 15 min for at least one but not all the areas considered on the tail or the
hind-428
paws (grey circles in figure 9A). They were located in the raphe magnus and parapyramidal area, 429
surrounding the preceding group. The third group includes experiments where tmin was > 15 min for all
430
considered skin areas either on the tail or the paws (white circles in figure 9A). The corresponding effects of 431
microinjection of muscimol on Tpaw-ipsi, Tpaw-contra, Ttail-prox and Ttail-dist are summarized in figures 9B, C, D and
432
E, respectively. 433
Figure 9F shows the concomitant effects on Tcore. There was no statistical difference among the three
434
groups concerning Tcore during the control period (P = 0.94). After the muscimol injection, the mean
435
temperatures diverged strongly with progressive drops for the 1st and 2nd group. The effects of muscimol
436
microinjections on MAP, HR and ETCO2 are presented in Figures 9G, H and I, respectively. For all three
437
groups, we report a transitory increase of MAP and HR in the first minute following the microinjection of 438
muscimol. Thereafter, the curves declined slowly and slightly till the end of the experiments. Regarding the 439
first two groups, the corresponding numerical data are provided in table 3. These results are in line with 440
previous reports in anesthetized rats following microinjection of muscimol in the RVM/rMR, describing 441
slight or non-significant decreases in MAP, HR and ETCO2 (Bernard et al. 2008; Blessing and Nalivaiko
442
2001; Nakamura and Morrison 2007; Tanaka et al. 2007; Zaretsky et al. 2003a; 2003b). Note that our 443
recordings were made under an anesthetic regime that preserves withdrawal reflexes while most earlier 444
reports were obtained with deeper regimes that could have masked the effects reported here. 445
446
Modeling the effect of muscimol injection within the RVM/rMR on the tail-flick test
447 448
In a previous study, we proposed and verified experimentally a simple model to compute the 449
expected tail-flick latency (TFL) of a rat exposed to a source of radiant heat applied onto the tail (Benoist et 450
al. 2008). The model takes into account the power of the radiant heat source, the initial skin temperature, the 451
core temperature and the site of stimulation on the tail, and has been applied successfully to reconstruct TFLs 452
following a conditioned stress response (Carrive et al. 2011). Here, the model was used to compute the 453
predictable variations of TFL introduced by muscimol. Decisional and motor latencies were estimated to be 454
134 and 4 ms, respectively (Benoist et al. 2008). Considering a site of stimulation on the mid-tail, the 455
distance to the dorsal horn entry zone is approximately 200 mm. The model provides the following equation 456
for the expected tail-flick latency: TFL (s) = [(36.8 - 0.73*Tmid-tail)2/α + 90/(0.041*Tcore - 0.47) +
457
110/(0.041*Tmid-tail - 0.47) + 138]/1000 where α is the slope of the squared temperature variation (in °C2/s)
458
generated by the power of the radiant heat source. 459
Let us recall at this point that, when the skin is exposed to a constant power source of infrared 460
radiation, the temperature increases with the square root of time, according to the law of radiant heat transfer 461
T = Tmid-tail + a.t0.5 or, expressed in terms of temperature variation T - Tmid-tail = a.t0.5. This quadratic
462
relationship becomes linear in t by squaring the two terms of the equation: (T - Tmid-tail)2 = a2.t = α.t where α
463
is the slope of the squared temperature variation generated by the power of the radiant heat source [see Fig. 464
2A in (Benoist et al. 2008)]. The predictive model of TFL was fully verified following variations of the 465
radiant heat source (i.e. α) or the basal temperature of the skin (i.e. Tmid-tail here) [see Fig. 8 in (Benoist et al.
466
2008)]. In the classical tail-flick test, the principal source of variation introduced by experimenters is the 467
power of the electrical bulb used for heating the skin of the animal. The investigator adjusts the radiant heat 468
emission with a rheostat to achieve a predetermined TFL in the control situation, most commonly in the 2-4 469
seconds range (Le Bars et al. 1999, 2009). In the model, such latencies are achieved for α in the 0.08-470
0.2°C2/s.
471
The model was applied to the data of animals in which the beginning of the ascending phase of 472
vasodilatation was < 15 min either on the tail or the paws (black group in figure 9). The model foretells a 30-473
35% decrease of the TFL, thirty minutes following muscimol administration (Fig. 10). It appears therefore 474
that, regardless of any other additional possible causes, the vasodilatation of the tail is a major source of 475
variation of the TFL following muscimol administration in RVM/rMR. 476
DISCUSSION
478 479
Muscimol was injected in the lower brainstem with the aim of assessing the role of the RVM/rMR 480
on the control of sympathetic drive to the tail and hind-paws. Microinjections within this brainstem region 481
increased the skin temperature of the hind-paws and tail as a result of reduced vasomotor tone. The effects 482
were dominant on the hind-paw ipsilateral to the microinjection site. Increased heat loss through 483
vasodilatation of the tail and paws were associated with a drop of Tcore and slight decreases of MAP, HR and
484
ETCO2.
485
Following some technical considerations regarding the microinjection procedure, we will discuss the 486
following points: (1) general findings; (2) lateral localization of effective sites; (3) rostro-caudal localization 487
of effective sites; (4) pharmacological manipulations of RVM/rMR in pain studies. 488
489
Technical considerations regarding the microinjection procedure
490 491
The kinetic and volume of efficient microinjection is determined by numerous factors: the 492
concentration, rate of delivery and properties of both the drug - coefficient of diffusion, binding, catabolism - 493
and the tissue - volume fraction, tortuosity - (Syková and Nicholson 2008). In nuclear and cortical 494
homogenous regions, drug distributions are typically spherical or in the shape of drop (Bondareff et al. 1970; 495
Martin 1991; Myers 1966). 496
In a “mapping” study aiming at demarcating a functional region in the brain, both positive and 497
negative results are significant. A negative result obtained with a large dose is a very convincing result in 498
this respect. Considering the large volume of the explored brain structure (roughly 3 x 4 x 2 = 24 mm3), a
499
compromise was necessary to both find significant positive results with minimal doses and to avoid useless 500
negative results. Studies on the involvement of these regions in pain/nociception and thermoregulation have 501
used muscimol injections in the 10-1000 pmol / 60-1000 nl ranges (Bernard et al. 2008; Blessing and 502
Nalivaiko 2001; Brink et al. 2006; Cao et al. 2004, 2010; Cerri et al. 2010; Fan et al. 2007. Gilbert and 503
Franklin 2001; Heinricher and Kaplan, 1991; Martenson et al. 2009. Meng et al. 1998; Morrison 1999, 2003; 504
Nakamura and Morrison 2007, 2011; Ootsuka and McAllen 2005; Rathner et al. 2008; Vianna et al. 2008; 505
Zaretsky et al. 2003a, 2003b). Knowing that muscimol does not spread appreciably because it is a potent 506
ligand for neuronal and glial GABAA receptors, we decided to use a small volume of injection (50 nl = 0.05
507
mm3, that is a ~0.5 mm diameter for an ideal sphere) but a relatively high concentration. This was supposed
508
to provide an effective radius of blockade in the ~ 1 mm range (Martin 1991; Martin and Ghez 1999; Malpeli 509
1999; Edeline et al. 2002). Following similar microinjections using [3H]muscimol, autoradiographic analyses
510
showed a spread ~1.5 mm from the injection site at 15 min (Edeline et al. 2002; Martin 1991). Martin and 511
Ghez (1999) used glucose metabolism to assess the extent of inactivation and observed a central core of 512
blockade (~ 1 mm radius) surrounded by an extensive region of reduced metabolism, possibly due to reduced 513
synaptic activity of neurons receiving projections from the core region. In summary, muscimol binds 514
strongly and diffuses slowly outward at effective concentrations from the region immediately inundated by 515
the bulk flow (Malpeli 1999). 516
Since myelinated fiber bundles impede muscimol diffusion (Allen et al. 2008), it is likely that the 517
particular architecture of the RVM/rMR with a predominance of rostro-caudal fibers and a low neuronal 518
density favors a rostro-caudal diffusion of the product. In addition, the two paired bundles of myelinated 519
fibers that cover the brainstem floor, namely the pyramidal tract and the medial lemniscus, constitute a 520
strong diffusion barrier. Accordingly, the post-mortem examination of pontamine spread revealed an 521
elongated pattern of diffusion two times longer in the rostro-caudal direction as compared to the coronal 522
plane. 523
Using these microinjections, we were able to build response maps on the basis of 160 experiments. 524
Together with the small volume of injection and the large number of negative sites of injection (60%), this 525
approach provided (1) an acute delineation of the structures able to block sympathetic cutaneous 526
vasoconstrictor activity; (2) the possibility of a temporal analysis of these effects; and (3) the resultant 527
capacity of defining a brain region as the core of effects, surrounded by intermediate and then ineffective 528
zones. 529
Because of such a large number of injection sites, we introduced a new procedure to compute three-530
dimensional interpolated maps of response latencies and overall sympathetic blockade as a function of 531
injection site. The interpolation was performed by computing an average of the responses obtained at all 532
injection sites, weighted by the distance between the interpolated voxel and each injection site. This ensured 533
that the interpolated values were most dependent on the responses of the nearest injection sites. In addition, 534
because of the non-homogeneous sampling of the interpolated volume, a mask was used to exclude voxels 535
that were not close to at least one injection point. The obtained volumes provide an interesting mean to 536
assess the relationship between the effects of the injection and the anatomical location of the injection. 537
538
General findings
539 540
Our results are largely in agreement with earlier reports regarding the sympathetic drive of the tail. 541
Microinjection of glycine, GABA or muscimol in the RVM/rMR blocks the activation by cold or fever of 542
sympathetic fibers that innervate the tail (Blessing and Nalivaiko 2001; Cerri et al. 2010; Korsak and Gilbey 543
2004; Ootsuka and McAllen 2005; Ootsuka et al. 2004; Rathner et al. 2008; Vianna et al. 2008). On the other 544
hand, microinjection of glutamate or bicuculline increases the activity of vasomotor sympathetic nerves of 545
the tail, thus decreasing the blood flow, without affecting the mesenteric vascular bed (Blessing and 546
Nalivaiko 2001; Morrison 2001; Rathner and McAllen 1999). Several aspects of our contribution should be 547
highlighted. 548
The experimental conditions were close to those of thermoneutrality (El Bitar et al. 2014a). Twarm was
549
adjusted to ~ 0.3°C below Tcore. Demonstrating their vasoconstricted state, the temperature of the distal part
550
of the tail was very close to the ambient temperature (~ 0.7°C above Tambient). It then increased by ~ 6°C
551
following the injection of muscimol in responsive brainstem sites. In comparable experimental conditions, 552
microinjection of GABA or muscimol in RVM/rMR blocks the activity of the sympathetic fibers innervating 553
the rat tail (Korsak and Gilbey 2004; Ootsuka and McAllen 2005). 554
We have previously discussed (El Bitar et al. 2014a) that the vasomotor tone of the dorsal facet of 555
the tail is less reactive than the ventral facet, notably because the ventral artery is larger than the lateral 556
arteries, while the ventral vein is thinner than the lateral veins (Knoppers 1942; Thorington 1966; Wu et al. 557
1995; Young and Dawson 1982). It follows that the temperatures of the dorsal and ventral facets of the tail 558
are identical during vasoconstriction but shift by ~ 3°C during full vasodilatation. The recorded effects from 559
the tail were thus underestimated, as compared to those seen on the hind paws. 560
A major novelty of our study was to include the paws to these basic phenomenological observations. 561
Such as for the tail, the hind-paws were in a stable vasoconstricted state, as demonstrated by the fact that the 562
temperature of the hind-paws was close to the ambient temperature (2-3°C above Tambient). This increased by
563
~ 7°C following the injection of muscimol in the active sites. We have already discussed the involvement of 564
the paws in rat thermoregulation (El Bitar et al. 2014a). The feet make up approximately 10% of the total 565
surface area of the body, slightly more than the tail (Lin et al. 1979). It follows that the substantial muscimol-566
induced vasodilatation of the paws contributed significantly to the core temperature drop (~ 1°C within half 567
an hour). 568
Our purpose was not to confirm well-documented notions. We specifically aimed at mapping the 569
brainstem regions that contain the premotor sympathetic neurons that control the vasomotor tone of the tail 570
and hind-paws because most models of pain/nociception are based on behavioral responses elicited by 571
thermal stimulation (reviewed in Le Bars et al. 2001, 2009). We undertook this large study because studies 572
on pain/nociception have emphasized the Rostral Ventromedial Medulla (RVM), which includes the nucleus 573
raphe magnus and the gigantocellular reticular nucleus pars alpha (mainly at the level of the facial nucleus), 574
while studies on thermoregulation have emphasized a slightly shifted more caudal region centered on the 575
raphe pallidus. In addition, we described in a previous work that neurons involved in pain/nociception 576
located in the brainstem are probably also implicated in autonomic regulation, notably cutaneous vasomotion 577
(El Bitar et al. 2014b). 578
The results of the present study suggest that the regions described as being involved in 579
pain/nociception modulation and the regions involved in thermoregulation are spatially matched, at least 580
functionally regarding the vasomotor tone of the tail and hind-paws. 581
582
Localization of effective sites in coronal planes
583 584
The most effective sites were restricted to well-circumscribed regions. Numerous negative 585
microinjections sharpened the delineation. Our observations regarding the tail are in keeping with the 586
mapping by Korsak and Gilbey (2004) who reported that GABA microinjections in the region of raphe 587
pallidus and magnus markedly decreased the sympathetic cutaneous vasoconstrictor activity in the dorsal 588
collector nerves of the tail, while injections more dorsal or lateral tended to produce either a smaller decrease 589
or have no effect. Blessing and Nalivaiko (2001) also emphasized the raphe magnus, raphe pallidus and 590
parapyramidal nucleus in this respect, although they did not provide a graphical mapping of the effects. 591
Only microinjections in RMg, RPa and PPy elicited a vasodilatation in the ipsilateral hind-paw 592
within less than 7.5 min and those distant from the midline by less than 0.3 mm induced a vasodilatation in 593
the contralateral hind-paw within the same period. These observations deserve two comments. First, within 594
the coronal plane, the lateral diffusion of muscimol was limited, as expected. Second, projections of 595
RVM/rMR cells are mainly lateralized, predominantly controlling vasomotor tone of the ipsilateral body 596
side. Our results are in keeping with studies showing that RVM/rMR neurons send axons towards the spinal 597
cord mainly through the ipsilateral dorso-lateral funiculus (Basbaum and Fields 1979; Fields et al. 1995; 598
Lefler et al. 2008; Light 1985). Microinjections close to the midline also elicited early vasodilatation of the 599
tail, the most effective sites being restricted to the same well-circumscribed regions. Neurons in the PPy 600
present morphological, histo-chemical (Helke et al. 1989; Lynn et al. 1991) and functional (Blessing and 601
Nalivaiko 2000) properties similar to those of the RPa. Some authors consider therefore PPy as part of RPa 602
(e.g. Cano et al. 2003). 603
Interestingly, brainstem neurons activated both antidromically from the lumbar dorso-lateral 604
funiculus and by mild cooling of the animal core temperature, were found in both raphe pallidus and magnus 605
(Rathner et al. 2001). Such neurons could be involved in the results presented here. However, there are other 606
control loops that regulate the central temperature through the vessels in the hairy skin, the interscapular 607
brown adipose tissue (BAT) and the fusimotor fibers to limb muscles, all being silenced by neuronal 608
inhibition of the raphe pallidus and/or magnus (McAllen et al. 2010). Although they all should have a 609
sympathetic premotor relay in these nuclei, these four sympathetic thermo-effector outflows differ in terms 610
of thermal thresholds, relative responsiveness to core temperature, patterns and driving by neural pathways, 611
and thus probably do not “crosstalk” at this level (McAllen et al. 2010; Nagashima et al. 2000; Ootsuka and 612
McAllen, 2006 ; Romanovsky 2007 ; Tanaka et al. 2007). The relative contribution of single individual 613
neurons to these functions remains an open question. 614
615
Rostro-caudal localization of effective sites
616 617
Overall, the injection sites which elicited the most widespread and early latency vasodilation were 618
located in the coronal planes posterior to the interaural line by 1.3-2.6 mm. 85% of experiments where the 619
vasodilatation of all areas either on the tail or the paws occurred in less than 15 min were found in these 620
regions. Again our observations agree with the report by Korsak and Gilbey (2004) showing a similar rostro-621
caudal extension of their effective sites for blocking by GABA the sympathetic vasoconstrictor drive in the 622
tail. Similarly, brainstem neurons both antidromically activated from the lumbar dorso-lateral funiculus and 623
activated by mild cold were found in the raphe nuclei between the coronal planes posterior to the interaural 624
line by 1.8-2.3 mm (Rathner et al. 2001). 625
Overall, the literature related to thermoregulation points to coronal planes immediately rostral to the 626
rostral pole of the inferior olivary complex at the level of the caudal half of the facial nucleus. This brainstem 627
region is often referred as to the rostral raphe pallidus, although it generally does include the nucleus raphe 628
magnus (e.g. Madden and Morrison 2003, 2005; Morrison 1999, 2003; Morrison et al. 1999, 2000; Rathner 629
et al. 2008). In fact, very few studies were devoted to a systematic mapping. 630
As pointed out by Nason and Mason (2004), it is unlikely that a microinjection into any single 631
nucleus in RVM/rMR will affect neurons confined to that nucleus because these neurons have large dendritic 632
arbors that cross cytoarchitectonic boundaries (Gao and Mason 1997; Mason et al. 1990; Newman 1985; 633
Potrebic and Mason 1993). Blessing (2003) discussed the conventional anatomical demarcation into RMg 634
and RPa by raising the following points. The delimitation of boundaries is based particularly on the work of 635
Taber et al. (1960) that follows the atlas of Meessen and Olszewski (1949) for rabbits and the atlas of 636
Olszewski and Baxter (1954) for humans. However, the rabbit atlas combines all the ventral midline neurons 637
in the rostral medulla and caudal pons as “RMg” and does not use the term “RPa.” In contrast, the human 638
atlas uses “RPa” and not “RMg”. However, by convention, RMg in the rat is more rostral and dorsal, and 639
RPa is more caudal and ventral (Paxinos and Watson 2005). 640
We noted that the Heat loss Indexes following muscimol microinjection were 20-25% lower than the 641
HLI seen during the maximal physiological vasodilatation achieved in rats maintained in thermo-neutral 642
conditions (El Bitar et al. 2014a), suggesting that the ongoing hind-paws and tail fiber sympathetic activities 643
were not completly silenced following the microinjections, in spite of a clear ceiling effect when 644
microinjections were effective. The most parsimonious explanation for this observation is the oblong 645
geometry of the involved brainstem structures, ~12 times longer than the diameter of the injected volume, 646
preventing the drug to reach all structures potentially involved in controling vasomotor tone. 647
In summary, there are morphological and functional reasons to consider the RVM and rMR nuclei as 648
a single RVM/rMR entity, as already proposed by Mason et al. (2001, 2005a, 2005b, 2006, 2011). 649
650
Is the RVM really specific for pain/nociception?
651 652
Our study shows, in the rat, a mutual covering of the regions involved in thermoregulation (at least, 653
regarding the vasomotor tone of the tail and hind-paws) with those reported as being specifically involved in 654
pain/nociception. 655
In spite of several warnings initiated by Thelma Lovick and Peggy Mason (Le Bars et al. 2001; 656
Lefler et al. 2008; Lovick 1997; Mason 2001; 2005a; 2005b; 2006; 2011; 2012), the specificity of the RVM 657
regarding the control of pain/nociception mechanisms is repeatedly put forward or assumed (e.g. Fields et al. 658
2006; Heinricher and Ingram, 2008; Basbaum et al. 2009; Heinricher et al. 2009). RVM neurons do not only 659
project towards the dorsal horn of the spinal cord (Fields and Basbaum 1978; 1999), but also to the 660
intermediolateral cell column, with a high degree of collateralization in both the rostro-caudal and dorso-661
ventral axes (Bacon et al. 1990; Basbaum et al. 1978; Hossaini et al. 2012; Lefler et al. 2008; Loewy 1981; 662
Morrison and Gebber 1985). 663
Numerous neurons in RVM/rMR were identified as sympathetic premotor neurons by early 664
retrograde trans-synaptic labeling with the pseudo-rabies virus (Smith et al. 1998; Strack et al. 1989). 665