HAL Id: hal-02134678
https://hal.archives-ouvertes.fr/hal-02134678
Submitted on 20 May 2019HAL is a multi-disciplinary open access archive for the deposit and dissemination of sci-entific research documents, whether they are pub-lished or not. The documents may come from teaching and research institutions in France or abroad, or from public or private research centers.
L’archive ouverte pluridisciplinaire HAL, est destinée au dépôt et à la diffusion de documents scientifiques de niveau recherche, publiés ou non, émanant des établissements d’enseignement et de recherche français ou étrangers, des laboratoires publics ou privés.
Statistical lifetime modeling of Fe-Ni-Cr alloys subject
to high-temperature corrosion in waste-to-energy
production units
Sheyla Herminia Camperos Guevara, Jean Michel Brossard, Pascal Floquet,
Daniel Monceau
To cite this version:
Sheyla Herminia Camperos Guevara, Jean Michel Brossard, Pascal Floquet, Daniel Monceau. Sta-tistical lifetime modeling of Fe-Ni-Cr alloys subject to high-temperature corrosion in waste-to-energy production units. Corrosion, National Association of Corrosion Engineers, 2015, 71 (11), pp.1360-1369. �10.5006/1808�. �hal-02134678�
O
pen
A
rchive
T
oulouse
A
rchive
O
uverte
(OATAO)
OATAO is an open access repository that collects the work of some Toulouse researchers and makes it freely available over the web where possible.
This is
an author'sversion published in:
https://oatao.univ-toulouse.fr/23811Official URL :
https://doi.org/10.5006/1808To cite this version :
Any correspondence concerning this service should be sent to the repository administrator:
tech-oatao@listes-diff.inp-toulouse.fr
Camperos Guevara, Sheyla Herminia and Brossard, Jean Michel and Floquet, Pascal and Monceau, Daniel Statistical lifetime modeling of Fe-Ni-Cr alloys subject to high-temperature
corrosion in waste-to-energy production units. (2015) Corrosion, 71 (11). 1360-1369. ISSN
0010-9312
OATAO
Statistical lifetime modeling of Fe-Ni-Cr alloys subject to high temperature corrosion in
Waste-to-Energy production units
Sheyla CAMPEROS 1*, Jean Michel BROSSARD 2, Pascal FLOQUET 3, Daniel MONCEAU 1 * sheylaherminia.camperosguevara@ensiacet.fr
1
CIRIMAT/ENSIACET, 4 Allée Emile Monso Toulouse, 31030 France
2
Veolia Environnement Recherche et Innovation, 291 Ave. Dreyfous Ducas Limay, 78520 France
3
LGC/ENSIACET, 4 Allée Emile Monso Toulouse, 31030 France
ABSTRACT
The incineration of municipal solid waste as the main process of Waste-to-Energy (WtE) plants is often associated with high temperature corrosion problems. With the idea of further increasing the efficiency of electric power generation and reducing the total cost of WtE units, it is important to develop preventive maintenance strategies based on accurate predictive methods resulting in economic savings and resource optimization. The main purpose of this study is to propose a statistical methodology for lifetime prediction modeling over a wide range of conditions of these complex environments and discuss the results regarding the mechanisms described in the literature. In order to create a quantitative tool to evaluate material corrosion performances based on adapted corrosion tests and the definition of accurate criteria for life assessment, a database with 1595 test results has been built from several published high temperature corrosion studies. The data distribution was analyzed by descriptive statistic approaches; the procedure of Principal Components Analysis (PCA) was applied to determine the most important parameters that govern the corrosion process. The statistical results were compared with the experimental findings of the authors to create a model by Multiple Linear Regression Analysis whose accuracy and physical interpretation are discussed.
INTRODUCTION
The growing world population demands an increase of energy in the form of electricity which can be provided by the Waste to Energy (WtE) process. However, high temperature corrosion is the main limiting factor for energy recovery efficiency in the WtE process. The corrosion control of alloys exposed to severe and complex conditions have been a great challenge for industrial applications for several decades. Nowadays, the corrosion costs are increasing, therefore, preventive strategies have become the main demand of the industries.
Corrosion is considered to result from the deposition of fuel-slag condensates of sulfate and chloride mixtures on component surfaces. The deposits contain alkali metals (Na, K) and heavy metals (Zn, Pb), which can form low melting point compounds at operating tube metal temperatures. 1 Corrosion initiates at temperatures where salts start to melt, and becomes severe when the quantity of fused-salt constituents in the deposits increases. Corrosion abatement occurs when the majority of the deposits become fused, since this might hamper the gas transport from flue gas to metal substrate. 2 This corrosion can be viewed as a form of high temperature corrosion caused predominantly by low melting point fused salts in slag deposits. 1 It has been demonstrated that this phenomenon is complex and the risk of corrosion leads to frequent shutdowns for repairs. In order to limit the degradation impact of high temperature corrosion on operating costs and availability of the installations, it has become necessary to understand the mechanisms, to identify key parameters that govern them, to optimize the materials selection for the operational units as well as to adopt a preventive maintenance strategy through prediction methodologies. The composition of the corrosive agents naturally depends on the quality of the burned waste but also on other factors that vary strongly between the combustion chamber and the super heaters.
The main factors that intervene in the corrosion mechanisms and kinetics of the WtE boiler tubes are the following: 3, 4
Gas temperature and metal temperature,
Condensation of gases containing alkaline and metallic chlorides due to temperature gradient in the interface gas/tube/vapor,
Ash composition,
Gas composition (CO, HCl, SO2, alkaline and metallic chlorides),
"Soot-blowing" which causes the destruction of the protective oxide scale on the surface, The gas velocity which can affect the erosion by contact with solid ash,
Gas temperature fluctuations, Component design.
A considerable amount of literature has been published on high temperature corrosion over the last decades, therefore the mechanism is well documented but the relative contribution of each parameter still needs to be quantified. In parallel, many materials and coatings have been developed in recent years; however their performances in different environments are not sufficiently well understood to define suitable criteria for corrosion rate predicting models regarding all the operating conditions.
In recent years, researchers have proposed a variety of approaches for the quantitative description of the degradation kinetics of high temperature corrosion of structural materials. Strutt (1985) 5 proposed the prediction of corrosion by statistical analysis of corrosion profiles of the pits. Then Kawahara (1998) 6, 7 assumed in a model that high temperature corrosion follows a linear rate or a parabolic rate depending on gas temperature, metal temperature, HCl in the gaseous phase, Cl- in deposits and the sum of elements Ni, Cr, Mo. Later, Ots (2004) 8 has proposed a model that includes the effect of erosion in the degradation process. Ruth and Spiegel (2006) 9 studied the corrosion kinetic as a function of gaseous phase and melt-salts composition. Lebel (2008) 10 proposed a model considering the gas temperature, HCl and SO2 in the
gaseous phase and Cl in deposits. All these studies have attempted to explain the degradation mechanisms, but the models are still partial as they do not simultaneously take into account the main corrosion governing parameters, or because their validity domains are too restricted for operating conditions in modern WtE facilities. 11 In addition it is very difficult to establish a statistical pattern for all the parameters from one single study or by simple comparison of studies because the corrosion testing procedures and experimental conditions change from one study to another. Recent publication of
Output Variable Selection
In the database, the information related to the tests such as material chemical compositions, solid fuel characteristics, test settings, deposit chemical composition, and coating descriptions are the input data of the potential model, while the corrosion rate is the output result. Statistically speaking, the input data are the explanatory variables of the corrosion rate that is the dependent variable of the model.
About 30 studies were included in the database, 1, 2, 7, 13-38 with 1328 tests performed under different conditions, each of them expressing corrosion degradation in different ways such as: mean and maximum
(1)
International Organization for Standardization (ISO), 1 ch. de la Voie-Creuse, CP 56 CH-1211 Geneva 20, Switzerland.
ISO/FDIS(1) 17248:2013(E) 12 on high temperature corrosion testing of metallic materials by embedding material in salts or ash should help in the future to build up this kind of model. Therefore, there is no lifetime model currently available in the open literature for commercial materials that takes all variables involved in the high temperature corrosion process into account.
EXPERIMENTAL PROCEDURE
It is well known that one single experimental study is not enough to create an accurate model when multiple parameters are involved. In order to develop a lifetime prediction model for materials exposed to high temperature corrosion atmospheres, a database has been built to compile a large quantity of experimental data coming from 30 high temperature corrosion studies. This database includes over 1594 results coming from 1328 high temperature corrosion tests under different conditions of the waste incineration process. This database was built on worksheets taking into account all the information regarding the tests exhibited in the papers reviewed. Simultaneously, the information found was sorted by areas of interest, as shown in Figure 1.
thickness loss, weight loss and weight gain. All of these values were translated into rates and were then quantified as shown in Figure 2.
Most of the corrosion rates results (43%≈ 684 results) are expressed in maximum thickness loss rate (m/h) (MTLr), as a consequence of this large population, this magnitude seemed most likely to be used as the dependent variable in the model in order to develop a robust model capable to be refined according to the environment of interest.
Input Variable Selection
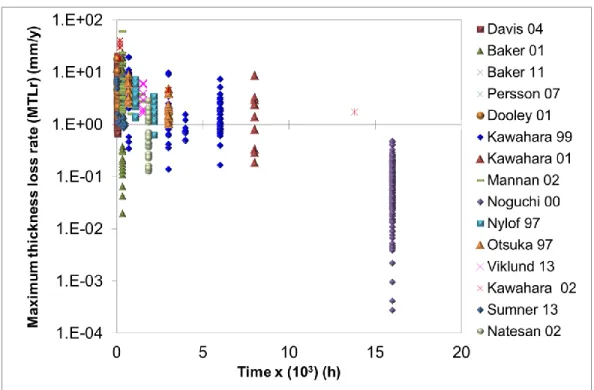
Once the maximum thickness loss rate (MTLr) was chosen as the dependent variable, 684 values distributed in 15 studies 11-25 were analyzed by statistical descriptive methods such as curves as a function of time (Figure 3), histograms and box plots, in order to identify the data distribution, to exclude isolated data and to establish the validity domain.
In order to identify the explanatory variables which best describe MTLr, the data population was analyzed by the statistical method Principal Component Analysis (PCA). 39 This technique allowed to reduce the number of variables for the model, based on the following criteria:
• Highest cumulative variability in the first two factors (F1, F2) in order to visualize most of the information in the 2 axes (Figures 4, 5, 6).
• Highest correlations between the MTLr and all the explanatory variables.
• Existing correlations among the variables, in order to avoid repeating variables in the model by MLR with the same information contained.
• The correlations are represented by the angles between vectors (). Those which are orthogonal are not correlated at all, those which are very close between them ( < 90°) are positively correlated and those who are on opposite sides ( > 90°) are negatively correlated.
• Priority is given to the well-represented variables on the axes in order to increase the reliability of the correlations and physical trends. The representation on the axes is indicated by the radius of the vector, the closer it is to the circle perimeter the better it is.
The PCA’s were carried out by groups of variables depending on the type of information. As shown in Table 1, PCA1 was applied on alloy composition, PCA2 was applied on conditions related to the test
environment such as metal temperature and gaseous phase characteristics, and PCA3 was applied on ash
chemical composition in elemental form, compositions found in compound form were converted to their elemental form to homogenize further treatment.
RESULTS and DISCUSSION
Figure 3 shows 684 MTLr values compiled from 15 high temperature corrosion studies as a function of the tests’ dwell time, corrosion rates are constant and in some cases tend to decrease with time. All of these values are explained by a group of explanatory variables that play a specific role in the high temperature corrosion process.13-27
Principal Component Analysis
Figure 4 shows PCA1 for alloys nominal composition on 684 test results with 52% of cumulative
variability represented. The analysis indicates the general correlation trends among the alloy elements as well as the correlation between each element and the MTLr on the entire data population.
The diagram shows Fe and Ni in the F1 axis with the highest representation and the MTLr as a supplementary variable in the F3 axis (not shown in the diagram). As expected, the Fe has a direct negative correlation with Ni, Cr and Mo (diametrically opposed). Also Ni, Cr, and Mo have positive correlation between them (nearby vectors). Therefore, in order to avoid collinearity among the variables in the MLR, for modeling must be used one of the following main elements: Fe, Ni, Cr Mo. However Fe, Ni, and Mo show a very low correlation (< 0.05) with MTLr while Cr presents the highest correlation with MTLr.
Most of the elements have logical position regarding the effect on MTLr, even though they show low levels of correlation, which may be caused by the 48% of information not yet represented in the
correlations or by the fact that there are other variables that better govern the corrosion process. Indeed, an environment containing oxygen, chlorine, sulfur and other volatile species able to condensate on the tube surface as solid phases ( KCl, ZnCl2 and others) leads to very complex corrosion mechanisms. As the
number of alloying elements in the materials increases, the behavior becomes even more complex and the specific role of each element is difficult to differentiate.28 However the statistical analysis supports with a very low positive correlation the results of several studies indicating that Fe-base alloys are less resistant to chloridizing environments compared to Ni-base alloys. This is related to the high affinity of iron for chlorine which entails the formation of volatile iron chlorides and lowers the melting point of eutectic mixtures. 20 The corrosion resistance is improved by the combined effect of the main elements Ni, Cr, and Mo. It has been proven that Ni is an element comparatively stable regarding reactions with chlorine. Cr is the most important alloying element for high temperature corrosion attacks. It forms Cr2O3 as a major
component of the protective oxide scale.19 Alloys with less than 15% Cr are generally very susceptible to high temperature corrosion attacks. Austenitic stainless steels are more resistant than carbon steels. The most common is the 304 (UNS S30400) (18%Cr). Higher chromium austenitic stainless steels appear to be better in terms of furnace wall corrosion. For example type 310 (UNS S31000) (24%Cr) is more corrosion resistant than 304 (UNS S30400). 41 Also ferritic stainless steels containing 20 to 30% of Cr have shown good resistance to high temperature corrosion. 40, 41. The negative correlation between Mo and MTLr is expected as the addition of Mo in a content of approximately 5% or more is effective to resist high temperature corrosion. This is due to the fact that Mo is less reactive to chlorine than Fe and Ni, the same effect is expected with W which also presents negative correlation with MTLr. 19
Contrary to what is expected, Si has a positive correlation with the corrosion rate. Si is supposed to improve the corrosion resistance against sulfidation, but, since it reduces the melting point, the microstructural stability, the tube producibility, and weldability of materials, adding Si only can be beneficial depending on the chosen application. Other characteristics such as high temperature strength and bending workability can be reached by optimizing small amounts of alloying elements such as C, Nb, Ti and Al.19, 20, 25 Also Kawahara (1997) has confirmed that the corrosion rate of an Al-rich layer is
relatively low, as it forms aluminum oxide (Al2O3) as a protective film that contributes to corrosion
resistance depending on the conditions. 32 The unexpected positive correlation between Cu, Nb, Ti and MTLr may be explained by the fact that the PCA analysis includes several families of materials and their effect as alloying elements depends on the major elements of the alloys. Hence the reason for the positive correlation with MTLr is difficult to establish, as their effect can be overlapped by other elements. The statistical analysis identified Cr as the most viable element to be included in modeling because Cr has the highest correlation with corrosion rates among the main elements of the alloys and its importance in the high temperature corrosion resistance. However, because of the variability of the data, further filtering procedures for materials domain were necessary (Figures 7,8).
Figure 5 shows PCA2 for environmental conditions which includes temperature and gas phase
compositions run over 684 tests with 73% of cumulative variability. This means higher correlation reliability in comparison with PCA1. The variables are adequately represented by the F1 and F2 axes,
while MTLr as a supplementary variable is in the F3 axis (not shown in the diagram). As expected, MTLr has the highest positive correlation with TMetal because the metal temperature not only influences the
reaction rate, but also controls the melting of deposits and thus activates the corrosive reaction. 19,32 TMetal
does not show a significant correlation with the other variables.
The negative correlations with %O2, CO2 and %H2O are consistent with studies in which the
corrosion rate decreased by increasing the O2 and H2O concentration. 9, 42
This is certainly related to the formation of protective oxide scales against the corrosiveness of ash, as these gases act as oxidizing agents to form protective layers. When protective oxide scales are dissolved by molten deposits, an oxidizing environment should supply the O2 needed for re-healing the oxide layers in the presence of the oxide
forming elements. 32 The O2 content does not show any correlation with the other variables.
HCl has a positive correlation with MTLr, which is expected because HCl is well known to initiate active oxidation at the metal/oxide scale interface. Nevertheless, the present analysis highlights that the HCl correlation with MTLr is very low. A possible explanation for this might be that the effect of gaseous HCl is probably low compared to other parameters. Brossard et al (2010) 43 demonstrated in laboratory
scale testing that the fireside corrosion rate in gaseous complex atmospheres (O2, H2O, HCl and SO2), is
drastically higher in the presence of reactive ash. On the other hand, H2O, which has a negative correlation
with MTLr, exhibits a high positive correlation with CO2 and HCl. Statistically, this means that they share
the same information. Thus, for MLR, it is recommended to use just one of these. Considering that HCl has a low correlation with MTLr, it can be dismissed.
SO2 has a low negative correlation with MTLr which is consistent with the results of Grabke et al.
(1995) who suggested that the mass loss of the alloys caused by HCl is reduced by the presence of SO2 in
the atmosphere. The equilibrium of reaction 1 that would cause mass loss is shifted by SO2 to the left side.
Moreover, sulfidation of chlorides takes place according to reaction 2. Nevertheless, sulfidation generates Cl2 which may participate actively in the corrosion process.
(K,Na)2Ca2(SO4)3 + 2 HCl = 2 (K, Na)Cl + 2 CaSO4 + SO2 + H2O + ½ O2 Reaction 1
2(K,Na)Cl + SO2 + ½ O2 = (K, Na)2SO4 + Cl2 Reaction 2
Therefore according to statistical results concerning the atmospheric conditions, the parameters that should be taken into account for modeling are TMetal,%O2 and %H2O or %CO2
Figure 6 shows PCA3 for ash composition in elementary form run for 684 test results with 73% of
cumulative variability. Most of the variables are adequately represented by the F1 axis except for %S and %Ca which are found on the F2 axis, while MTLr as a supplementary variable is poorly represented by the F4 axis (not shown in the diagram). Consequently, the correlations must be interpreted with caution as general trends of the variables’ behavior regarding MTLr. In the diagram, the arrangement of the elements shows their contrasting effect on the melting temperature of the ash and thus on the corrosion rate, four groups can be distinguished. In the first group there are the elements Al, Si, Fe, P that are present as oxides in the ash (Al2O3, SiO2, Fe2O3, P2O5). Among these, Al, Si, Fe each has a very low or negative
correlation with MTLr. This is expected considering that they do not decrease the ash melting temperature.45 During combustion these elements form stable compounds (oxides, silica, alumina) with
high melting temperature. Thus Fe, Al, Si are refractory oxides forming elements within the deposit compared to other deposit elements as these compounds do not decrease ash melting temperature and limit the fraction of molten salts in the deposit. Therefore deposits remain solid avoiding an increase of the corrosion rate at high temperatures.13, 44 The positive correlation of P is expected, because it forms P2O5,
which is a compound that decreases the melting point of the ash and increases the corrosion rate.46
The second group of elements contains Cl and heavy metals Pb, Zn (form chlorides PbCl2, ZnCl2)
which have a positive correlation with MTLr. This is expected because they reduce the melting point of ash thus increasing its corrosiveness. 19 Corrosion rates of alloys increase when the ash contains larger amounts of fused salts since the protective oxide scale formed on the surface of alloys can be destroyed by reaction with fused salts. 1
Figure 6 also shows a third group of elements: S and Ca. The negative correlation of S on the corrosion rate confirms the findings of Kawahara (1997) who showed that when heavy metal sulfates were contained in the ash, they worked to suppress corrosion. 32 Later Becker (2001) confirmed that sulfates are also present in waste incineration ash deposits, but they are typically much lower in concentration than chlorides and are not thought to play a primary role in the corrosion mechanism under the deposits. 14 Ca comes from the compound CaSO4, which explains its high positive correlation with sulfur and its negative
correlation with MTLr. This is also in line with earlier research, which showed that generally, the relative amount of fused salts increases in ash with greater chlorine content, indicating that chlorinated compounds have generally lower melting temperatures than sulfates and oxides. 1 The same argument could be applied for the fourth group containing the alkali metals Na and K which tend to decrease the melting temperature.
2
Na and K are found between Cl and S, which is consistent with the fact that these elements form chlorides (NaCl, KCl) and sulfates (Na2SO4, K2SO4). Therefore, the positive correlation between K and
MTLr is expected and the low negative correlation with Na is not statistically significant.
For the modeling, it seems convenient to include Cl and S, then Al, Si, Fe, Ca grouped as refractory oxides forming elements of the ash, and Na, K, Pb, Zn grouped as melting elements of the ash. 44
As was pointed out above in the PCA1 (Figure 4), since the hot corrosion mechanism is rather
sensitive to the alloy composition, different alloy systems might behave differently under a given environment. Therefore for modeling over a wide range of conditions, it becomes necessary to classify the material’s chemical composition domain in order to model the effect of the variables for a specific class of alloy.
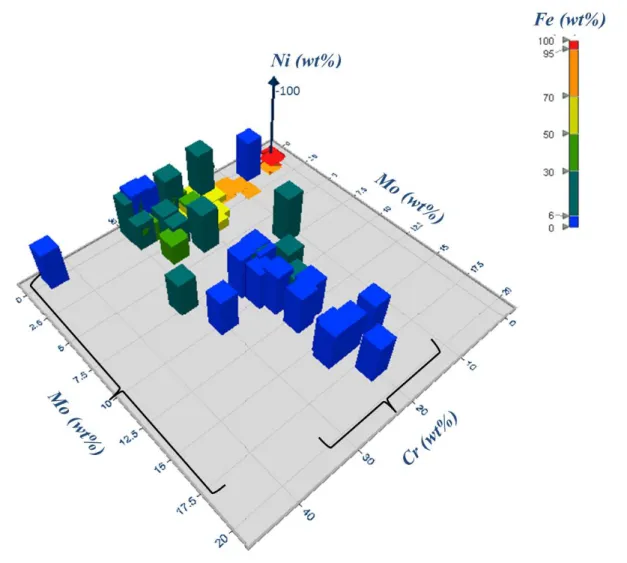
In order to assess the alloy composition domain, Figure 7 shows the 3D diagram of the 72 alloys contained in the database based on the major alloying elements Ni-Cr-Mo as a function of Fe given in (wt%). It can be seen in the diagram that most of the alloys have low levels of Fe and medium or high levels of Ni. The Cr concentrations vary throughout the domain but they range from 10% to 30% while the Mo content is variable ranging from 0.3% to 18.2%.
For a better understanding, Figure 8 shows the surface diagram of the composition domain as a function of Ni content (wt%) which indicates three alloy systems clearly defined: low alloy steels, austenitic stainless steels and Fe/Ni-base high temperature alloys and nickel base alloys. It is well known that high temperature corrosion mechanisms vary depending on the elements present in the alloy. 28 For the purpose of this project the study was focused on the effect of the variables over the austenitic stainless steels and Fe/Ni-base high temperature alloys.
Multiple Linear Regression
A total population of 200 tests results from 10 high temperature corrosion studies 13, 14, 16, 18, 19, 21, 22,
23, 24, 27
performed with austenitic alloys was processed by Multiple Linear Regression (MLR), in order to assess an equation that allows representing the corrosion rates with high accuracy. The summary statistics of the validity domain regarding the variables selected by PCA analysis are shown in Table 2.
In the model, the variables are grouped according to their effect on corrosion kinetics. The variables TMetal (°C), O2 (vol%)Gas, H2O (vol%)Gas represent the environmental conditions, the Cr content (wt%)Alloy
represents the composition of the material, and Cl, S, melting-elements (Na+K+Zn+Pb) and refractory oxides forming elements (Al+Ca+Si+Fe) in (wt%)Ash represent the ash composition. Figure 9 shows the
confidence and 0.0001 tolerance, which are used to compare the relative weights of the variables. The higher the absolute value of a coefficient, the more important the weight of the corresponding variable is, for the model.
Figure 9 confirms the findings of many previous experimental studies in this field. TMetal increases
the corrosion rate; O2 and H2O contribute to form protective oxide layers and therefore tend to decrease
the corrosion rate. S tends to suppress the aggressive effect of Cl in ash, which is critical to the corrosion rate. Al, Ca, Si, Fe as refractory oxide forming elements maintain constant the melting temperature of the ash,45 therefore their negative effect on the corrosion rate is expected. Finally, the melting elements like Na, K, Zn and Pb reduce the melting point of the ash, accelerating corrosion. 1, 2, 13, 14, 29
The determination coefficient obtained for the model was R² = 0.79 and a coefficient R²Adjusted =
0.78. The R² is interpreted as the proportion of the variability of the dependent variable explained by the model. The nearer R² is to 1, the better the model is. But the R² does not take into account the number of variables included in the model. In this sense the adjusted R²Adjusted is a correction of R², which takes into
account the number of variables used in the model. Therefore 79% of the data has been explained by the model. The 21% not explained could be attributed to the variation of the test conditions of the studies involved and to parameters that were not taken into account in the model. The accuracy of the model is shown in Figure 10, where all the predicted values are located in the confidence interval.
In order to validate the model over an isolated system, the data population was randomly split into two groups of equal density in the same validity domain, the first to create the equation of the model and the second for its validation.
Equation (3) shows the best fit obtained by MLR, for MTLr as a function of the most suitable variables according to the statistical criteria applied, as shown in Table 2, MTLr is given in mm/y, TMetal is
given in °C, %Cr in the alloy is given in mass, %O2 and %H2O in the gas are given in volume, and % of
)
3
(
))
(
(
10
3
.
3
...
)
(
2
10
3
.
5
2
10
7
.
1
1
10
1
.
1
...
10
5
.
1
10
4
.
6
10
2
.
3
10
2
.
1
1
.
6
) ( 4 ) ( ) ( ) ( ) ( 1 ) ( 2 2 ) ( 2 1 2 Ash Ash Ash Ash Alloy Gas Gas MetalPb
Zn
K
Na
Cl
Fe
Ca
Si
Al
Cl
S
Cr
O
H
O
T
MTLr
Table 2 also shows the statistics of the validity domain regarding the variables of the model and indicates the applicable limits for the values of the variables used in equation (3). The model can predict corrosion rates for austenitic alloys and Fe/Ni high temperature (chemical composition limits are indicated in Figure 8), exposed at temperatures between 300°C and 725°C, complex atmospheres as well as pure air (according to O2 and H2O gas contents) and ash compositions calculated in elemental form within the
established limits. The interaction factor applied between chlorine and melting elements (𝐶𝑙 𝑥 (𝑁𝑎 + 𝐾 + 𝑍𝑛 + 𝑃𝑏)) aims to enhance the relative weight of chlorides forming elements in the model, since these elements do not act by themselves in the corrosion processes. Corrosion mechanisms as active oxidation and corrosion by molten ash are activated by the presence of alkali metal chlorides (NaCl, KCl) and heavy metal chlorides (ZnCl2, PbCl2) respectively. Therefore, it is the chlorine content which controls the
chlorides formation which are detrimental to the corrosion process.
Figure 11 shows the accuracy of the predictions obtained by Equation (3) with the data used to create the model and the data used for its validation. All the predicted values are located in the confidence interval. The determination coefficient was improved to R² = 0.82 and a coefficient R²Adjusted = 0.81. This
means that 82% of the corrosion rates are explained by the model. The same level of influence of the variables in the model is maintained, which indicates that the prediction coefficients of the model are stable even if there is a decrease in data population. Indeed, for an ideal model the points would all be on the bisector. Although accurate predictions were achieved, the associated error, represented by the confidence interval, corresponds to about ± 0.75 mm/y of the calculated corrosion rate Equation (4).
CONCLUSIONS
The purpose of the current study was to propose a statistical methodology to model the high temperature corrosion mechanisms associated to waste incineration plants while taking into account a major proportion of variables playing a significant role in the corrosion process. By using a large database, the present study confirms experimental findings and therefore helps to understand the role of the variables in the corrosion process in a wide range of conditions. This contributes to the statistical modeling of experimental data in order to obtain acceptable accuracy values despite the variability of the data.
Future trials should simultaneously assess the effects of gas temperature, metal temperature as well as gas velocity, which are known to be important corrosion process variables in industrial process. In the present study, it was not possible to assess these variables because there is not enough available data in the open literature.
The same type of model will be developed for iron based and nickel based alloys. The methods used for this study may be applied to other corrosion mechanisms involved in another industrial process elsewhere in the world, such as metal dusting corrosion in syngas plants.
ACKNOWLEDGEMENTS
This work has been supported by the French National Research Agency with project ANR SCAPAC 11-RMNP-0016 in partnership with VeRI (Veolia Research & Innovation), AIR LIQUIDE, SEDIS and University of Nancy. The authors also thank the Foundation Fundayacucho (Vzla) and Campus France for the PhD grant of S. Camperos.
REFERENCES
1. N. Otsuka, Y. Fukuda, Y. Kawahara, T. Hosoda, “Laboratory corrosion tests for simulating fireside wastage of superheater materials in waste incinerators,” Materials and Corrosion 51 (2000): p. 236.
2. N. Otsuka, “Chemistry and melting characteristics of fireside deposits taken from boiler tubes in waste incinerators” Corrosion Science 53 (2011): p. 2269.
3. I. Wright, H. Krause, “Assessment of factors affecting boiler tube lifetime in waste-fired steam generators: new opportunities for research and technology development,” National Renewable Energy Laboratory (1996): Golden, Colorado.
4. H.J. Grabke, E. Reese, M. Spiegel, “The effects of chloride, hydrogen chloride, and sulfur dioxide in the oxidation of steels below deposits,” Corrosion Science 37 (1995): p.1023.
5. J.E. Strutt, J.R. Nicholls, B. Barbier, “The prediction of corrosion by statistical analysis of corrosion profiles,” Corrosion Science 25, 5 (1985): p. 305.
6. Y. Kawahara, N. Orita, M. Nakamura, S. Ayukawa and T. Hosoda, “Laboratory corrosión tests for simulating fireside Wastage of Superheater Materials in waste incinerator,” CORROSION/99, paper no. 89 (San Antonio,TX, NACE 1999).
7. Y. Kawahara, M. Nakamua, H. Tsuboi, K. Yukawa, “Evaluation of new corrosion resistant superheater tubings in high efficiency waste-to-energy plants,” Corrosion 54, 7 (1998): p. 576 8. A. Ots, "Corrosive-erosive wear mechanism of boiler heat transfer surfaces,” Baltica VI VTT
SYMPOSIUM 233 Life Management and Maintenance for Power Plants Vol. 1 (Helsinki, 2004): p. 187.
9. A. Ruh, M. Spiegel, “Influence of gas composition on kinetics of chloride melt induced corrosion of pure iron,” Materials and Corrosion 57, 3 (2006): p 237.
10. F. Lebel, “Etude des phénomènes de corrosion à haute température en environnement type UVED -Développement d'un pilote laboratoire et quantification des paramètres clés gourvernant les mécanismes,” (PhD’s thesis Université Nancy, 2008).
11. J.M. Brossard, F. Nicol, X. Chaucherie, “Fireside corrosion in energy recovery boilers and maintenance issues,” Proceeding of 7th High Temperature Corrosion and Protection of Materials, Materials Science Forum Vol. 595-598 (Les Embiez –France, 2008), p. 281.
12. ISO/FDIS 17248, “Corrosion of metals and alloys — Test method for high temperature corrosion testing of metallic materials by embedding in salt, ash, or other solids” (Geneva, Switzerland: ISO 2013).
13. E.ON UK(2) Report N°.COAL R267DTI/Pub URN 04/1795C (2004). “Fireside Corrosion of Boiler Materials – Effect of Co-Firing Biomass with Coal,” (Nottingham, UK).
14. B. Baker, G. Smith and L. Shoemaker, “Performance of Commercial Alloys in Simulated Waste Incineration Environments,” CORROSION/2001, paper no. 01183 (Houston, TX: NACE, 2001). 15. B. Baker, G. Smith “High temperature corrosion of iron-base and nickel-base heat resistant alloys in
a simulated waste incineration environment,” INCO Alloys International, Inc, (3)
Private Correspondence.
16. K. Persson, M.Broström, J. Carlsson, A. Nordin, R. Backman “High temperature corrosion in a 65 MW waste to energy plant,” Fuel Processing Technology 88 (2007): p. 1178.
17. R.B. Dooley, A.K. Mehta, EPRI (4) Technical Report 1001352 (2001), “Effect of Chlorine on Waterwall Fireside Corrosion,” (Palo Alto, California).
18. Y. Kawahara, N. Orita, M.Nakamura, S. Ayukawa, T. Hosoda “Application of new corrosion resistant superheater tubings for 500 C°, 100 Kgf/cm2.g high efficiency WTE plant,” CORROSION/99, paper no. 91 (Houston, TX: NACE, 1999).
(2)
E.ON UK (formerly Powergen UK), Ratcliffe-on-Soar 18, Nottingham NG11 0EE
(3)
INCO Alloys International, Inc 3200 Riverside Drive Huntington , West Virginia 25705-1771
(4)EPRI • 3412 Hillview Avenue, Palo Alto, California 94304 • PO Box 10412, Palo Alto, California 94303 •
19. Y. Kawahara, Y.Kaihara, “Recent trends in corrosion resistant tube materials and improvements of corrosion enviroments in WtE plants,”CORROSION/2001 paper no. 01173 (Houston, TX: NACE, 2001).
20. S. Mannan, G. Smith, S. Kiser, “Performance of commercial and developmental corrosion resistant alloys in Simulated Waste Incineration Environments,” CORROSION/2002 paper no. 02387 (Houston, TX: NACE, 2002).
21. M. Noguchi, H. Yakuwa, M. Miyasaka,M. Yokono, A. Matsumoto, K. Miyoshi, K. Kosaka and Y. Fukuda, “Experience of superheater tubes in municipal waste incineration plant” Materials and
Corrosion 51 (2000): p. 774.
22. L. Nylof, E. Hliggblom, “Corrosion of experimental superheater alloys in waste fuel combustion,” CORROSION/97 paper no. 154 (Houston, TX: NACE, 1997).
23. N. Otsuka, Y. Tsukaue, K. Nakagawa, Y.Kawahara, K. Yukawa, “A corrosion mechanism for the fireside wastage of superheater materials in waste incinerators” CORROSION/97 paper no.157 (Houston, TX: NACE, 1997).
24. P.Viklund, A. Hjörnhede, P.Henderson, A. Stålenheim, R. Pettersson, “Corrosion of superheater materials in a waste-to-energy plant,” Fuel Processing Technology 105 (2013): p. 106.
25. Y. Kawahara, “High temperature corrosion mechanisms and effect of alloying elements for materials used in waste incinerations environments,” Corrosion Science 44 (2002): p. 223. 26. .J. Sumner, A. Encinas - Oropesa, N. J. Simms, J.R. Nicholls, “Type II Hot Corrosion: Kinetics
Studies of CMSX-4,” Oxidation of Metals 80 (2013): p. 553.
27. K. Natesan, A. Purohit and D. L Rink, “Fireside Corrosion of Alloys for Combustion Power Plants,” Argonne National Laboratory (5)
(2002).
(5)
28. A. Zahs, M. Spiegel, H. Grabke, “Chloridation and oxidation of iron, chromium, nickel and their alloys in chloridizing and oxidizing atmospheres at 400±700°C,” Corrosion Science 42 (2000): p. 1093.
29. H. Grabke, E. Reese, M. Spiegel, “The effects of chlorides, hydrogen chloride, hydrogen chloride, and sulfur dioxide in the oxidation of steels below deposits,” Corrosion Science 7 (1995): p. 1023. 30. M. Spiegel, “Influence of gas phase composition on the Hot Corrosion of steels and nickel-based
alloys beneath a (Ca-Na-K)-sulfate mixture containing PbSO4 and ZnSO4,” Materials and Corrosion 51 (2000): p. 303.
31. T. Ishitsuka, K. Nose “Stability of protective films in waste incineration enviroment solubility measurement of oxides in molten chlorides,” Corrosion Science 44 (2002): p. 247.
32. Y. Kawahara and M.Kira “Corrosion Prevention of waterwall tube by field metal spraying in MWIP,” Corrosion 53, 3 (1997): p. 241.
33. M. Fukumoto, C. Tachikawame, Y. Matsuzaka, M. Hara, “Formation of Si diffusion layer on stainless steels and their high temperature corrosion resistance in molten salt,” Corrosion Science
56 (2012): p. 105.
34. S. Andersson, E. W. Blomqvist, L. Bäfver, F. Jones, K. Davidsson, J. Froitzheim, M. Karlsson, E. Larsson, J. Liske, “Sulfur recirculation for increased electricity production on Waste-to-Energy plants,” Waste Management 34 (2014): p. 67.
35. W.W. Luo, Z.D. Liu, Y.T. Wang, R.J. Yang, “High Temperature corrosion behaviors of the superheater materials” Procedia Engineering 36 (2012): p. 212.
36. A. Phongphiphat, C. Ryu, Y.B. Yang, K.N. Finney, A. Leyland, V.N. Sharifi, J. Swithenbank, “Investigation into high-temperature corrosion in a large-scale municipal waste to energy plant,”
37. Y.S. Li, M. Spiegel, S. Schimada, “Corrosion behaviour of various model alloys with NaCl-KCl coatings,” Materials Chemisrty and Physics 93 (2005): p. 217.
38. G.D. Smith, D.J. Tillack, S.J. Patel, “Alloy 625 - Impressive Past/Significant presence/Awesome future,” TMS (The Minerals Metals & Materials Society) (2001): p. 35.
39. I. T. Jolliffe, Principal Component Analysis, 2nd ed. (Aberdeen UK: Springer, 2002), p.80
40. G. Y. Lai, High-temperature corrosion of engineering alloys, (Kokomo, USA: ASM International, 1990), p.162.
41. J.P Bailon & J.M Dorlot, Des Materiaux, 3rd ed. (Montreal, CA: Presses Internationales Polytechnique, 2000), p.494.
42. S. Chevalier & J. Favergeon, French Activity on High Temperature Corrosion in Water Vapor, (Zurich, Switzerland: rans Tech Publications Ltd, 2014), p. 65.
43. J.M. Brossard, I. Diop, X. Chaucherie, F. Nicol, C. Rapin and M. Vilasi “Superheater fireside corrosion mechanisms in MSWI plants:Lab-scale study and on-site results,” Materials and
Corrosion 61 (2010): p. 1.
44. W. Spiegel, “Analyse des Rohgases und der Kesselablagerung zur Beurteilung der Ersatzbrennstoff qualität, In: K.J. Thomé-Kozmiensky und M. Beckmann (Hrsg): Energie aus Abfall. Band 1. Neuruppin: TK Verlag, (2008): p. 441.
45. L.A. Hansen, F.J. FRandsen, K. D. Johansen, H.S. Sorensen, “Quantification of fusion in ashes from solid fuel combustion” Thermochimica Acta 326 (1999) p. 105-117
46. R. Boigelot, Gazéification de déchets organiques dans un réacteur à flux entrainé : impact des inorganiques sur le fonctionnement du réacteur et choix des céramiques réfractaires. (PhD’s thesis Université d’Orleans, 2012)
FIGURES
Figure 1. Schematic representation of the database structure
Figure 4. PCA1 for alloys nominal composition a) representation of elements in the F1 and F2 axes (52%
of cumulative variability) b) results of the correlation analysis
Figure 6. PCA3 for ash composition in the form of compounds and elementary form a) representation of
variables in the F1 and F2 axes (73% of cumulative variability) b) results of the correlation analysis
Figure 7. 3D diagram of the composition of the 72 alloys contained in the database, as a function of Fe
Figure 8. 3D surface diagram of the alloys domain contained in the database, distributed as a function of
their Ni content.13-27
Figure 10. Precision of the model, observed MTLr as a function of predicted MTLr
Figure 11. Precision of the model, observed MTLr as a function of predicted MTLr after the validation of