Bose-Einstein Condensation of Atomic Hydrogen
by
Dale G. Fried
B.S. Physics
Washington State University (1992)
Submitted to the Department of Physics
in partial fulfillment of the requirements for the degree of
Doctor of Philosophy
at the
MASSACHUSETTS INSTITUTE OF TECHNOLOGY
June 1999
©
Massachusetts Institute of Technology 1999. All rights reserved.
Author ..
Certified by
MASSACHUSETTS INSTITUTE FIY . . ... LIBRARIES[- -Department of PhysicsMarch 31, 1999
If!.
.. ... .... ... ... ... ..Daniel Kleppner
.. ... ... .Lester Wolfe Professor of Physics
I
Certified by....
/ /Accepted by ...
/Thesis Supervisor
...Thomas J. Greytak
Professor of Physics
Thesis Supervisor
...
Thomas J. Greytak
Chairman, Department of Physics Graduate Committee
Bose-Einstein Condensation of Atomic Hydrogen
by
Dale G. Fried
Submitted to the Department of Physics on March 31, 1999, in partial fulfillment of the
requirements for the degree of Doctor of Philosophy
Abstract
This thesis describes the observation and study of Bose-Einstein condensation (BEC) of magnetically trapped atomic hydrogen. The sample is cooled by magnetic sad-dlepoint and radio frequency evaporation and is studied by laser spectroscopy of the
1S-2S transition in both the Doppler-free and Doppler-sensitive configuration. A
cold collision frequency shift is exploited to infer the density of both the condensate and the non-condensed fraction of the sample. Condensates containing 10 9 atoms are observed in trapped samples containing 5 x 10¹⁰ atoms. The small equilibrium condensate fractions are understood to arise from the very small repulsive interac-tion energy among the condensate atoms and the low evaporative cooling rate, both related to hydrogen's anomalously small ground state s-wave scattering length. Loss from the condensate by dipolar spin-relaxation is counteracted by replenishment from the non-condensed portion of the sample, allowing condensates to exist more than
15 s. A simple computer model of the degenerate system agrees well with the data.
The large condensates and much larger thermal reservoirs should be very useful for the creation of bright coherent atomic beams. Several experiments to improve and
utilize the condensates are suggested.
Attainment of BEC in hydrogen required application of the rf evaporation tech-nique in order to overcome inefficiencies associated with one-dimensional evaporation over the magnetic field saddlepoint which confines the sample axially. The cryogenic apparatus (100 mK) had to be redesigned to accomodate the rf fields of many milli-gauss strength. This required the removal of good electrical conductors from the cell, and the use of a superfluid liquid helium jacket for heat transport. Measurements of heat transport and rf field strength are presented.
The rf fields in the apparatus allow rf ejection spectroscopy to be used to measure the trap minimum as well as the temperature of the sample.
Thesis Supervisor: Daniel Kleppner Title: Lester Wolfe Professor of Physics Thesis Supervisor: Thomas J. Greytak Title: Professor of Physics
Acknowledgments
This thesis is dedicated to Jesus Christ, who I understand to be the One who created quantum mechanics, and indeed all of physics and the whole of the entire universe. The extremely rich and subtle complexity of the physical world, and that of quantum systems such as dilute gases at low temperatures and high densities in particular, give me reason to worship Him as an amazing intelligence with creativity and complexity much farther beyond the grasp of the human mind than the physics described in this thesis is beyond the grasp of my sister-in-law's golden retriever. As I understand it, our Creator's deep love for us has caused Him to initiate relationship with us, a relationship that has implications far beyond our activities here. For this, too, I worship Him and give to Him my loyalty. He is the King of the Universe.
Having gratefully acknowledged the Inventor of the physics studied in this thesis, I also gratefully acknowledge my parents, Ray and Twyla, and my brother, Glenn, who patiently but thoroughly instilled in me a pleasure in working hard, a curiosity about the world, a self-confidence that has allowed me to take risks. Their encouragement and interest during my graduate work has been unwavering, a crucial help when I myself was wavering.
As Daniel Kleppner says, one of the important roles of a thesis advisor is to ask a good question. He and my other advisor, Thomas Greytak, have done this superbly. I am grateful to both of them for allowing me to work in their research group and for
supporting me financially. Their intellectual commitment to the research and their personal commitment to me as a student have made my years at MIT a pleasure.
Much of a graduate education comes through one's co-workers, and much of the pleasure comes through the camaraderie and friendship in the research group. I am fortunate to have worked with many world-class colleagues during my time at MIT.
Mike Yoo, my first office mate, helped me learn practical skills, such as program-ming "makefiles", and also helped me shoulder responsibilities with confidence. His cheerful insights into graduate student life helped take the edge off all night problem sets.
John Doyle, a postdoc when I started in the group, taught me the power of back of the envelope calculations and modeled a systematic, bold approach to solving problems. He has been a continuing encouragement during my graduate career.
Jon Sandberg's helpful ability to teach me the basics of the experiment planted the seed in my head that one day I would be able to run the experiment, too. His confidence in the "younger generation" has helped me push through times of discour-agement.
Albert Yu's cheerily optimistic "there is no problem which cannot be solved" has been my rallying cry more than once. Albert's friendship is typified by generous hospitality, including one night when he met me after I was mugged on the subway.
Claudio Cesar contributed a contagious creativity to the experiment, and a fun demeanor to life in the lab. His optimism and encouragement helped me move toward
more of a leadership position. His friendship has helped me maintain perspective. Adam Polcyn joined the experiment the same year I did. Beginning with the finding that our tastes in used books were compatible, I have enjoyed my friendship
with him immensely. I often rely on him for reality checks both in my physics and in life.
Thomas Killian has been my primary colleague over the most recent several years of work. I learned an intellectual thoroughness from his agile and deep approach to physics. His excitement and engagement with the experiment has made long nights in the lab fruitful and enjoyable.
David Landhuis joined the group more recently. His work to rigorously understand physics is very welcome, as is his cheerful willingness to carry out thankless lab chores such as being the safety officer. Dave's friendship makes work in the lab a pleasure.
Stephen Moss, my new office mate, also brings a tenacious quest for deep under-standing to the experiment. His sense of humor, humility, and flexibility are much appreciated. His friendship significantly adds to the fun of working in this research group.
Lorenz Willmann, who joined the group two years ago as a postdoc, has taught me about experiment documentation and data analysis. His calm manner has brought a broader perspective to problems that loomed large in my thinking.
I am confident of a bright future for this experiment in the capable hands of Dave, Stephen, and Lorenz.
Finally, I wish to thank my wife, Diana, for marrying me and giving me her love. I met her three years ago at a French abbey on Easter, while traveling after a physics conference at Les Houches in the French Alps. She has made the last three years of my life meaningful and joyful. I am deeply grateful for her patience and sacrifice during the sometimes long days and nights I have spent in the lab.
Contents
1 Introduction
1.1 The Lure of Bose-Einstein Condensation . . . .
1.2 The Significance of the Work in this Thesis . . .
1.3 The Basics of Trapping and Cooling Hydrogen 2 Theoretical Considerations
2.1 Dimensionality of Evaporation . . . . 2.2 Degenerate Bose Gas . . . . 2.2.1 Bose Distribution . . . . 2.2.2 Description of the Condensate . . . .
2.3 Properties of a Bose-Condensed Gas of Hydrogen
2.3.1 2.3.2 2.3.3
2.3.4
Relative Condensate Density . . .
Achievable Condensate Fractions
Condensate Feeding Rate . . . .
Ultimate Condensate Population
3 Implementing RF Evaporation
3.1 Magnetic Hyperfine Resonance . . . . 3.1.1 H in a Static Magnetic Field . . . . 3A.2 H in an RF Magnetic Field . . . . 3.1.3 RF Field Amplitude Requirement . . . .
3.1.4 RF Coil Design . . . .
3.2 Mechanical Design of the Cell . . . .
3.2.1 Exclusion of Good Electrical Conductors
3.2.2 Design of the Superfluid Jacket . . . . .
3.3 Construction Details . . . .
3.3.1 Materials and Sealing Techniques . . . . 3.3.2 Sintering . . . .
3.3.3 Bolom eter . . . . 3.3.4 Pressure Relief Valve . . . . 3.4 Measurements of Cell Properties . . . .
3.4.1 Measurements of RF Field Strength . . .
3.4.2 Thermal Conductivity . . . . 3.4.3 Heat Capacity . . . . 3.4.4 RF Heating . . . . 15 . . . . . 15 . . . . . 16 . . . . . 16 21 . . . . 21 . . . . 24 . . . . 24 . . . . 26 . . . . 29 . . . . 29 . . . . 30 . . . . 35 . . . . 36 39 . . . . 40 . . . . 40 . . . . 42 . . . . 43 . . . . 44 . . . . 46 . . . . 47 . . . . 49 . . . . 53 . . . . 53 . . . . 54 . . . . 55 . . . . 55 . . . . 56 . . . . 56 . . . . 57 . . . . 60 . . . . 61 . . .
4 Manipulating Cold Hydrogen by RF Resonance
4.1 RF Evaporation . . . .. ... . . . .. . . . . .
4.1.1 Need for RF Evaporation: Orbits with Long Escape Times . . 4.1.2 M ixing of Energy . . . . 4.1.3 RF Field Strength Required for Evaporation . . . . 4.2 RF Ejection Spectroscopy . . . . 4.2.1 Ambiguities of the Trap Dump Technique . . . .
4.2.2 Theory of RF Ejection Spectroscopy of a Trapped Gas . . . .
4.2.3 4.2.4 4.2.5 4.2.6
Bolom etric Detection . . . . Measuring the Trap Bias Field . . . . Measuring the Effective RF Field Strength . . . . Determining the Sample Temperature by RF Ejection Spec-troscopy ... ... ... . . . .... .. . . . 5 Observation of BEC
5.1 Laser Spectroscopy of Trapped Hydrogen . . . .
5.1.1 Spectroscopy of the 1S-2S Transition . . . . .
5.1.2 Experimental Technique . . . .
5.1.3 The 1S-2S Spectrum of a Non-Degenerate Gas
5.2 Cooling into the Degenerate Regime . . . .
5.2.1 Cooling Paths . . . .
5.2.2 Evaporation Strategies . . . .
5.3 Spectroscopic Study of the Degenerate Gas . . . .
5.3.1 Peak Condensate Density . . . .
5.3.2 Sample Temperature . . . .
5.3.3 Condensate Fraction . . . . 5.4 Time Evolution of the Degenerate Gas . . . .
5.5 5.6
Signature of Quantum Degeneracy in Spectrum of Normal Gas . . . .
Density Shift for Excitation out of the Condensate and the Normal Gas
6 Conclusion
6.1 Summary and Significance of this Work . . . .
6.2 Improvements to the Apparatus . . . .
6.3 Suggestions for Experiments . . . .
6.3.1 Creating Bigger Bose Condensates . . . . 6.3.2 Probing the Velocity Distribution of the Normal Component of
a Degenerate G as . . . .
6.3.3 Creation of an Atom Laser . . . . 6.3.4 Measuring the Condensate Density through Dipolar Decay . . 6.3.5 Exchange Effects in Cold-Collision Frequency Shift . . . .
6.3.6 Measuring ais-Is . . . .. . . . . . . . 6.3.7 Dynamics of 2S atoms in IS condensate . . . . 6.4 O utlook . . . . 63 63 63 65 66 68 68 69 71 73 73 75 79 . . . . 79 . . . . 80 . . . . 81 . . . . 82 . . . . 83 . . . . 84 . . . . 88 . . . . 89 . . . . 89 . . . . 92 . . . . 97 . . . . 98 102 104 105 105 105 106 107 107 108 110 110 111 112 112
A Theory of Trapped Classical Gas 113
A .1 Ideal G as . . . 113
A.1.1 Occupation Function . . . 114
A.1.2 Density of States . . . 114
A.1.3 Properties of the Gas . . . 115
A.1.4 Dipolar Decay . . . 118
A.2 Collisions and Evaporative Cooling . . . 121
A.2.1 Evaporative Cooling Rate . . . 122
A.2.2 Equilibrium Temperature . . . 123
A.2.3 Forced Evaporative Cooling . . . 125
B Fraction of Collisions Which Produce an Energetic Atom 129 C Behavior of Non-Condensed Fraction of a Degenerate Gas 133 C.1 Ideal Degenerate Bose Gas . . . . 133
C .1.1 D ensity . . . . 133
C.1.2 Kinetic Energy . . . 135
C.1.3 Population . . . 135
C.1.4 Total Energy . . . 136
C.2 Dipolar Decay . . . 138
D Model of the Dynamics of the Non-Degenerate Gas 143 D .1 O verview . . . 143
D.1.1 Approximations . . . . 143
D.1.2 Describing the Trap . . . 143
D.2 Statistical Mechanical Description of the Gas . . . 144
D .2.1 Variables . . . . 144
D.2.2 Computing Properties of the Gas . . . 144
D.3 Treatment of Physical Effects . . . 145
D.3.1 Evaporation . . . 145
D.3.2 Dipolar Spin Relaxation . . . 145
D.3.3 Trap Shape Changes . . . 145
D.3.4 Skimming Energetic Atoms . . . 146
D.4 Software Implementation . . . 146
D.4.1 Program Flow . . . 147
D.4.2 Data Structure . . . 147
E Bose-Einstein Velocity Distribution Function 149 E.1 Velocity Distribution . . . 149
E.2 Spectral Signature of Velocity Distribution . . . 151
F Model of the Dynamics of the Degenerate Gas 155 F .1 O verview . . . 155
F.2 Simulation Details . . . . 156
G Trap Shape Uncertainties
H Symbols 161
I Laboratory Units for Energy 163
Bibliography 165
List of Figures
1-1 hyperfine-Zeeman diagram of atomic hydrogen . . . . 1-2 cutaway view of apparatus . . . . 2-1 Maxwell-Boltzmann and Bose-Einstein population distributions 2-2 diagram of losses from trapped gas system .
2-3 behavior of C(77, 0,
f
= 0) . . . . 3-1 3-2 3-3 3-4 3-5 3-6 3-7 3-8 3-9 3-10 3-11 3-12 3-13 3-14 3-15low-field Zeeman diagram of hydrogen . . . .
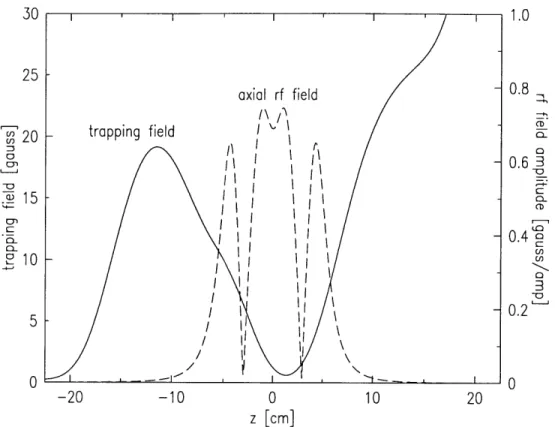
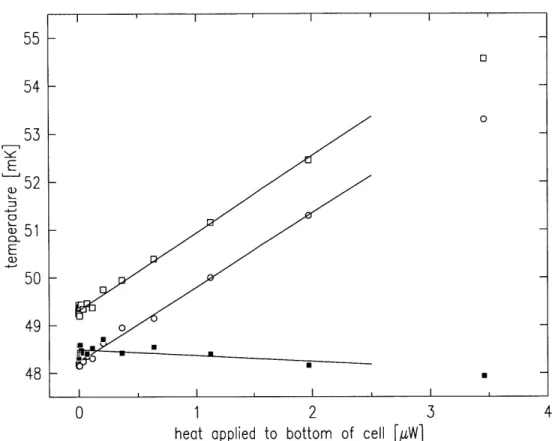
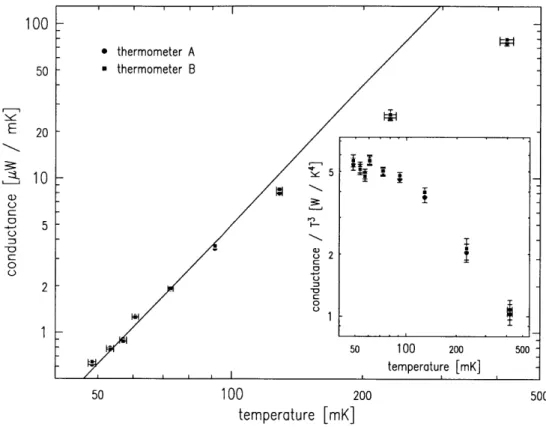
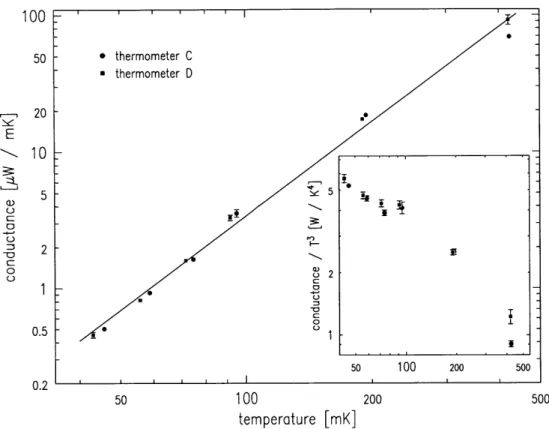
direction of trapping field . . . . winding pattern of axial rf coil . . . . rf and trapping fields . . . . rf field strength along the trap axis . . . . winding pattern of transverse rf coil . . . . geometry for calculation of rf eddy currents . . cross-section through top of cell . . . . cross-section through bottom of cell . . . . pressure relief valve . . . . frequency response of rf coils . . . . response of cell to heat applied at the bottom thermal conductance of the cell . . . . thermal conductance of the Ag sinter . . . . . cooling rate of cell . . . .
demonstration of long escape times . . . . slow mixing of energy from axial to transverse degrees rf power required for evaporation . . . .
impulse response of bolometric detection system . . .
measurement of 0 by rf ejection . . . .
ejection efficiency of rf coils . . . . frequency response of rf coils modeled . . . . probing distribution of total and potential energy . . rf spectrum of 30 pK sample . . . . spectrum of non-degenerate trapped hydrogen gas . . Doppler-free spectra at various sample densities . . .
schematic diagram of trap shape during cooling . . .
. . . . 64 of freedom . . 65 . . . . 67 . . . . 72 . . . . 74 . . . . 75 . . . . 76 . . . . 77 . . . . 78 83 84 85 17 18 25 . . . . 3 1 . . . . 33 . . . . 4 1 . . . . 44 . . . . 4 5 . . . . 46 . . . . 4 7 . . . . 4 8 . . . . 4 9 . . . . 50 . . . . 5 3 . . . . 56 . . . . 58 . . . . 59 . . . . 60 . . . . 6 1 . . . . 6 2 4-1 4-2 4-3 4-4 4-5 4-6 4-7 4-8 4-9 5-1 5-2 5-3
5-4 5-5 5-6 5-7 5-8 5-9 5-10 5-11 5-12
path of sample through n-T space as it is cooled into degenerate regime 87
Doppler-sensitive spectrum of degenerate gas . . . . 90
Doppler-free spectrum of degenerate gas . . . . 91
extracting temperature from Doppler-sensitive spectrum of normal gas 95 calculated condensate fraction as a function of temperature . . . . 97
time evolution of Doppler-sensitive spectrum of condensate . . . . 99
time evolution of Doppler-free spectrum of condensate . . . . 100
time evolution of peak density of condensate . . . . 101
Doppler-free spectra of normal gas in quantum degenerate regime . . 103
A-i behavior of P(q, r/) . . . . A-2 effects of truncation on density . . . . A-3 the volume for dipolar decay . . . . A-4 mean kinetic energy of atoms in a trap of finite depth . A-5 average energy of a relaxing atom . . . . A-6 evaporation volume Vep . . . . A-7 evaporation volume Xevap . . . . A-8 graphical solution of heating/cooling balance equation . B-i fraction of collisions which produce an energetic atom . C-1 behavior of T1/2 . . . . C-2 behavior of A0 . . . . C-3 behavior of A1 . . . . C-4 behavior of E for a degenerate Bose gas . . . . C-5 behavior of Q, for a degenerate Bose gas . . . . C-6 behavior of Q2 for a degenerate Bose gas . . . . C-7 average energy of a relaxing atom for a degenerate Bose gas . . . . . E-i behavior of T o . . . . E-2 distribution of velocities for various effective trap depths . . . . E-3 comparison of velocity distributions for classical and degenerate quan-tum sam ples . . . . E-4 how the small laser beam preferentially excites low energy atoms . . . E-5 Doppler-sensitive lineshape for a quantum degenerate gas . . . . G-1 calculation of potential energy profile in trap A . . . . . . . . 117 . . . . 118 . . . . 120 . . . . 121 . . . . 122 . . . . 123 . . . . 124 . . . . 125 131 134 136 137 138 139 140 141 150 151 152 153 154 159
List of Tables
2.1 comparison of density ratios . . . . 30
2.2 comparison of heating-cooling parameters . . . . 34
2.3 comparison of limits on number of trapped atoms . . . . 37
5.1 summary of trap parameters . . . . 86
Chapter 1
Introduction
1.1
The Lure of Bose-Einstein Condensation
Bose-Einstein condensation (BEC) of a dilute gas has been a very important goal since the beginning of experimental research on spin-polarized atomic hydrogen. The original intent [1] was to study quantum phase transition behavior and search for superfluidity in this dilute gas, a weakly interacting system that is much more the-oretically tractable than strongly interacting degenerate quantum systems such as superfluid liquid 4He. This phase transition is a purely quantum mechanical effect, and, unlike all other phase transitions, it occurs in the absence of any interparticle interactions.
Although the search for BEC in dilute gases began in spin-polarized hydrogen, the first observations of the effect used dilute gases of the alkali metal atoms Rb [2], Na [3}r-and Li [4, 5] in the summer of 1995. The properties of hydrogen that were so attractive in the beginning turned out, in the end, to be irrelevant or even a hindrance. Nevertheless, we have finally observed BEC in hydrogen [6, 7]. In several ways our hydrogen condensates are rather different from those of the alkalis, and we use different techniques to probe the sample. Hydrogen thus contributes significantly to the extraordinary flurry of experimental activity creating and probing Bose condensates, and applying them to intriguing new areas.
The formation of a Bose condensate out of a gas can be studied as the occurrence of a quantum mechanical phase transition, but perhaps even more interesting are the properties of the condensate itself. Centered in the middle of a trapped gas, this collection of atoms exhibits such bizarre effects as a vanishingly small kinetic energy, long range coherence across the condensate [8], a single macroscopic quantum state, immiscibilty of two components of a gas [9, 10], and constructive/destructive interference between atoms that have fallen many millimeters out of the cloud [11]. These systems hold promise for creating quantum entanglement of huge numbers of atoms for use in quantum computing and vastly improved fundamental measurements.
1.2
The Significance of the Work in this Thesis
In this thesis we describe the culmination of a 22 year research effort: the first ob-servations of BEC in hydrogen1. Furthermore, we demonstrate a new technique of probing Bose condensates, optical spectroscopy. This tool allows us to measure the density and momentum distributions of the sample, and thus infer the temperature, size of the condensate, and other properties. We find that the condensates we create contain nearly two orders of magnitude more atoms than other BEC systems, and the condensates occupy a much larger volume. In addition, we find that nearly 1010 atoms are condensed during the 10 s lifetime of the condensate. This high flux of condensate atoms implies that this system might be ideal for creation of bright, co-herent atomic beams. Indeed, hydrogen has proven to be a rich and promising atom for further studies of BEC.
The thesis is divided as follows. Chapter 2 and the associated appendices provide a detailed description of the behavior of the trapped gas both in the classical and quantum mechanical regimes. Results are obtained to guide the reader's intuition throughout the remainder of the thesis. Chapter 3 describes changes to the apparatus that allowed BEC to be achieved. Chapter 4 details use of the new capabilities of the improved apparatus. The most important contributions described in this thesis are found in chapter 5 where studies of BEC are presented. Finally, conclusions and suggestions for future work are made in chapter 6.
Much of the work described here was done in close collaboration with a group of people, as shown by the several names on our papers. In particular, this thesis should be considered a companion thesis to that of Thomas Killian
[13].
Both should be read to obtain a complete picture of the whole experiment. The work builds on ear-lier work by Claudio Cesar, whose thesis [14] describes the first 1S-2S spectroscopy of trapped atomic hydrogen; Albert Yu, whose thesis [15] on universal quantum re-flection includes important insights into non-ergodic atomic motion in the trap; Jon Sandberg, whose thesis[16]
describes the physics of 1S-2S spectroscopy in a trap and the development of the uv laser system we use; and John Doyle, whose thesis [17] describes trapping and cooling of spin-polarized hydrogen and the magnet system we use to trap the gas.1.3
The Basics of Trapping and Cooling Hydrogen
There is a long and interesting history of spin-polarized hydrogen in the laboratory, summarized well by Greytak [18]. Here we briefly summarize our method of creating spin-polarized hydrogen, loading it into a trap, and cooling it to BEC (quantum degeneracy). A broader description is in the thesis of Killian [13].
Hydrogen is composed of a proton and electron, whose spins can couple in four ways: the four hyperfine states are labeled a-d (these states are derived in section
'A two dimensional analog of BEC has been observed very recently in atomic hydrogen confined
200 d 100 C E 0 b -100 G -200 0 500 1000 1500 2000 2500
magnetic field [Gauss]
Figure 1-1: Hyperfine-Zeeman diagram of ground state atomic hydrogen. The eigen-states of the combined hyperfine and Zeeman Hamiltonian are described in section
3.1. Atoms in states c and d can be trapped in a magnetic field minimum.
3.1.1). The high-field seeking states (a and b) are pulled toward regions of high magnetic field, and the low-field seeking states (c and d) are expelled from high field
regions. Figure 1-1 shows the energies of the four states as a function of field strength. Our experiments use the pure, doubly-polarized d-state.
At the beginning of an experimental run molecular hydrogen is loaded into the cryogenic apparatus by blowing a mixture of H2 and 4He into a cold (T ~_ 1 K) can, called the dissociator, where it freezes. Then, for each loading of the trap, H2 molecules are dissociated by pulsing an rf discharge (the dissociator is in a region
of high magnetic field, 4 T). The low field seekers are blown into a confinement cell (4 cm diameter, 60 cm length), over which the inhomogeneous trapping field is super-imposed. The trap fields are created by currents in superconducting coils, described by Doyle [17] and Sandberg [16]. The coils create a trap with maximum depth 0.82 T, which, for hydrogen's magnetic moment of 1 Bohr magneton, corresponds to an en-ergy ct/kB = 550 mK. (See appendix I for conversions between various manifestations of energy in this experiment.) The trap depth is the difference between the field at
the walls of the containment cell and the minimum field in the middle of the cell. There are seventeen independently controlled coils in the apparatus which are used to adjust the trap shape. Figure 1-2 is a cutaway diagram of the system. Expanded views of the top and bottom of the cell are in figures 3-8 and 3-9. The trap shape used for capturing the atoms is basically a long trough. The field increases linearly
thermal anchor
lqihdiprofile along cell axis
wido source magnet
dissociator
upper pinch coil
quadrupole coils trapped atoms
liquid helium
confinement cell
lower pinch coil
retro mirror MgF window kevlar string Lyman-alpha filter MCP detector B(r=O,z) 4 3 2 1 Tesla
Figure 1-2: Cutaway view of apparatus. Molecular hydrogen is dissociated in an rf discharge in a 4 tesla region. The atoms move into the confinement cell which has superimposed on it a trap, created by the quadrupole coils (radial confinement) and the pinch coils (axial confinement). The coils are bathed in 4.2 K liquid helium. The cell is centered in the vacuum can with three Kevlar strings. It is thermally anchored to the mixing chamber of a dilution refrigerator (not shown). The laser beam passes through the upper window, retroreflects on the mirror at the bottom of the cell, and exits through the upper window. Atomic fluorescence photons pass through the MgF window and Lyman-a filter, and are counted on the microchannel plate detector.
away from the z axis of the trap (the potential exhibits near cylindrical symmetry about the z axis); the potential is small and roughly uniform for about 20 cm along the z axis. "Pinch" coils at each end provide the axial confinement. The field profile indicated in figure 1-2 is along the z axis of the cell.
The trap depth sets an energy scale: for atoms to be trapped their total energy must be less than the trap depth. Two techniques are used to cool the atoms into the trap. First, after H2 molecules are dissociated [17, 19] the hot atoms are thermalized
on the walls of the cell, held at 275 mK. In order to prevent the atoms from sticking tightly to the cold surfaces, a superfluid 4He film covers the walls and reduces the binding energy of the H atoms to a manageable 1.0 K [20, 21, 22]. When the atoms leave the wall their total energy (3kBT/2 of kinetic energy and ct of potential energy) is still greater than the trap depth. The second stage of cooling into the trap involves collisions among the atoms that are crossing the trapping region. Sometimes these collisions result in one atom having low enough energy to become trapped. The partner atom in the collision goes to the wall and is thermalized. The gas densities expected in the cell correspond to a collision length many times greater than the cell diameter, so atoms pass through the trapping region many times before becoming trapped. A recent study of the trap loading process will be published elsewhere [19].
After loading the trap, the cell walls are quickly cooled to below 150 mK to ther-mally disconnect the sample from the confinement cell. At these lower temperatures the residence time of an atom on the surface of the cell becomes much longer than the characteristic H+-H-+ H2 recombination time, and so the surface is "sticky"; all the
atoms that reach the surface recombine before having a chance to leave the surface. Thermal disconnect between the cryogenic cell and the trapped sample is achieved because no warm particles can leave the walls and carry energy to the trapped gas. Atoms can leave the trapped gas and reach the wall, however, if they have large enough total energy to climb the magnetic hill. As these very energetic atoms irre-versibly leave the trapped sample, it cools. In fact, this preferential removal of the most energetic atoms, called evaporation, is very useful. It is the cooling mechanism we exploit to create samples as cold as 20 pK, as described in chapter 5. A thorough description of the heating and cooling processes which set the temperature of the system is found in appendix A.
We catch both the d and c low field seeking states in the trap. However, inelastic collision processes involving two c state atoms quickly deplete the c-state population, and the remaining atoms constitute a doubly polarized sample (both electron and proton spins are polarized). Because the spin state is pure, the spin-relaxation rate is rather small. For peak densities in the normal gas of n ~ 1014 cm-3 (nearly the largest for these experiments) the characteristic decay time is 40 s.
The trapped gas is probed using various techniques. The simplest method involves quickly lowering the magnetic confinement barrier at one end of the trap, and mea-suring the flux of escaping atoms as a function of barrier height [17, 23]. In a limited regime this technique can be used to infer the gas temperature and density. This tech-nique, and its limitations, is described in chapter 4. Another technique is rf ejection spectroscopy, described in chapter 4. The third probe technique is laser spectroscopy of the 1S-2S transition, envisioned [24, 16], realized [14, 25], and perfected [13] in our
lab for a trapped gas. This diagnostic tool can give the density and temperature of the gas over a wider range of operating conditions than the other techniques, and has proven crucial for studies of BEC. The laser probe will be described in more detail in chapter 5, and is a principle subject of the companion thesis by Killian [13].
Chapter 2
Theoretical Considerations
This chapter addresses two important topics from a theoretical perspective. First, we explain why previous experiments could not bring trapped hydrogen into the quantum degenerate regime. This understanding allowed us to solve the problem and achieve
BEC. The second topic is related to the small fraction (only a few percent) of atoms
we are able to put into the condensate. This situation differs markedly from that observed in Rb and Na BEC experiments. An explanation of this difference and others is the second topic we explore theoretically.
The starting point for understanding the behavior of the trapped gas is classical statistical mechanics. Good explanations have been developed elsewhere [26, 27, 17,
28]. For completeness, we present a development in appendix A. Since the gas exists in a trap of finite depth Et, we use a truncated Maxwell-Boltzmann occupation function. Knowledge of the trap shape allows us to calculate the population, total
energy, density, etc. The effects of truncation of the energy distribution at the trap depth are included in these derivations. We see that for deep traps (r7 _ ct/kBT > 7) the truncation does not significantly alter the properties of the system from estimates based on an untruncated distribution. Appendix A also explains the density of states functions (see section A.1.2) used in the remainder of the thesis and summarizes evaporative cooling (see section A.2).
2.1
Dimensionality of Evaporation
The temperature of the gas is set by a balance between heating and cooling processes, as described in section A.2.2. Previous attempts to attain BEC in hydrogen [29, 30] failed because the cooling process became bottlenecked by the slow rate at which energetic atoms could escape, thus reducing the effective cooling rate. To understand this bottleneck we must first consider the details of the trap shape. We then study the motion of the particles that have enough energy to escape.
The trap shape used to confine samples at T < 200 pK is often called the "Ioffe-Pritchard" [31, 26] type (labeled "IP"). Using axial coordinate z and radial coordinate
p, the potential has the form
V1P(p, z) = (ap)2 + (3z 2 + -0 (2.1)
with radial potential energy gradient a (units energy/length), axial potential energy curvature 2/ (units of energy/length2), and bias potential energy 0. See section A.1.2
for a summary of the density of states functions for this trap.
In the limit of p < 0/a, the Joffe-Pritchard potential is harmonic in the radial coordinate, as may be seen by expanding the potential in powers of ap/(13z2 + 0):
VP (pZ)/ 2 1 a 2 1 a P (2.2)
2 OZ2 + 0 8 (3z2 + 0)2
The trap is harmonic in the radial direction when the third term is much smaller than the second term. This is true for radial coordinates p < Panharm, where we have defined the "anharmonic radius" at which the second term matches the third term:
/3z2 + 0
Panharm= 4 . (2.3)
The trap appears harmonic in all three directions to short samples for which the radial oscillation frequency is essentially uniform along the length of the sample. This occurs for temperatures T < 40
/kB.
In the harmonic regime, the axial oscillation frequencyis
22
= 3 (2.4)
m
and the radial oscillation frequency is
m
WP = a . (2.5)
/z 2 + 0
For the evaporation to proceed efficiently, atoms with energy greater than the trap depth et (called "energetic atoms") must leave the trap promptly, before having a collision. As shown in appendix B, in the vast majority of cases an energetic atom that collides with a trapped atom will become trapped again. The rare collision that produced the energetic atom will be "wasted". It is essential to understand the details of the particle removal process if maximum evaporation efficiency is to be achieved.
Previous attempts to cool hydrogen to BEC utilized "saddlepoint evaporation", in which energetic atoms escape over a saddlepoint in the magnetic field barrier at one end of the trap. To escape, the atom must have energy in the axial degree of freedom (z) that is greater than ct. This atom removal technique is inherently one dimensional. The collisions which drive evaporation produce many atoms with high energy in the radial degrees of freedom, and in order for these to escape the energy must be transferred to the axial degree of freedom. This energy transfer process was analyzed theoretically by Surkov, Walraven, and Shlyapnikov
[32],
and we follow their analysis.In a harmonic trap the potential is separable, and the particle motion is com-pletely regular; no energy exchange occurs. In the loffe-Pritchard trap, however, energy exchange can occur because the potential is not separable; the radial oscilla-tion frequency depends on the axial coordinate, z, and so radial mooscilla-tion can couple to axial motion. (See equation 2.5.)
This energy mixing can be understood by considering how rapidly the radial oscil-lation frequency changes as an atom moves along the z axis. If the frequency changes
slowly ("adiabatically"), then the energy will not mix among the degrees of freedom.
The adiabaticity parameter is the fractional change of the radial oscillation frequency in one oscillation period as the atom moves axially through the trap. Strong mixing occurs when
2~ . (2.6)
w2
Here cb = (dwp/dz)(dz/dt). For a Ioffe-Pritchard trap with a bias that is large
compared to kBT, wp = a/(3z 2 + O)m. We have used the expansion of VIP from
equation 2.2, which is valid if kBT ap < 0. Given that kBT < 0, the adiabaticity
parameter is
= 3 zm
(2.7)
W2 aV/3z2+0"
We see that several factors contribute to good mixing: large axial velocity v2 (which occurs at high temperature), small radial gradient a, small bias field 0, and large axial curvature 3. In practice, however, achieving BEC requires low temperatures
(v2 small) and high densities (obtained with large compressions, and thus large a).
Consequently, the degrees of freedom do not mix and evaporation becomes essen-tially one dimensional. Typical values for our experiment are a/kB 16 mK/cm, 3/kB= 25 pK/cm2, 0/kB = 30 pK, T = 100 pK, z ~ 2 cm, and v= 140 cm/s, so
that -/W ~_ 10-3 . For these conditions it takes about 103 oscillations to transfer
energy, but there are only about wp/27FFcOj ~ 200 oscillations per collision for a peak sample density no = 1014 cm-3 (fc, is the elastic collision rate, p121). There is not
enough time to transfer the radial energy to axial energy before the particle has a col-lision. The energy mixing is thus very weak and the evaporation is one dimensional. Surkov et al. [32] pointed out the consequences of one-dimensional evaporation. They estimated that the efficiency is reduced by a factor of 4rT compared to that of full 3D evaporation. The evaporative cooling power thus drops dramatically. Experiments in our laboratory (unpublished) have confirmed that phase space compression ceases near 100 pK. These results were duplicated and studied in more depth by Pinkse et
al. [30].
In order to maintain the evaporation efficiency a technique is required that quickly removes all particles with energy greater than the trap depth. To this end we imple-mented rf evaporation, as described in detail in chapter 3.
2.2
Degenerate Bose Gas
2.2.1
Bose Distribution
The statistical mechanical description of a classical gas, presented in appendix A, is not correct when quantum effects are important. A simple way to understand the crossover to the quantum regime is to recall that particles are characterized by wavepackets whose size is related to their momentum by the Heisenberg momentum-position uncertainty relation. As a gas is cooled, the particle momenta decrease, and the wavepackets enlarge. The classical (point-particle) description of the system breaks down when these wavepackets begin to overlap. The quantum treatment cor-rectly deals with the effect of particle indistinguishability. There are many excellent treatments of quantum statistical mechanics [33]. Here we review the basic features that are important for our experiment.
A collection of identical particles with integer (half-integer) spins must have a total
wavefunction that is symmetric (anti-symmetric) when two particles are exchanged. The connection between spin and symmetry has been explained using relativistic quantum field theory [34]. Particles with integer (half-integer) spin are called bosons (fermions). In contrast to fermions, multiple bosons may occupy a single quantum state.
The occupation function for a gas of N identical bosons in a box of volume V, and
in the limit of N -+ oc and V -+ oc but constant N/V, is called the Bose-Einstein
occupation function
[33]
1
fBE(E exp(-I)/kBT -1' (2.8)
where 1 and T are Lagrange multipliers which constrain the system to exhibit the correct population and total energy through the conditions
= dc 1 fBE() (2.9) V V and = dE c fBE(E)- (2.10) V V
The physical interpretation of these parameters is that p is the chemical potential and T is the temperature. Figure 2-1 shows the energy distribution of the population in the trap for a classical gas described by the Maxwell-Boltzmann (MB) distribution and for a quantum gas described by the Bose-Einstein (BE) distribution. The two functions shown describe systems with identical peak densities, a parameter relevant to the creation of a condensate. The MB distribution requires many more particles than the BE to create the same peak density because the atoms are distributed at higher energies, further from the center of the trap.
The difference between the BE and MB distributions originates in the different assumptions about particle distinguishability. To intuitively understand this, we con-sider the outcome of these differing assumptions for sparsely and densely occupied sets of energy states. In the classical treatment there are many ways to arrange the
/IN A/kBT =-0. 1. / Nl N11 /kBT - 1. N 0 2 4 6 8 total energy,
/
kBTFigure 2-1: Comparison of Maxwell-Boltzmann (dashed line) and Bose-Einstein (solid
line) distributions of particle energies, plotted for various chemical potentials. The peak density, a quantity related to the onset of BEC and to evaporation and decay rates, is identical for each pair of curves. The vertical axis is the number of atoms with the given energy. This is proportional to the occupation function weighted by the total energy density of states for a Ioffe-Pritchard trap, oc 3 + 20E2. Here O/kBT = 1.
distinguishable particles among sparsely occupied energy states because
interchang-ing any pair of particles leads to a different arrangement. For very densely occupied
states, interchanges of distinguishable particles often result in the same arrangement because the particles often do not change energy level. For a collection of
distinguish-able particles with a given total energy, there are "extra" arrangements in which
the particles are sparsely distributed. In contrast, for indistinguishable particles any
interchange of two particles results in the same overall arrangement of particles, re-gardless of whether the states are sparsely or densely occupied. There are thus no
"extra" sparse arrangements of particles.
In a gas near the quantum degenerate regime the occupation of the energy levels ranges from dense (- 1 at low energies) to sparse (< 1 at high energies). Using
the assumption of equal a priori probabilities [33], distinguishable particles will most
likely be found in those arrangements with the more sparse level occupations (higher overall energies) because there are so many more of these arrangements.
Indistin-guishable particles give no rise to such "extra" arrangements, and so the most likely
arrangements will involve more dense level occupations (lower overall energies) than
predicted by classical theory. Figure 2-1 demonstrates this effect. For each pair of
curves the peak density, no, is identical. The peak density is the experimentally ob-servable quantity. Since the MB occupation function favors arrangements with higher energy (and thus atoms are distributed over a larger volume in the trap), more atoms are required in the sample to produce the same peak density. The curves thus do not exhibit equal area.
Bose-Einstein condensation occurs when the chemical potential goes to zero and the occupation of the lowest energy state diverges. This occurs at the critical density
[33]
nc = 93/2(1)/A 3(T) (2.11)
where gn(z) = E z'/l"; g3/2(l) = 2.612. A gas that has undergone the
Bose-Einstein phase transition is said to be in the quantum degenerate regime because a macroscopic fraction of the particles are in an identical quantum state.
Although a hydrogen atom consists of two fermions, it behaves like a composite boson for the studies in this thesis because the collision interaction energies are ex-tremely small compared to the electron-proton binding energy [35]. The two fermions act as a unit except in high energy collisions where electron exchange is possible. The typical interaction energy during low temperature collisions is - 1 mK, which corre-sponds to 10- eV, 10' times smaller than the binding energy.
To analyze the behavior of the degenerate Bose gas we shall separately treat the condensed and non-condensed portions of the system. The condensate is treated in section 2.2.2. The non-condensed fraction, which we call the "normal gas" or
"thermal gas", is treated in appendix C. The results derived here will be used to
understand how the hydrogen system is different from other gases that have been Bose condensed (section 2.3), and to interpret the experimental results in chapter
5 (note that truncation effects are important because of the shallow traps used for those experiments, 4 < rj < 6).
2.2.2
Description of the Condensate
2.2.2.1 Gross-Pitaevskii Equation
When Bose-Einstein condensation occurs, a macroscopic fraction of the particles
oc-cupy the lowest energy quantum state of the system, and thus have the same wave-function. For a non-interacting Bose gas, that wavefunction is simply the lowest harmonic oscillator wavefunction for the trap. Interactions become important when many particles occupy this region of space and the local density increases. In this
case the wavefunction spreads out due to repulsion among the atoms. There is a large body of literature on Bose-Einstein condensates (see [36] for a recent review), and so we simply quote here the most important results.
The Schroedinger equation for the interacting condensate is called the Gross-Pitaevskii equation [37, 38, 39], and has the form
h
V2 0(r) + V(r)4'(r) + Uo 10(r)12V(r)
= pV(r)
(2.12)2m
where 4'(r) is the condensate wavefunction to be determined. The eigenenergy of the wavefunction is p, which is the total energy of each condensate atom. The quantity
Uo -- 47rh2a/m parameterizes the mean field energy, which is the energy of interaction
among the atoms per unit density, and is repulsive for s-wave scattering lengths a > 0.
For hydrogen in the ground state, a = 0.648 A[40], and Uo/kB= 3.92 x 10⁻¹⁶ PK cm3
.
The mean field energy augments the trap potential by an amount proportional to
the local condensate density ncnd (r) = 10
(r)1
2. Note that interactions between thecondensate and non-condensed atoms are neglected here. For the experiments in this thesis, this interaction energy is small because the density of non-condensed atoms (called the "thermal gas" or "normal gas") is small. Furthermore, the interaction energy with the thermal gas is essentially uniform across the condensate because the density of non-condensed atoms varies only weakly; the thermal energy of the
normal gas (T, - 60 pK) is much larger than the condensate mean field energy
(At/kB - 2 pK), and thus the density of the normal gas does not change appreciably
on the length scale of the condensate.
We identify the eigenenergy At in equation 2.12 with the chemical potential of the system in equilibrium. The chemical potential is the energy required to add a particle to the system. When a condensate is present, the normal gas is "saturated", and any particles added to the system go into the condensate. The energy required to add the last atom to the condensate is p, the eigenenergy, and so we link p with the chemical potential. In practice we measure p spectroscopically through the peak density at the center of the condensate, which is in turn measured through the cold-collision frequency shift. This is explained in section 5.3.1.
2.2.2.2 Thomas-Fermi Approximation
If the condensate density is large enough so that the mean field energy is much greater
than the kinetic energy of the wavefunction, then the kinetic energy term (also called the quantum pressure term) in equation 2.12 may be neglected. Using this "Thomas-Fermi" approximation we obtain the condensate density profile
ncond(r) = n, - V(r)/Uo (2.13)
where nr - P/Uo is the peak condensate density (the largest density in the condensate, found at the bottom of the trap). The Thomas-Fermi approximation is valid over most of the volume of the condensate, but near the edges the condensate density approaches zero, and the kinetic energy term should be included. We ignore this
small correction in the calculations which follow because it is minor for interpretation of the experiments described in this thesis. See [41] for a good description of various ways to go beyond the Thomas-Fermi approximation.
The condensate density profile may be obtained without the Gross-Pitaevskii equation by assuming the condensate is stationary and its particles are at rest, and then balancing hydrodynamic forces [42]. A condensate particle in a region of
poten-tial energy E has total energy E = E + neifd(c)Uo. Since there must be no net force
on the particle, E = const = nUO and ncond(E) = np - E/UO.
2.2.2.3 Population and Loss Rate
The population of the condensate is easily computed using the Thomas-Fermi wave-function in the bottom of the IP trap, which is parabolic for the condensate sizes and trap parameters of interest in this thesis. We approximate the potential energy density of states (see p114) as p(E) ?
AIpV/fO
and obtainNe = f =
/UonP
dE Ajp OV/E(np - ElUo)= AIP 0 U /% /2. (2.14)
As noted above, the total energy of each condensate atom is the chemical potential
y = npUo, so E = pNc.
The loss rate from the condensate due to two-body dipolar relaxation is found by integrating the square of the density over the volume of the condensate:
N2,c = - dE Ajp OE (g/2) (n, - EU )2 0
= - 11 0 U3/2 7/2 (2.15)
105 2!
where the 2! accounts for correlation properties of the condensate [43, 44]. Here the dipolar decay rate constant g is slightly different from that given in equation A.19 because the rate constant Gdd-_cd should be multiplied by 2; the energy 0 liberated in this process is large compared to [. This term is small, so g is not effected much.
The energy loss rate is E2,c pN2,c. The characteristic condensate decay rate in a
parabolic trap is
N2,- gn, (2.16)
2.3
Properties of a Bose-Condensed Gas of
Hydro-gen
Hydrogen differs in several ways from alkali metal atoms that have been Bose con-densed. The principal differences are its small mass and small s-wave scattering length. How do these properties influence the system?
First, the small mass implies that BEC occurs at a higher temperature for a given peak density: from equation 2.11, T, oc 1/m. We have observed the transition at temperatures roughly 50 times higher than in the other systems.
Further, as estimated by Hijmans et al. [45] and will be shown in the following sections, the maximum equilibrium condensate fraction is small for hydrogen. This will be explained by noting the relatively high density of the condensate, as compared to the thermal cloud. This high density leads to high losses through dipolar decay, which result in heating of the system. This heating must be balanced by evaporative cooling, which proceeds slowly in hydrogen because of the small collision cross section. The result of these factors is that only small condensate fractions are possible in equilibrium. Possible remedies will be noted.
Finally, hydrogen's small collision cross-section should allow condensates of H to be produced by evaporative cooling that contain many orders of magnitude more atoms than those possible in alkali-metal species, as explained in the section 2.3.4.
2.3.1
Relative Condensate Density
For trapped hydrogen, the condensate density grows much greater than the density of the non-condensed portion of the gas at even very small condensate fractions [18], a distinct difference from other species that have been Bose-condensed. This is note-worthy for possible future studies of behavior near the phase transition. As shown in section 2.3.2, it also has implications for the maximum condensate fraction that may be achieved in hydrogen. In this section we calculate the ratio of the densities as a function of the condensate fraction. We compare hydrogen to Li, Na, and Rb.
The condensate fraction is
F = c "(2.17) Nc + Nt
where the population of the thermal cloud, Nt, is found using equation C.7 and the population of the condensate is given by equation 2.14. The fraction can be written in terms of the more convenient population ratio,
f
Nc/N, as F = f/(1 +f).
For a given peak condensate density, sample temperature, and set of trap parameters, the population ratio is2 7/2h6a3/2 n'/2
f- 27/ 2m3 k 23 )
4 + 60((3)# .Tc3Ao(r/ ,) (2.18)
fo ftrap(0) fsample
species m a Te Ratom _ ftrap(#) RoRatom / ftrap (0)2/5
H 1 0.648 [40 60 230 0.6 0.0043 94 Li [5] 7 -14.4 [46] 0.30 98 2.2 x 10⁵ 0.012 25
Na [47] 23 27.5 [48] 2.0 26 30 0.013 6.8
Rb [44] 87 57.1 [49] 0.67 16 160 0.011 4.4
Table 2.1: Comparison of the parameters governing the ratio of condensate density to thermal gas density for the various BEC experiments. The units are amu,
A,
pK. The density ratio (for small condensate fractions) is the last column multiplied by the condensate fraction to the 2/5 power. This ratio is much larger for H than for Na or Rb, indicating that two-body loss from the condensate becomes important at much lowerf.
For Li, hydrodynamic collapse of the condensate occurs before the two-body loss process studied here becomes important.experienced by the thermal cloud is predominantly harmonic (large
#)
or predomi-nantly linear (small q) in the radial direction (0 = O/kBT is a unitless measure of the trap bias energy); and fsample carries the details of the thermal cloud and condensate occupation.The ratio of the peak condensate density to the critical BEC density, R np/nc(Tc), can be expressed in terms of the occupation ratio as
/11 h 2 2 3/10 (ff Ao (71/ ) 2/5
229/10 3 (1)71/10 mkBTa2 fta() -)
Rio Ratom
The prefactor is RO = 0.0457364. Table 2.1 gives the parameters appearing in equa-tion 2.19 for the various BEC experiments. For even a small occupaequa-tion ratio of
f
= 0.05, the H condensate will be 28 times more dense than the thermal gas, whichcan be compared to a Rb condensate that will be only be 1.3 times more dense. The loss rates from the condensate are thus very different for the two systems, as shown in the next section. Note that the trap oscillation frequencies play no role in these re-sults. The only assumptions are that the trap is of the IP form with bias field1
#, that
the condensate is in the Thomas-Fermi regime, and that p < kBT so that mean-field interaction energy of the condensate with the thermal cloud can be neglected.2.3.2
Achievable Condensate Fractions
The temperature of a trapped sample, and thus its condensate fraction, is set by a competition between heating and cooling, as described in section A.2.1. Hydrogen's anomalously low scattering length means that the elastic collision rate is small, and thus evaporation proceeds slowly. The evaporative cooling power is small, and the 'When # is small, the condensate experiences a harmonic potential while the thermal gas expe-riences a predominantly linear potential in the radial direction. When # is large, both condensate and thermal gas experience the same potential functional form.
evaporation: Nevap Si system boundary condensate c gain therma condensate cloudloss dipolar decay: N2,t 2,c
Figure 2-2: Diagram of system consisting of thermal cloud and condensate. We as-sume the particle and energy exchange rates between the condensate and thermal cloud are fast compared to the loss rates. The dynamics of the gas are set by evap-oration and dipolar decay from the normal gas when the condensate is small. When
the condensate is large, however, N2,c > N2,t, and the dynamics are dominated by
the dipolar decay rate from the condensate in balance with the evaporation rate.
heating-cooling balance favors higher temperatures and lower condensate fractions than would occur if hydrogen had a larger collision cross section. Higher temperatures are also favored by the large density of the condensate, which places an extra heat load on the system due to dipolar relaxation. This extra heat load can easily be much larger than the dipolar relaxation heat load of the thermal gas. In this section we examine each of these factors in more detail.
We model the system as two components, the condensate and thermal gas, that are strongly linked. As indicated in figure 2-2, losses from the system occur through dipolar decay in the thermal gas, dipolar decay in the condensate, and evaporation from the thermal cloud. We assume that particles and energy are exchanged between the condensate and thermal gas quickly compared to all loss rates. The system is in a dynamic equilibrium. In section 2.3.3 we examine the validity of the assumption of fast feeding of the condensate.
2.3.2.1 Dipolar Heating Rate
Here we study the rate of heating the system due to dipolar decay in the condensate and in the thermal gas. We define heating as the removal of atoms from the sample which carry less than the average amount of energy per particle. We find that for hydrogen the condensate heat load exceeds the thermal gas heat load at condensate fractions of 0.3%. We then compare this ratio for H to that of the atomic species in