Comparative assessment of the effects of 3D printed
feed spacers on process performance in MD systems
The MIT Faculty has made this article openly available. Please share how this access benefits you. Your story matters.
Citation Thomas, Navya et al. “Comparative assessment of the effect of 3D printed feed spacer geometries on process performance in membrane distillation systems.” Desalination 503 (May 2021): 114940 © 2021 Elsevier B.V.
As Published https://doi.org/10.1016/j.desal.2021.114940
Publisher Elsevier BV
Version Author's final manuscript
Citable link https://hdl.handle.net/1721.1/129639
Terms of Use Creative Commons Attribution-Noncommercial-Share Alike Detailed Terms http://creativecommons.org/licenses/by-nc-sa/4.0/
1
Comparative assessment of the effects of 3D printed feed
spacers on process performance in MD systems
Navya Thomas
1, Jaichander Swaminathan
2, Guillermo Zaragoza
3,
Rashid K. Abu Al-Rub
1, John H. Lienhard V
4, Hassan A. Arafat
1*1 Center for Membranes and Advanced Water Technology, Khalifa University, Abu Dhabi, UAE 2 Department of Mechanical Engineering, Indian Institute of Technology Gandhinagar, Gujarat, India 3 CIEMAT-Plataforma Solar de Almería, Almería, Spain
4 Rohsenow Kendall Heat Transfer Laboratory, Department of Mechanical Engineering, Massachusetts Institute of Technology, Cambridge, Massachusetts, USA
2
Abstract
In this study, process enhancements achieved by the use of 3D printed feed spacers based on triply periodic minimal surfaces (TPMS) were comparatively assessed using the two most common membrane distillation (MD) configurations: air gap (AGMD) and direct contact (DCMD). The MD performance was assessed based on the impact of spacer design (TPMS vs. commercial spacer) on flux and feed channel pressure drop, and their consequent impact on the levelized cost of water (COW). The studied spacer architectures led to a minimal improvement (≤17%) in AGMD flux, much lower than that achieved in DCMD (≤57%). Consequently, for a waste heat-operated MD process, the spacer-induced channel pressure drop became the most influential cost bottleneck on COW. Generally, the contribution of the pumping cost to the total operating cost was found to be greater for DCMD than AGMD. Thus, the COW of a waste heat operated DCMD is more sensitive to a decrease in spacer-induced channel pressure drop than in an AGMD. For an MD process operated with additional heat cost, the flux improvement achieved using TPMS spacers reduces the thermal energy component of the operating cost. Ultimately, this predominantly contributes to a lower COW.
Keywords: Triply periodic minimal surfaces; feed spacers; membrane distillation; cost analysis;
3
Nomenclature
Acronyms
ABS acrylonitrile butadiene styrene
AGMD air gap membrane distillation
CAPEX capital expense
CAPEXCS capital cost of MD unit using commercial spacer, $ per m2 of membrane area
COW cost of water, $/m3
COWCS cost of water using commercial spacer, $/m3
COWCS-CAP capital cost component of the cost of water using commercial spacer, $/m3
COWCS-OP operating cost component of the cost of water using commercial spacer, $/m3
COWCS-OP_pump pumping energy cost component of the cost of water using commercial spacer, $/m3
COWCS-OP_th.energy thermal energy cost component of the cost of water using commercial spacer, $/m3
COWCS-OP_rest other operating costs component of the cost of water using commercial spacer, $/m3
COWTPMS cost of water using 3D printed TPMS spacer, $/m3
COWTPMS-CAP capital cost component of the cost of water using 3D printed TPMS spacer, $/m3
COWTPMS-OP operating cost component of the cost of water using 3D printed TPMS spacer, $/m3
CS commercial spacer
DCMD direct contact membrane distillation
DLP digital light processing
FDM fused deposition modeling
GOR gained output ratio, dimensionless
LEP liquid entry pressure, bar
MD membrane distillation
OPEX operating expense
PDCS pressure drop when using commercial spacer, bar
PDTPMS pressure drop when using commercial spacer, bar
PTFE polytetrafluoroethylene
4 RCPD relative change in pressure drop when using the TPMS spacer
SGMD sweep gas membrane distillation
SLA stereolithography
SLS selective laser sintering
TPMS triply periodic minimal surfaces
VMD vacuum membrane distillation
Romans
A membrane area, m2
dch feed channel depth, m
dh feed channel hydraulic diameter, m
f friction factor
hfg enthalpy of vaporization, J/kg
JCS permeate flux using commercial spacer, kg/m2s JTPMS permeate flux using 3D printed TPMS spacer, kg/m2s
L length of channel, m
ṁf mass flow rate of feed, kg/s
ṁp mass flow rate of product or permeate, kg/s Q̇in inlet heat transfer rate, W
v flow velocity, m/s
Greek symbol
5
1 Introduction
In recent years, there has been a growing trend of studying the use of additive manufacturing (i.e.,
1
3D printing) techniques to impart process and design enhancements in membrane systems [1].
2
The prime advantage of 3D printing over traditional manufacturing techniques is its ability to
3
easily produce almost any complicated geometry across different scales by a layer-wise
4
manufacturing process. 3D printing applications explored for membrane systems include
5
membrane synthesis [2–6], spacer design [7–14] and fabrication of other membrane system
6
components [15–17]. The majority of these studies have focused on spacer design, since the
7
dimensional requirement of spacers is well aligned with the resolution range (0.1 to 10 µm) of
8
current 3D printing technologies [18]. The application of 3D printing in creating various spacer
9
designs has improved the membrane process performance by achieving increased flux [7–12],
10
lower energy consumption [8,19], reduced fouling [7,10,11,13,20,21] and reduced channel
11
pressure drop [13,22] with respect to the adoption of conventional spacers.
12
Membrane distillation (MD) technology has been heralded as an alternative separation technology
13
for various applications, such as desalination, hypersaline brine management, wastewater
14
treatment, textile and pharmaceutical residue treatment, etc. [23–25]. Traditionally, MD can be
15
operated in four different configurations including direct contact MD (DCMD), air gap MD
16
(AGMD), vacuum MD (VMD), and sweep gas MD (SGMD) [26]. However, AGMD has been the
17
preferred MD configuration for pilot and demonstration plants, while DCMD is the preferred
18
configuration for lab-scale performance assessment, as it is the simplest configuration to setup
19
and operate [27]. In AGMD, the air gap reduces heat losses through conduction, resulting in
20
improved thermal efficiency. However, compared to DCMD, the presence of the air gap also
21
results in increased resistance to mass transfer, thus lower flux. Recent studies [28] have
22
demonstrated the capability of vacuum enhanced AGMD operation to achieve higher flux and
23
energy efficiency with AGMD, even while treating high salinity brine solutions.
24
A widely investigated strategy to enhance flux in MD modules is via feed channel spacers [29,30].
6 In addition to effecting inter-membrane spacing in flat-sheet membrane modules [31], including
26
spiral wound elements, feed spacers function as turbulence promoters by inducing directional
27
changes in the flow and generating significant secondary flow structures [32]. By inducing
28
additional flow turbulence, feed channel spacers suppress the thermal and concentration boundary
29
layers bordering the membrane, thus reducing the temperature and concentration polarization
30
effects, enhancing flux, and minimizing foulant adhesion [33–35]. Nevertheless, the presence of
31
spacer also increases the pressure drop over the feed channel [32]. In pressure-driven processes
32
such as reverse osmosis, the pressure drop is a concern as it translates to higher pumping costs.
33
However, in MD, a major concern with pressure drop is membrane wetting. The introduction of
34
the spacers should restrict the hydraulic pressure drop, which has to be compensated for by
35
increasing the incoming feed pressure, from exceeding the liquid entry pressure (LEP) of the
36
membrane. If the hydraulic pressure of the entering feed exceeds the LEP, the hydrophobic
37
membrane becomes unable to prevent the passage of liquid through its pores, leading to a
38
degraded permeate quality.
39
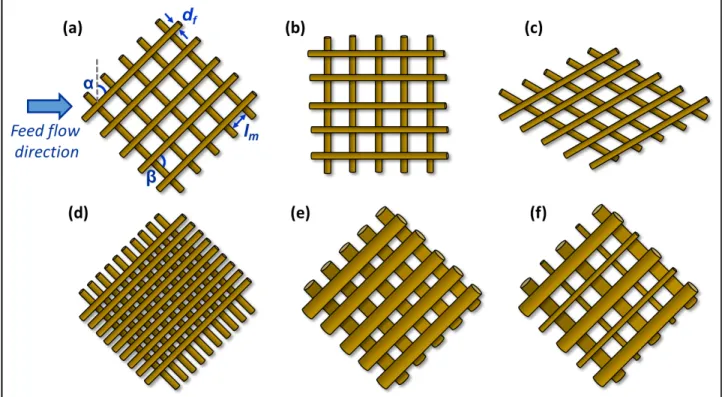
Conventional feed spacers are mesh-like structures with filaments positioned bi-planarly in a
40
woven or non-woven arrangement [36]. The characteristic geometric parameters of a mesh spacer
41
include mesh length, filament thickness, hydrodynamic angle (angle between filaments), and flow
42
attack angle (angle between filament and flow direction) (Fig. 1). Most reported studies on
43
optimizing conventional mesh spacers have targeted these geometric parameters [37]. In the
44
context of these parameters, creating an optimal mesh spacer could be limited, especially if the
45
design requirements for achieving improved flux and reduced hydraulic pressure drop are in
46
conflict. For instance, a recent study concluded that a spacer design with an increased number of
47
thick filaments is theoretically recommended to maximize vapor flux while thinner and fewer
48
filaments are recommended to minimize hydraulic pressure drop in DCMD [30]. The design
49
capabilities of traditional manufacturing methods, such as molding and extrusion, limit
50
innovations in mesh spacer geometries for enhanced process performance [38]. 3D printing, on
7 the contrary,enables the creation of irregular, complex and intricate feed spacer geometries, which
52
traditional manufacturing methods cannot easily achieve [1].
53
Despite the merits of 3D printing, such as design flexibility, the existing 3D printing technologies
54
are impeded by the limitations of high cost, slow printing speed, poor scalability, restricted build
55
size and limited resolution [1]. The cost of 3D printing is affected by the high capital cost of
56
printers, material cost and the amount of resource material used. Consumer grade 3D printers with
57
low resolution could be purchased for as low as $500, while industrial grade printers with high
58
resolution and throughput can cost upwards of $1M [39]. Raw materials used can cost anywhere
59
from $50/kg to $500/kg for resins, while exotic materials such as titanium can cost thousands of
60
USD per ounce [40]. Another cost-related bottleneck of 3D printing is the deposition rate of
61
material, which can be as low as 1/10,000 compared to conventional manufacturing methods [41].
62
As more researchers develop innovative 3D printed spacers, we aim to investigate in this work if
63
the payoff from a 3D printed spacer, such as increased flux and energy efficiency and reduced
64
pressure drop, can be justified within the context of 3D printing cost-ineffectiveness. For the
65
analysis, we consider AGMD and DCMD as the use-case scenarios with triply periodic minimal
66
surfaces (TPMS) [42] as the printed feed spacer design. We begin by comparing the effect of using
67
TPMS spacer geometries on flux and pressure drop in AGMD and DCMD system and examine
68
the reasons behind differences between the two configurations. We then conduct a cost analysis
69
to assess whether 3D printed spacers can serve as a cost-effective alternative to conventional mesh
70
spacers and under what conditions. To the best of authors’ knowledge, this is the first article that
71
focuses on comparing the performance of 3D printed spacers in the two most commonly applied
72
MD configurations, using a holistic approach which considers the impacts of the new spacers on
73
flux, pressure drop and the collective impact of these parameters on the final product water cost.
74
2 Methodology
75
For the comparative assessment, the performance of three different TPMS spacer geometries was
8 compared in DCMD and AGMD configurations. The performance data of the TPMS spacers in a
77
DCMD configuration were obtained from a previous study conducted by the authors [10]. The
78
experimental data to assess the performance of TPMS spacer geometries in AGMD was obtained
79
in this work as detailed below.
80
2.1 Materials
81
A flat sheet PTFE MD membrane (Memsys GmbH, Germany) was used in all experiments. The
82
membrane properties as specified by the manufacturer are: nominal pore size: 0.2 µm, LEP: > 3.5
83
bar, air permeability: 10-40 l/cm2/h at 0.07 bar, and thickness: 160 + 40 µm. Three TPMS
84
architectures were investigated in this study for their performance in AGMD. These are: Schwarz
85
P skeletal, Schoen Gyroid, and transverse Schwarz Crossed Layer of Parallels (CLP). These
86
spacers will henceforth be referred to as P, Gyr and tCLP, respectively. Each of these TPMS
87
topologies can be described in three-dimensional space by a level-set approximation equation [33,
88
36] as shown below, where the level-set parameter α represents the spacer voidage (i.e., porosity):
89
Schwarz P cos x + cos y + cos z = α (1)
Schoen Gyroid sin x cos y + sin y cos z + sin z cos y = α (2)
Schwarz CLP sin z sin y − 0.4 sin(1.2 x) cos z cos y = α (3) The unit cell representations of these spacers along with the photographic images of the
90
commercial mesh and 3D TPMS printed spacers are presented in Fig. 2. The geometrical
91
characteristics of the TPMS spacers are presented in Table 1. In the tCLP design, there are
92
channels aligned perpendicular to the feed flow direction as seen in Fig. 2. This design was
93
conceived considering that such an arrangement would cause maximum flow disruption in the
94
feed channel, creating greater turbulence. The TPMS spacers were 3D printed using the selective
95
laser sintering (SLS) technique at a thickness of 4.0 mm and using polyamide (PA 2202, black,
96
EOS) as the printing material. Details of the printing technique and its accuracy are discussed
97
elsewhere [7,9]. The performance of the TPMS spacers in AGMD was benchmarked against a
98
commercial mesh spacer (CS) (SWM, USA), which was made from high-density polyethylene
9 with a 90° angle of intersection and a strand count of two per inch (≈ 78 strands per meter).
100
2.2 AGMD test setup
101
The evaluation of spacer performance was done using a laboratory-scale flat-sheet AGMD module
102
(details listed in Table 2), operated in counter-current mode. The spacer to be tested was placed
103
within the feed channel of the AGMD module. The air gap thickness was 1 mm and a plastic mesh
104
spacer was used in all tests to keep the air gap thickness constant. The feed was heated using a
105
resistance immersion heater with a feedback controller. The feed pipeline was equipped with
106
sensors to monitor the flow rate, temperature and pressure drop across the membrane cell. The
107
recirculating cold water stream (for condensation plate cooling) was maintained constant at 20 °C
108
and was delivered from a cold reservoir tank. Detailed description of the AGMD setup can be
109
found elsewhere [43]. The performance assessment of the spacers was done at three feed
110
temperatures: 40, 50 and 65 oC generating driving forces equal to 51, 101 and 229 mbar,
111
respectively. For each feed temperature, the flux was measured at four feed flow velocities: 0.07,
112
0.13, 0.21 and 0.30 m/s. The feed solution was a mixture of deionized and tap water with an
113
average feed conductivity of 340 + 25 µS/cm. Such feed was selected to allow the detection of
114
membrane wetting.
115
2.3 Cost analysis
116
The impact of 3D printed spacers usage was assessed by evaluating its influence on water costs
117
derived from MD. For more general validity, this analysis was performed in relative terms, that
118
is, as a variation in the cost of water (COW) with and without the 3D printed spacers (ΔCOW, %).
119
This approach allows others to build on our analysis by using their own COW components’ values,
120
which depend on the module design, configuration and performance, plant size and energy source
121
[27]. The ΔCOW (%) was represented as:
122
𝛥𝐶𝑂𝑊(%) = *𝐶𝑂𝑊!"#$− 𝐶𝑂𝑊%$
𝐶𝑂𝑊%$ , × 100%
(4)
where COWTPMS and COWCS are the cost of water when using the 3D printed TPMS and
10 commercial spacers, respectively. The COW is the sum of contributions from the capital and
124
operating costs. Therefore, COWTPMS and COWCS can be represented as:
125
𝐶𝑂𝑊!"#$ = 𝐶𝑂𝑊!"#$&%'"+ 𝐶𝑂𝑊!"#$&(" (5)
𝐶𝑂𝑊%$ = 𝐶𝑂𝑊%$&%'"+ 𝐶𝑂𝑊%$&(" (6)
where COWTPMS-CAP and COWCS-CAP are the contributions of the capital cost to the respective
126
COW values while COWTPMS-OP and COWCS-OP are the contributions of the operating costs to the
127
COW, using the TPMS and CS, respectively. The cost analysis in this work was performed for
128
both small (10 m3/day) and large-scale (1000 m3/day) MD plants, in order to account for the
129
varying relative contribution of the capital and operating costs to the COW due to MD plant size.
130
The first assumption made in this analysis was that the impact of the spacers on the capital cost
131
component of the COW is due only to i) the added cost of the 3D printed spacers and ii) the change
132
in flux, to which CAPEX is inversely proportional. Therefore, the capital cost component of the
133
COW due to the use of 3D printed spacers can be calculated as per Eq. 7:
134
𝐶𝑂𝑊!"#$&%'" = 𝐶𝑂𝑊%$&%'"×
(𝐶𝐴𝑃𝐸𝑋%$+ 3𝐷 𝑠𝑝𝑎𝑐𝑒𝑟 𝑐𝑜𝑠𝑡) 𝐶𝐴𝑃𝐸𝑋%$× (1 + 𝑅𝐶)*+,)
(7)
where CAPEXCS is the reference capital cost of the MD system in which a CS is used, normalized
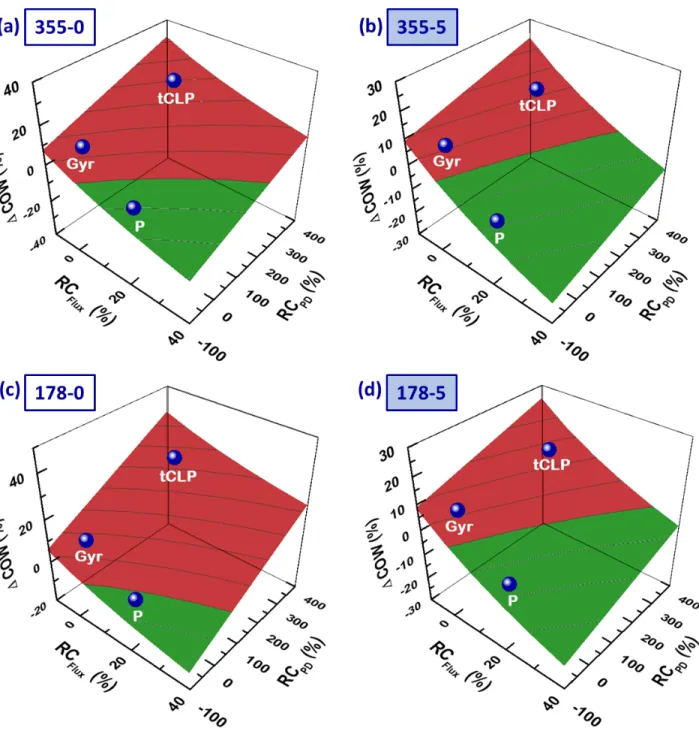
135
to membrane area and RCFlux (dimensionless ratio) is the relative change in flux when using a
136
TPMS spacer. Since both CAPEXCS and 3D spacer cost are quantified in $USD per unit of
137
membrane area, the second term on the right in Eq. 7 is dimensionless and is independent of the
138
membrane area used in the module. It should be noted that the 3D spacer cost was multiplied by
139
two for the DCMD module, due to the spacers being used in both feed and permeate channels. In
140
AGMD, the 3D printed spacer was considered to be only used in the feed channel, since the gap
141
has its own commercial spacer. RCFlux can be calculated as per Eq. 8:
142
𝑅𝐶)*+, =
𝐽!"#$− 𝐽%$ 𝐽%$
(8)
where JTPMS and JCS are the permeate fluxes using the TPMS and CS spacers, respectively.
11 For each MD configuration and plant size, the analysis was based on two different CAPEXCS
144
values: current and prospective (Tables 3 and 4). The current CAPEXCS costs for both small and
145
large scale plants were based on the economic assessment of MD systems by Hitsov et al. [44].
146
On the other hand, the prospective values were determined assuming a potential 50% cost
147
reduction in the CAPEX of MD system in the future, as a consequence of a wide-scale commercial
148
implementation and manufacturing optimization of the MD technology. This assumption was
149
based on correspondence with Aquastill B.V., a leading manufacturer of MD systems. The premise
150
of using these values is that they can be applicable to all the spiral-wound MD modules. This
151
premise is considered acceptable because similar materials are used in MD modules.
152
Another important factor in our CAPEX calculations is the cost of 3D printing (see Eq. 7), which
153
is the most difficult to determine precisely because 3D printing is rapidly emerging and is very
154
versatile in terms of printers, materials, economy-of-scale, etc. We found that there are several
155
ranges for the cost of printing spacers, which could be extracted from i) research literature, ii)
156
details provided by companies via private communication and iii) 3D printing platforms (e.g.,
157
Shapeways, iMaterialise, etc.). The cost of 3D printing is dependent on the type of printing
158
technique, material cost and complexity of design. For example, in 2017, the reported material
159
cost alone ranged from ~$200 to $300/kg for stereolithography (SLA), whereas the cost of
160
material for fused deposition modeling (FDM) 3D printing ranged from ~$250 to $350/kg [4]. As
161
per the latest 2020 report, the material cost for FDM filaments and SLA could be as low as $20/kg
162
and ~$50/kg, respectively [39]. The material cost also varies depending on the scale of 3D
163
printing. For a desktop 3D printer, the material cost can be as low as $19/kg and as high as $175/kg
164
[4]. A recent study reported that the cost per part can be reduced by about 10% and 70-80% for
165
SLS and FDM, respectively, by using material-reuse methods [45]. The study reported the cost of
166
3D printed parts using SLS as $225/kg for a single build based on a build-volume utilization of
167
15%, a build time of 12 h, a build temperature of 150 ºC, a cost for virgin powder of $50/kg and
168
a cost for the grinding process of $13/kg. This cost would decrease to $201/kg if the material is
12 reused until degraded beyond usefulness. Similarly, the cost of 3D printing was estimated to be
170
$173/kg for a single build with FDM with ABS material as support structures. This cost would
171
drop to $38/kg only if the material is used until it is degraded, that is, the reclaimed FDM materials
172
from the build cycles are continuously milled, pelletized and reincorporated into the process using
173
a filament extruder and winder [45]. The 3D printing cost assumed in this work is based on
174
personal communication with a leading 3D printing company that uses the digital light processing
175
(DLP) technique (company name is not disclosed here due to a confidentiality agreement). The
176
cost of 3D printed spacers was assumed to be $40 per m2 of spacer area, using a high-throughput
177
DLP technique and an average material cost of $125/kg. This TPMS spacer cost was considered
178
representative of commercial scale 3D printing cost with continuous production capacity. Please
179
note that this cost is significantly lower than the cost declared by 3D printing platforms (such as
180
Shapeways, iMaterialise, etc.) which operate based on discreet and small volume designs (e.g.,
181
printed by hobbyists, etc.). For comparison, the cost of a CS is only ~$3/m2 [46]. While the cost
182
for 3D printed spacers considered in this work was determined to the best of our judgment, the
183
methodology adopted here for cost analysis is sufficiently flexible for other researchers to extend
184
this work by assuming different 3D printing costs.
185
With regards to COWCS-OP, it was assumed that it is composed of three components: the COW
186
components due to the pumping cost (COWCS-OP_pump), the COW components due to the thermal
187
energy cost (COWCS-OP_th.energy), and the COW component due to the other operating costs which
188
are unaffected by the type of spacer used (e.g., labor cost) (COWCS-OP_rest). The second main
189
assumption made in this work is that switching to a TPMS spacer impacts the operating costs in
190
two ways only: (i) by changing the cost of electrical energy based on the relative change in
191
pressure drop, to which pumping energy is directly proportional, and (ii) by changing the thermal
192
energy cost based on the relative change in flux. So, COWCS-OP and COWTPMS-OP were calculated
193
as:
194
13 𝐶𝑂𝑊!"#$&(" = 𝐶𝑂𝑊%$&("_.+/.(1 + 𝑅𝐶"9) + 𝐶𝑂𝑊%$&("&01.343567 1 + 𝑅𝐶:*+, + 𝐶𝑂𝑊%$&("_5380 (10) 𝑅𝐶"9 = 𝑃𝐷!"#$− 𝑃𝐷%$ 𝑃𝐷%$ (11)
where RCPD is the relative change in pressure drop and PDTPMS and PDCS are the pressure drops
195
when TPMS spacers and CS are used, respectively. Based on equations 4-7, 9 and 10, ΔCOW (%)
196
can be represented as follows:
197 𝛥𝐶𝑂𝑊(%) = ⎝ ⎛𝐶𝑂𝑊!"#!$%× (𝐶𝐴𝑃𝐸𝑋!"+ 3𝐷 𝑠𝑝𝑎𝑐𝑒𝑟 𝑐𝑜𝑠𝑡) 𝐶𝐴𝑃𝐸𝑋!"× (1 + 𝑅𝐶&'()) + 𝐶𝑂𝑊!"#*%!"#!(1 + 𝑅𝐶%+) + 𝐶𝑂𝑊!"#*%#,-./0/123 1 + 𝑅𝐶4'() + 𝐶𝑂𝑊!"#*%$%&' 𝐶𝑂𝑊!"#!$%+ 𝐶𝑂𝑊!"#*% − 1 ⎠ ⎞ × 100% ( (12) The MD cost analysis by Hitsov et al. [44] was used to obtain COWCS-CAP, COWCS-OP, COW
CS-198
OP_pump and COWCS-OP_rest (Tables 3 and 4). We considered two separate scenarios regarding
199
COWCS-OP_th.energy: i) free (waste) heat, which is the basis for the cost calculations conducted in
200
[44], and ii) $5/m3 for heat cost, which is reasonable for solar thermal energy powered MD [61].
201
Please note that the referenced model in [44] was based on membrane module lifetime of 5 years,
202
a set depreciation period of 10 years and zero percent as the loan interest rate. When considering
203
the prospective cost scenarios, only COWCS-CAP was reduced in the same proportion as CAPEXCS
204
and COWTPMS-CAP was recalculated accordingly, but COWCS-OP were assumed not to change.
205
Finally, for more general validity, ΔCOW was calculated for all the mentioned scenarios based on
206
a hypothetical range of values for the relative change of flux (RCFlux) and pressure drop (RCPD)
207
that could result from using a 3D printed spacer compared to those using a CS. By using Eq. 12
208
and the parameters presented in Tables 3 and 4, other researchers can easily perform a similar cost
209
analysis to assess the cost effectiveness of any 3D printed spacer design in MD based on its flux
210
and pressure drop performance and for any given 3D printing cost.
14
3 Results and Discussion
212
3.1 Effect of TPMS spacers on AGMD flux performance
213
A comparison of the AGMD flux performance using TPMS spacers, CS and no-spacer condition
214
(i.e., empty feed channel) is presented in Fig. 3. As expected, an increase in feed temperature led
215
to a considerable increase in permeate flux, since the saturation water vapor pressure on the feed
216
side increases exponentially with feed temperature [47]. The rise in feed flow velocity was
217
accompanied by a slight and asymptotic increase in flux, similar to previously reported data [48–
218
52]. The introduction of spacers improved the AGMD flux relative to the empty channel. The
219
most pronounced flux improvement was using the TPMS P spacer, under the combined operating
220
conditions of highest feed temperature (65 oC) and lowest feed velocity (0.07 m/s), whereby the
221
flux increased by 58% (Fig. 3a). The addition of a spacer interferes with the formation of thermal
222
boundary layers near the membrane surface through increased mixing, thus reducing the effect of
223
temperature polarization and increasing the flux. Compared to the CS, the TPMS P spacer
224
increased the flux by up to 17% at a feed temperature of 65 oC. However, the impact of varying
225
TPMS spacer geometry was not substantial. For example, at a feed temperature of 65 oC, the flux
226
variation between the different TPMS spacer geometries ranged from 9 to 18%. This range is
227
similar to previously reported improvement ranges of AGMD flux upon varying a mesh spacer
228
design. An AGMD flux increase of only 4 to 10% was reported by varying the hydrodynamic
229
angle from 60 to 120° for a carbon-fiber spacer, while reducing the filament thickness of the said
230
spacer from 3 to 2 mm increased the flux by only 5% [53]. In an earlier study, the AGMD flux
231
improved by 20 to 30% by varying mesh spacer design based on hydrodynamic angle, flow attack
232
angle and filament shape [54]. Alternatively, the corrugation of AGMD feed channel has been
233
reported to increase flux by 16-32% compared to the increase in flux (5-20%) by adding a mesh
234
spacer [55].
235
More pronounced than its impact on flux, the choice of a spacer design had a significant impact
236
on the channel pressure drop in AGMD. Fig. 4a displays the impact of varying the TPMS spacer
15 geometry on channel pressure drop. The TPMS P and Gyr spacers reduced the pressure drop by
238
50% and 19%, respectively, relative to the CS. The tCLP spacer, on the other hand, resulted in
239
nearly three-fold higher pressure drop than the CS. The channel pressure drop caused by the feed
240
spacer is rooted in the resistance to flow exhibited by the spacer filaments (in the case of CS) or
241
sheets (in the case of TPMS spacers), which in turn depends on the flow attack angle [56]. Indeed,
242
the transverse arrangement of the channels in the tCLP design (which was deliberately chosen to
243
cause maximum disruption to the approaching fluid flow and to create higher shear rates) caused
244
the observed high pressure drop relative to the CS due to higher kinetic losses in the channel [57].
245
The abrupt change in flow direction by the transverse arrangement of spacer sheets imparts major
246
pressure drag [58]. Furthermore, the tCLP design had the largest specific surface area of all TPMS
247
spacers (7.9 mm-1). This translates to more friction between the spacer sheets and the flow. In
248
comparison, the P and Gyr spacers (with lower specific surface areas of 3.1 and 4.1 mm-1,
249
respectively) exhibited lower channel pressure drops. The overall impact of spacer geometry on
250
MD performance can be gauged based on the spacer efficiency, defined as the ratio of flux
251
produced by a given spacer at a given Reynolds number to the corresponding channel pressure
252
drop [54]. The TPMS spacers P and Gyr, which resulted in lower channel pressure drop than the
253
CS, exhibited relatively higher spacer efficiencies (Fig. 4b).
254
These results indicate that while the turbulence promoting TPMS spacer designs effect a limited
255
flux enhancement in AGMD, the more likely benefit of an optimized TPMS spacer design in
256
AGMD applications would be a reduced channel pressure drop. The reduced channel pressure
257
drop achieved using TPMS spacer designs presents an opportunity to use AGMD modules with a
258
longer feed channel, which in turn improves the efficiency of the internal heat recovery of the
259
module.
260
3.2 Performance of TPMS spacers in AGMD vs. DCMD
261
An interesting finding from the evaluation of different spacers’ performances in AGMD was that
262
the variations in TPMS spacer topologies did not cause a significant increase in flux relative to
16 the CS. As it initially appears, this is in contradiction with our earlier observed significant impact
264
of TPMS spacers on flux in DCMD systems [10]. To illustrate this, Fig. 5 presents a comparison
265
of the flux and pressure drop ratio of three different TPMS spacer geometries relative to a CS in
266
both AGMD and DCMD configurations. The data for DCMD was obtained from an earlier work
267
reported by the authors at 65 oC and 30 oC as feed and permeate temperatures, respectively [10].
268
Compared to the CS, the tCLP TPMS spacers increased the flux by up to 57% in DCMD. On the
269
other hand, the highest flux improvement with a TPMS spacer in the AGMD system was only
270
17%. Upon considering the impact of spacer geometry on channel pressure drop, the Gyr and
271
tCLP spacers caused a considerably higher pressure drop than the CS in DCMD. For instance, the
272
tCLP spacer caused a 14-fold rise in pressure drop, compared to CS.
273
The mass and heat transfer resistances of the AGMD versus DCMD can explain the difference in
274
TPMS spacer flux performance the two MD processes. Compared to DCMD, the presence of the
275
air gap (ca. 1-2 mm thick) in AGMD increases the overall thermal resistance and helps reduce
276
conductive heat losses. The resistances associated with vapor transport and heat conduction
277
between the evaporation and condensation interfaces are often considered to be in parallel. The
278
resistance associated with vapor transport is a function of the temperatures of the evaporation and
279
condensation interfaces since saturation vapor pressure is an exponential function of temperature.
280
A simple resistance network model accounting for the channels and transport across the membrane
281
and air gap (Fig. 6) is herein adapted from Swaminathan et al. [59] to explain the observed
282
difference in flux improvement in AGMD and DCMD upon using TPMS spacers.
283
In the case of an empty (spacer-less) feed channel (assuming channel heat transfer coefficients of
284
1000 W/m2K, obtained by fitting the experimental data in [9]), the flux of DCMD is 75% higher
285
than that of AGMD, owing to the additional resistance associated with the 1 mm thick air gap in
286
AGMD. The boiling point elevation was assumed to be 1°C when evaluating the membrane
287
resistance. In DCMD, the channels together account for 20 cm2K/W out of the total resistance of
288
25.8 cm2K/W. On the other hand, in AGMD, the total resistance is higher (48 cm2K/W), with the
17 major portion coming from the membrane and the air gap (28 cm2K/W). When the channel heat
290
transfer coefficients are increased by four-fold upon the use of TPMS spacers, as shown by
291
Thomas et al. [9], the flux increases by 2.8 times in DCMD. Notice that the membrane resistance
292
is also reduced with increasing temperature drop across the membrane. In contrast, in AGMD, the
293
same increase in feed channel heat transfer coefficient results in a much smaller flux enhancement
294
of about 25% (Fig. 6), which corresponds well with the experimental observations in the present
295
study.
296
3.3 Energy benefits of using TPMS spacers in MD systems
297
The gained output ratio (GOR) of an MD system is defined as its inverse specific thermal energy
298
consumption, non-dimensionalized by multiplying with the enthalpy of evaporation [60]:
299
𝐺𝑂𝑅 =𝑚̇;ℎ<= 𝑄̇>?
(13)
It indicates how effectively the supplied heat input is recycled within the MD system to evaporate
300
water from the feed ‘more than once’. A small-scale MD system without energy recovery from
301
the condensing vapor is limited to a GOR value lower than 1. However, pilot AGMD systems
302
achieve significantly better energy efficiency by preheating the feed stream using the condensing
303
vapor. The GOR of AGMD is proportional to the membrane area (A) [60]:
304 GOR ∝ 𝐴 𝑚̇< = 1 𝜌𝑑@A 𝐿 𝑣 (14)
In the above expression, 𝑑@A is the feed channel depth, 𝐿 is the channel length and 𝑣 is the flow
305
velocity. One can observe that GOR is proportional to the residence time of the feed within the
306
MD module NBCO. A recent study reported data from two pilot-scale AGMD modules of different
307
sizes [28]. The larger module, which had a 3.6 times higher residence time, achieved 3 to 3.3 times
308
higher GOR under identical operation conditions (top temperature and feed flow rate). This
309
demonstrates the critical impact of the module length on system energy efficiency.
310
Pressure drop restrictions impose an upper limit on the value of residence time that can be
18 achieved in an MD system. At a given feed velocity, chosen in order to achieve sufficiently high
312
channel heat transfer coefficient, the overall pressure drop can be expressed in terms of the friction
313
factor (𝑓) and channel hydraulic diameter (𝑑A) as:
314
Δ𝑃 =𝑓𝐿𝑑
A *
1
2𝜌𝑣D, (15)
The requirement that Δ𝑃 must be lower than the liquid entry pressure limits the maximum
315
membrane/feed channel length that can be used. So, if a TPMS spacer has a significantly lower
316
friction factor (𝑓), observed in terms of a lower pressure drop than a CS at the same feed velocity
317
and channel length, it enables the feed channel length to be increased by the same factor and would
318
result in a corresponding improvement in GOR. Therefore, a 50% reduction in AGMD pressure
319
drop compared to a CS, as observed in this study, presents an opportunity to increase the process
320
GOR by nearly 2 times, via designing the feed channel to be 2X longer. In order to accurately
321
estimate the improvement in GOR that can be achieved with these TPMS spacers, their pressure
322
drop has to be experimentally determined with channel geometry and feed flowrate that
323
correspond to those used in pilot-scale spiral wound MD systems.
324
Note that the longer module length discussed above results in an improvement in energy efficiency
325
while producing the same total amount of pure water, at a reduced flux. This would be desirable
326
if the cost of thermal energy is significant relative to the cost of system area. If, however, the
327
opposite is true, then it is desirable to operate at higher flux even at the expense of lower energy
328
efficiency. In such a case, a low value of 𝐿/𝑣 is preferred to achieve a larger driving temperature
329
difference and hence flux. With a TPMS spacer that reduces friction factor by 50% using the same
330
channel length, the velocity can be increased by 1.22 times while maintaining the same pressure
331
drop. Correspondingly, the 𝐿/𝑣 ratio is decreased by around 18%, which helps increase the
332
operating flux. If pumping electrical energy consumption is a more significant cost component
333
than thermal energy, both 𝐿 and 𝑣 can be maintained the same, in order to reduce the pumping
334
energy demand by around 50% by using the TPMS spacer, along with minor improvements in
335
energy efficiency and flux.
19 In the above discussion, we have considered channel length to be limited by pressure drop.
337
However, in practice, especially when MD is used for desalination of high salinity streams, a
338
maximum allowable channel length can also be dictated by the need to maintain temperature drop
339
across the membrane sufficiently higher than the feed boiling point elevation (BPE, which is
340
proportional to salinity). If the transmembrane temperature drop falls close to BPE, a significant
341
portion of energy transport across the membrane is through heat conduction, resulting in lower
342
pure water production. In such cases, feed spacers that help reduce the channel concentration and
343
temperature polarization without increase in pressure drop are particularly useful to increase
344
temperature drop across the membrane and decrease BPE at the membrane interface.
345
3.4 Cost implications of using 3D printed spacers in AGMD vs. DCMD
346
The economic impact of using 3D printed spacers on the COW was assessed by estimating the
347
relative change in COW, as described in Section 2.3. The variation in COW (ΔCOW, %), was
348
calculated as a function of the relative changes in both flux (RCflux) and pressure drop (RCPD) due
349
to using a 3D printed spacer instead of a CS. Figs. 7 and 8 show ΔCOW depictions for small-scale
350
(10 m3/day) DCMD and AGMD systems, respectively. The 3D plots were generated for two
351
values of the MD reference capital costs; current and prospective, and two scenarios for thermal
352
energy cost; free (waste) heat and additional heat cost, as detailed in Section 2.3. The sub-plots
353
are labeled in the format xxx-y, wherein ‘xxx’ indicates the MD reference capital cost and ‘y’
354
indicates the presence or absence of heat cost. The green region in these plots indicates a favorable
355
negative ΔCOW (i.e., a reduction in COW), while the red region reflects an unfavorable increase
356
in COW. Additionally, based on the previously determined RCflux and RCPD values for TPMS
357
spacers (see Sections 3.1 and 3.2), the ΔCOW values for these spacers were calculated and are
358
also shown on Figs. 7 and 8.
359
For a small-scale DCMD plant (Fig. 7), the use of all the three TPMS spacers caused an
360
unfavorable increase in COW compared to CS for all the different cost scenarios except for the
361
combination of current CAPEXCS with additional heat cost, where only the Gyr spacer yielded a
20 slightly favorable cost performance. The Gyr spacer, characterized by an RCflux of +16.5% and an
363
RCPD of +94.4%, reduced the COW by merely 1.1% (Table 5). The TPMS spacers tCLP and
Gyr-364
tCLP contributed to a rise in COW, despite resulting in a considerable RCflux of +56.7%. The
365
positive ΔCOW values in this case are caused by the considerable increase in pressure drop when
366
using these spacers (1336% and 489%, respectively). For the cost scenarios with waste heat, the
367
increase in COW for DCMD was predominantly dictated by the hydraulic resistance exerted by
368
the TPMS spacers, regardless of the positive RCflux these spacers yielded. This is because the
369
increase in channel pressure drop was about one order of magnitude greater than the increases in
370
flux with these TPMS spacers. Therefore, due to additional pumping requirements, the higher
371
operating costs dwarfed any other cost savings effected by increased permeate productivity. On
372
the contrary, for the cost scenarios with additional heat cost, it can be observed that for a given
373
TPMS spacer the ΔCOW (%) is lower than the corresponding ΔCOW (%) with waste heat. This is
374
because the relative flux improvement achieved by using a TPMS spacer reduces the additional
375
thermal energy cost by a similar ratio, thus decreasing the operating cost component of the COW
376
compared to the CS.
377
The premise is different for a small-scale AGMD plant compared to a DCMD plant. The economic
378
impact of 3D printed spacers on the system CAPEX is halved as they are only used in one channel
379
in AGMD, instead of two channels in DCMD. Among the three 3D printed TPMS spacers, the P
380
spacer consistently exhibited a favorable drop in COW for all the four different scenarios
381
considered for the small-scale AGMD plant (Table 6 and Fig. 8). The COW using the P spacer
382
dropped by 5.1 and 1.7% for the current and prospective CAPEXCS with waste heat, respectively.
383
The COW using the P spacer dropped further to 9.2 and 8.2% for the current and prospective
384
CAPEXCS with additional heat cost, respectively. The performance of the P spacer in AGMD was
385
characterized by only a moderate flux improvement of 17.4%, accompanied by a considerable
386
(49.5%) decrease in pressure drop over the CS.
387
For large-scale (1000 m3/day) production capacity, the economies of scale reduce the CAPEX CS.
21 For instance, the current CAPEXCS drop by 77.3% and 75.7% for DCMD and AGMD,
389
respectively, when the plant production capacity increases to 1000 m3/day. At large-scale plant
390
capacity, for DCMD (Fig. 9), all the TPMS spacers contribute to an increase in COW. As explained
391
previously, this is attributed to the considerable increase in pressure drop despite the achieved
392
improvement in flux. For the best-case spacer, Gyr for DCMD, the minimum increase in COW
393
was 0.7% and 1.5%, corresponding to the current and prospective MD cost with additional heat
394
cost. For a large-scale AGMD plant (Fig. 10), the COW increased with all TPMS spacers for the
395
current and prospective CAPEXCS with waste heat. The COW using only the P spacer dropped by
396
-9.2% and -8.9% for the current and prospective CAPEXCS, respectively, with additional heat cost.
397
While the economies of scale decreased the specific costs of MD systems, the cost of printing the
398
TPMS spacers remained unchanged and, hence, the contribution of the TPMS spacers cost to the
399
CAPEX of large-scale MD systems became more prominent.
400
For a better understanding of the observed impacts of printed spacers on COW, a breakdown of
401
cost elements in the baseline scenarios using CS are herein discussed. The COW breakdown for
402
small and large-scale AGMD and DCMD plants, based on current CAPEXCS and using CS
403
spacers, is presented in Fig. 11 for the two scenarios: using waste heat and additional heat cost.
404
For the small-scale production capacity with waste heat, COWCS-OP contributes 48% of the COW
405
for DCMD and AGMD. The contribution of COWCS-OP to the COW increases to 66 and 70% for
406
DCMD and AGMD, respectively, with additional heat cost. The contribution of COWCS-OP_pump to
407
COWCS-OP is generally greater in the DCMD configuration than in AGMD. When operating with
408
waste heat, the COWCS-OP_pump accounts for 25% and 8.3% of COWCS-OP for DCMD and AGMD,
409
respectively. However, when additional heat cost is considered, the contribution of COWCS-OP_pump
410
diminishes to 11.7 and 3.3% of COWCS-OP for DCMD and AGMD, respectively, while COW
CS-411
OP_th.energy becomes a major component of COWCS-OP. In the scenario with additional heat cost,
412
COWCS-OP_th.energy contributes to 53.2% and 60.2% of COWCS-OP for DCMD and AGMD,
413
respectively. For the large-scale production capacity, COWCS-OP contributes to more than 70% of
22 the COW with waste heat for both DCMD and AGMD configurations. With the additional heat
415
cost, the contribution of COWCS-OP to the COW further increases to nearly 90% for both
416
configurations but the percentage attributed to the COWCS-OP_pump decreases. For instance, the
417
additional heat cost decreases the contribution of the COWCS-OP_pump to COWCS-OP from 35.4% to
418
11.2% for 1000 m3/day DCMD and from 12.7 to 3.1% for 1000 m3/day AGMD. The COW
CS-419
OP_th.energy contributes 68.5% and 75.2% of COWCS-OP of a large-scale DCMD and AGMD,
420
respectively with additional heat cost. This cost breakdown indicates that when operating an MD
421
plant with waste heat, the COW will be reduced by a 3D printed spacer design that predominantly
422
achieves a decrease in the channel pressure drop compared to a CS and thus reduces the COW
CS-423
OP. Given the understanding that the contribution of the COWCS-OP_pump to COWCS-OP is generally
424
greater in DCMD than AGMD, the decrease in COW caused by the reduction in channel pressure
425
drop will be more pronounced for the DCMD configuration. On the other hand, when operating
426
an MD plant with additional heat cost, the flux increase achieved by a 3D printed spacer will
427
impact the COW by decreasing the COWCS-OP_th.energy which is a major component of COWCS-OP
428
in this case.
429
To illustrate this further, one can assess the results gathered from a simple cost sensitivity analysis
430
performed based on variations in flux and pressure drop (information pertaining to all the
use-431
cases considered in the cost sensitivity analysis is tabulated in electronic Supplementary
432
Information, SI). In the cost sensitivity analysis, ΔCOW was calculated for RCFlux ranging from
-433
10% to 100% and RCPD ranging from -100% to 10% at 10% increment intervals. For a small-scale
434
MD plant operated with waste heat, by using a 3D printed spacer design that exhibits no relative
435
change in pressure drop compared to a CS (i.e. RCPD equals zero), a drop in COW will begin to
436
emerge with RCFlux as little as 10 and 20% in DCMD (ΔCOW = 2.3%) and AGMD (ΔCOW =
-437
3.8%), respectively. For a small-scale MD plant operated with additional heat cost, by using a 3D
438
printed spacer design such that RCPD equals zero, ΔCOW equals -4.7% and -3.5% with just 10%
439
RCFlux in DCMD and AGMD configurations, respectively. By using a 3D printed spacer design
23 that exhibits no relative change in flux compared to a CS (i.e. RCFlux equals zero) in a small-scale
441
MD plant operated with waste heat, a reduction in COW will only begin to emerge at RCPD of
-442
30% in DCMD (ΔCOW = -1.0%), while for AGMD the COW will increase by 1.1% even if the
443
pressure drop was reduced by -100%. This highlights that the COW of a DCMD plant operated
444
with waste heat is more sensitive to a reduction in channel pressure drop than an AGMD plant.
445
For a large-scale DCMD plant, by using a 3D printed spacer design such that RCPD equals zero, a
446
drop in COW will begin to emerge with RCFlux equal 30% and 10% flux with waste heat (ΔCOW
447
= -1.7%) and additional heat cost (ΔCOW = -4.3%), respectively. In other words, when operating
448
a large-scale DCMD plant with additional heat cost, the use of a 3D printed spacer design that
449
induces the same channel pressure drop as a commercial spacer but improves the flux by only
450
10% leads to cost savings. For a 1000 m3/day AGMD plant, by using a 3D printed spacer design
451
such that RCPD equals zero, a drop in COW will begin to emerge with RCFlux of 50% and 10%
452
with waste heat (ΔCOW = -1.6%) and additional heat cost (ΔCOW = -3.0%), respectively. This
453
observation highlights the significance of the improvement in flux achieved by the use of a 3D
454
printed spacer for a large-scale MD plant operated with additional heat cost.
455
Another sensitivity analysis was conducted by considering the cost of printed spacers. Since 3D
456
printing is a rapidly developing manufacturing technology, the future of 3D printing is believed
457
to bring about reduced cost of 3D printing equipment and materials. Considering this, the last
458
scenario we considered for the cost sensitivity analysis assumes the cost of 3D printed spacer to
459
be halved to $20/m2. The impact of the reduced cost for 3D printed spacers was assessed for the
460
future prospective CAPEXCS for both small and large-scale DCMD and AGMD plants operated
461
with waste heat and additional heat cost (Figs. 12 and 13). For both small- and large-scale MD
462
plants, the reduction in the cost of 3D printed spacer caused a greater drop in COW for the cost
463
scenarios with waste heat as compared to the cost scenarios with additional heat cost. For instance,
464
with the selected TPMS spacers in a small-scale AGMD plant, the decrease in the cost of 3D
465
printed spacer further reduces the COW by ~4% on average for the scenario with waste heat and
24 by only ~2% for the scenario with additional heat cost. Similarly, for a large-scale AGMD plant
467
the decrease in the cost of 3D printed spacer further reduces the COW by ~8% on average for the
468
scenario with waste heat and by only ~2% for the cost scenario with additional heat cost. Thus,
469
the reduction in the cost of 3D printed spacers by 50% does not translate to substantial drop in the
470
COW for the different scenarios.
471
4 Conclusions
472
This study has shown that the turbulence promoting TPMS spacer designs lead to limited flux
473
enhancement in AGMD. The more likely benefit of an optimized TPMS spacer design for AGMD
474
would be a reduced channel pressure drop with respect to the adoption of convetionally used
475
commercial mesh spacers. The use of different TPMS spacer geometries in AGMD presented only
476
a marginal flux improvement (up to 17%) compared to commercial mesh spacer. The observed
477
flux improvement in AGMD with TPMS spacer was considerably low compared to the flux
478
improvement (up to 57%) obtained in a DCMD configuration. This is attributed to the increased
479
mass transfer resistance imposed by the air gap in AGMD configuration, thereby limiting the
480
spacer-induced improvement in flux that accompanies better heat transfer within the feed channel.
481
Despite the limited flux improvement, the choice of TPMS spacer geometry in AGMD had rather
482
pronounced effect on channel pressure drop affirmed by the 50% lower pressure drop obtained by
483
the P spacer compared to a commercial spacer. This reduced channel pressure drop presents the
484
opportunity to design AGMD modules with double the membrane length and can thus increase
485
the GOR by nearly two times. The cost implications of using the selected 3D printed TPMS
486
spacers in a small and large-scale DCMD and AGMD module was also assessed in the study based
487
on the relative change in cost of water (ΔCOW) contributed by the change in flux and pressure
488
drop over a commercial spacer. The cost analysis considered two separate scenarios for thermal
489
energy cost – waste heat and additional heat cost of $5/m3. Since the channel pressure drop is
490
directly proportional to the electrical energy associated with the pumping cost, it influences the
25 operating cost component (OPEX) of the COW. Thus, for an MD plant operated with waste heat,
492
the 3D printed spacer-induced channel pressure drop becomes the bottleneck in influencing the
493
COW. The contribution of the pumping cost to the total operating cost is generally greater for the
494
DCMD configuration than AGMD. Thus, the COW of a DCMD plant operated with waste heat is
495
more sensitive to a reduction in spacer-induced channel pressure drop than an AGMD plant. In
496
scenarios wherein the MD plant is operated with additional heat cost, flux improvement achieved
497
by using a 3D printed spacer reduces the thermal energy component of the operating cost,
498
predominantly contributing to reduced COW. The cost analysis reveals that a cost-effective 3D
499
printed spacer design should achieve flux improvement without additional penalties on channel
500
pressure drop while the best-case scenario would be a 3D printed spacer design that improves the
501
flux throughput while simultaneously reducing the channel pressure drop relative to the
502
commercial mesh spacer design.
503
504
Acknowledgment
505
The TPMS spacers were printed using Core Technology Platform resources at NYU Abu Dhabi.
506
We thank Dr. Reza Rowshan, Dr. Oraib Al-Ketan and Khulood Alawadi (NYU Abu Dhabi) for
507
their support and assistance with 3D printing. We thank Nurshaun Sreedhar for useful discussions
508
and feedback on the manuscript. The authors from the Center for Membrane and Advanced Water
509
Technology acknowledge that this publication is based upon work supported by the Khalifa
510
University of Science and Technology under Award No. RC2-2018-009.
511
512
References
513
[1] L.D. Tijing, J.R.C. Dizon, I. Ibrahim, A.R.N. Nisay, H.K. Shon, R.C. Advincula, 3D printing for membrane
514
separation, desalination and water treatment, Appl. Mater. Today. 18 (2020) 100486.
515
[2] H. Dommati, S.S. Ray, J.C. Wang, S.S. Chen, A comprehensive review of recent developments in 3D printing
516
technique for ceramic membrane fabrication for water purification, RSC Adv. 9 (2019) 16869–16883.
517
[3] S. Mazinani, A. Al-Shimmery, Y.M. John Chew, D. Mattia, 3D printed fouling-resistant composite
26 Membranes, ACS Appl. Mater. Interfaces. 11 (2019) 26373–26383.
519
[4] Z.X. Low, Y.T. Chua, B.M. Ray, D. Mattia, I.S. Metcalfe, D.A. Patterson, Perspective on 3D printing of
520
separation membranes and comparison to related unconventional fabrication techniques, J. Memb. Sci. 523
521
(2017) 596–613.
522
[5] T. Femmer, A.J.C. Kuehne, M. Wessling, Print your own membrane: Direct rapid prototyping of
523
polydimethylsiloxane, Lab Chip. 14 (2014) 2610–2613.
524
[6] S. Badalov, C.J. Arnusch, Ink-jet printing assisted fabrication of thin film composite membranes, J. Memb.
525
Sci. 515 (2016) 79–85.
526
[7] N. Sreedhar, N. Thomas, O. Al-Ketan, R. Rowshan, H. H. Hernandez, R.K. Abu Al-Rub, H.A. Arafat, 3D
527
printed feed spacers based on triply periodic minimal surfaces for flux enhancement and biofouling mitigation
528
in RO and UF, Desalination. 425 (2018) 12–21.
529
[8] N. Sreedhar, N. Thomas, O. Al-Ketan, R. Rowshan, H.H. Hernandez, R.K. Abu Al-Rub, H.A. Arafat, Mass
530
transfer analysis of ultrafiltration using spacers based on triply periodic minimal surfaces: Effects of spacer
531
design, directionality and voidage, J. Memb. Sci. 561 (2018) 89–98.
532
[9] N. Thomas, N. Sreedhar, O. Al-Ketan, R. Rowshan, R.K. Abu Al-Rub, H.A. Arafat, 3D printed triply periodic
533
minimal surfaces as spacers for enhanced heat and mass transfer in membrane distillation, Desalination. 443
534
(2018) 256–271.
535
[10] N. Thomas, N. Sreedhar, O. Al-Ketan, R. Rowshan, R.K. Abu Al-Rub, H. Arafat, 3D printed spacers based
536
on TPMS architectures for scaling control in membrane distillation, J. Memb. Sci. 581 (2019) 38–49.
537
[11] E.H.C. Castillo, N. Thomas, O. Al-Ketan, R. Rowshan, R.K. Abu Al-Rub, L.D. Nghiem, S. Vigneswaran,
538
H.A. Arafat, G. Naidu, 3D printed spacers for organic fouling mitigation in membrane distillation, J. Memb.
539
Sci. 581 (2019) 331–343.
540
[12] C. Fritzmann, M. Wiese, T. Melin, M. Wessling, Helically microstructured spacers improve mass transfer and
541
fractionation selectivity in ultrafiltration, J. Memb. Sci. 463 (2014) 41–48.
542
[13] A. Siddiqui, N. Farhat, S.S. Bucs, R.V. Linares, C. Picioreanu, J.C. Kruithof, M.C.M. Van Loosdrecht, J.
543
Kidwell, J.S. Vrouwenvelder, Development and characterization of 3D-printed feed spacers for spiral wound
544
membrane systems, Water Res. 91 (2016) 55–67.
545
[14] N. Yanar, M. Son, E. Yang, Y. Kim, H. Park, S. Nam, H. Choi, Investigation of the performance behavior of
546
a forward osmosis membrane system using various feed spacer materials fabricated by 3D printing technique,
547
Chemosphere. 202 (2018) 708–715.
548
[15] T. Luelf, D. Rall, D. Wypysek, M. Wiese, T. Femmer, C. Bremer, J.U. Michaelis, M. Wessling, 3D-printed
549
rotating spinnerets create membranes with a twist, J. Memb. Sci. 555 (2018) 7–19.
27 [16] T. Femmer, F. Carstensen, M. Wessling, A membrane stirrer for product recovery and substrate feeding,
551
Biotechnol. Bioeng. 112 (2015) 331–338.
552
[17] H.Y. Tsai, A. Huang, J.F. soesanto, Y.L. Luo, T.Y. Hsu, C.H. Chen, K.J. Hwang, C.D. Ho, K.L. Tung, 3D
553
printing design of turbulence promoters in a cross-flow microfiltration system for fine particles removal, J.
554
Memb. Sci. 573 (2019) 647–656.
555
[18] J.Y. Lee, W.S. Tan, J. An, C.K. Chua, C.Y. Tang, A.G. Fane, T.H. Chong, The potential to enhance membrane
556
module design with 3D printing technology, J. Memb. Sci. 499 (2016) 480–490.
557
[19] J. Balster, I. Pünt, D.F. Stamatialis, M. Wessling, Multi-layer spacer geometries with improved mass transport,
558
J. Memb. Sci. 282 (2006) 351–361.
559
[20] C. Fritzmann, M. Hausmann, M. Wiese, M. Wessling, T. Melin, Microstructured spacers for submerged
560
membrane filtration systems, J. Memb. Sci. 446 (2013) 189–200.
561
[21] B. Wu, Y. Zhang, Z. Mao, W.S. Tan, Y.Z. Tan, J.W. Chew, T.H. Chong, A.G. Fane, Spacer vibration for fouling
562
control of submerged flat sheet membranes, Sep. Purif. Technol. 210 (2019) 719–728.
563
[22] S. Kerdi, A. Qamar, J.S. Vrouwenvelder, N. Ghaffour, Fouling resilient perforated feed spacers for membrane
564
filtration, Water Res. 140 (2018) 211–219.
565
[23] H.H. Salih, S.A. Dastgheib, Treatment of a hypersaline brine, extracted from a potential CO2 sequestration
566
site, and an industrial wastewater by membrane distillation and forward osmosis, Chem. Eng. J. 325 (2017)
567
415–423.
568
[24] S. Leaper, A. Abdel-Karim, T.A. Gad-Allah, P. Gorgojo, Air-gap membrane distillation as a one-step process
569
for textile wastewater treatment, Chem. Eng. J. 360 (2019) 1330–1340.
570
[25] J.-P. Mericq, S. Laborie, C. Cabassud, Evaluation of systems coupling vacuum membrane distillation and
571
solar energy for seawater desalination, Chem. Eng. J. 166 (2011) 596–606.
572
[26] A. Ali, P. Aimar, E. Drioli, Effect of module design and flow patterns on performance of membrane distillation
573
process, Chem. Eng. J. 277 (2015) 368–377.
574
[27] N. Thomas, M.O. Mavukkandy, S. Loutatidou, H.A. Arafat, Membrane distillation research &
575
implementation: Lessons from the past five decades, Sep. Purif. Technol. 189 (2017) 108–127.
576
[28] J.A. Andrés-Mañas, A. Ruiz-Aguirre, F.G. Acién, G. Zaragoza, Performance increase of membrane
577
distillation pilot scale modules operating in vacuum-enhanced air-gap configuration, Desalination. 475 (2020)
578
114202.
579
[29] A. Hagedorn, G. Fieg, D. Winter, J. Koschikowski, A. Grabowski, T. Mann, Membrane and spacer evaluation
580
with respect to future module design in membrane distillation, Desalination. 413 (2017) 154–167.
581
[30] J. Seo, Y. Mi, J. Ha, Spacer optimization strategy for direct contact membrane distillation : Shapes,


![Fig. 6 Comparison of local water flux in DCMD and AGMD based on a simple resistance network model of both processes adapted from [59, 60]](https://thumb-eu.123doks.com/thumbv2/123doknet/14402457.510221/37.918.117.805.102.472/comparison-local-water-simple-resistance-network-processes-adapted.webp)