Publisher’s version / Version de l'éditeur:
Technical Note (National Research Council of Canada. Division of Building Research), 1966-02-01
READ THESE TERMS AND CONDITIONS CAREFULLY BEFORE USING THIS WEBSITE.
https://nrc-publications.canada.ca/eng/copyright
Vous avez des questions? Nous pouvons vous aider. Pour communiquer directement avec un auteur, consultez la
première page de la revue dans laquelle son article a été publié afin de trouver ses coordonnées. Si vous n’arrivez pas à les repérer, communiquez avec nous à [email protected].
Questions? Contact the NRC Publications Archive team at
[email protected]. If you wish to email the authors directly, please see the first page of the publication for their contact information.
NRC Publications Archive
Archives des publications du CNRC
For the publisher’s version, please access the DOI link below./ Pour consulter la version de l’éditeur, utilisez le lien DOI ci-dessous.
https://doi.org/10.4224/20338484
Access and use of this website and the material on it are subject to the Terms and Conditions set forth at
Reinsulation Tests on Alfol Type I Insulated Walls
Handegord, G. O.
https://publications-cnrc.canada.ca/fra/droits
L’accès à ce site Web et l’utilisation de son contenu sont assujettis aux conditions présentées dans le site LISEZ CES CONDITIONS ATTENTIVEMENT AVANT D’UTILISER CE SITE WEB.
NRC Publications Record / Notice d'Archives des publications de CNRC:
https://nrc-publications.canada.ca/eng/view/object/?id=a56064e2-4f2f-47ef-a712-d4330d72c5d0 https://publications-cnrc.canada.ca/fra/voir/objet/?id=a56064e2-4f2f-47ef-a712-d4330d72c5d0
DIVISION OF BUILDING RESEARCH
No.
NATIONAL RESEARCH COUNCIL OF CANADA
463
NOTE
'Ir
E
C
1HIN ][ CAlL
LIMITED DISTRIBUTION
PREPARED BY G.
o.
Handegord CHECKED BY APPROVED By NBHセ February 1966
PREPARED FOR Limited distribution
SUBJECT REINSULATION TESTS ON ALFOL TYPE I INSULATED WALLS
During the severe winter of 1947 -48 on the Prairies, a number of houses of the Central Mortgage and Housing Corporation, which had been insulated with Alfol Type I and Type I I, developed serious wall sUrface condensation problems. A field study undertaken for the
Corporation by the Prairie Regional Station of the Division of Building Research, National Research Council, indicated that the surface
temperature variations induced by these insulations was a primary contributing factor and that the over -all thermal resistance of Alfol Type I insulated walls was inadequate for prairie conditions.
As a result of these findings, consideration was given to the reinsulation of walls in existing houses, using pneumatically applied insulation. It was recognized that the foil insulation could still provide a useful vapour barrier if additional insulation was introduced from the outside, but the degree of collapse of the foil curtain would determine the subsequent insulation effectiveness. A series of ad hoc tests was therefor'e conducted by the Prairie Regional Station, at the request of Central Mortgage and Housing Corporation, to determine whether re-insulation by this means should be attempted.
Z
-PRELIMINAR Y TESTS
The personnel involved in the investigation had no previous experience with the pneumatic application of insulation and a series of trials were first undertaken to gain familiarity with the machine and to try to determine what factors might be significant in this method of insulating walls.
The machine used was a "Univer sal Heavy Duty Junior",
manufactured by the Universal Insulating Machine Co. Ltd., powered by a 7
liz
h. p. gasoline engine. In operation, insulation was fed by hand from a flat-bottomed bin on top of the unit, through a type ofshredder which tended to break up the insulation and act as a feed limiting device. From the shredder, the insulation entered a rotating vane-type feeder where air supplied by a positive displacement rotary air blower transported the insulation through a Z liZ-in. diameter hose.
The initial test walls consisted of single stud spaces framed with Z x 4 lumber on 16 -in. centres and 8'0
'1
in height, sheathed oneside with plywood and closed on the other with a removable plywood panel. A Z -in. diameter hole near the top of the plywood sheathing allowed for insertion of the hose nozzle.
In the first series of tests, an attempt was made to evaluate the effect of hose length and rate of feed on the density and vertical variation in density of two types of fill insulation, "Fiberglas Blowing Wool" and "Johns-Manville Rock Wool, Type A". The results of these tests are given in Table I.
Tests with the Fiberglas insulation indicated the in-place densities to be affected by length of hose and rate of feed, ranging from 5 lblcu ft with a hose length of 50 ft down to 1. 6 lblcu ft with a hose length of 150 ft and a fast rate of feed. A general tendency for higher densities in the top half of the space was also observed.
Under similar conditions, the in-place densities of the Johns-Manville insulation were much higher and appeared little affected by hose length or rate of feed. As with the Fiberglas, densities were generally greater in the top half or quarter of the space.
It was suspected that the influence of hose length on the applied density of the Fiberglas insulation might be due to a more pronounced sensitivity to handling because of its different physical structure.
3
-In contrast to the nodulated particles of the rock wool, the Fiberglas had a more angular texture, and appeared to have been manufactured from the cuttings from batt insulation or some other felted material. One test was conducted using "Fiberglas Pouring Wool". which had a texture similar to the rock wool. and an in -place density of 4. 8 lb/cu ft was obtained using a 150 ft length of hose. Time did not permit a further investigation of this aspect and it was decided to standardize the proce-dure by using a hose length of 100 £t with a normal rate of feed. This. it was thought. would be reasonably consistent with the situation and
demands of commercial application.
To observe the behaviour of insulations within the space during application, a second series of tests was made with a plate glass panel covering one side of the space. Although the turbulence and rapid movement of the insulation entering the space was complex, a general pattern of the process was evident.
In the initial stages of filling. the insulation was loosely packed. As the space continued to fill, a gradual consolidation occurred. but at times substantial segments of the fill would compress locally and slump
downwards on the insulation below. With this phenomenon occurring, it was possible to envisage how the insulation became more compressed near the upper portions of the stud space. The general process, too.
suggested that the air leakage characteristics of the space might have some influence on the final density.
The air leakage characteristics of the space were modified by inserting spacers between the glass panel and the frame, or by leaving the top open. and a series of runs was made measuring the air pressure in the space. These results are listed in Table I I. and though far from conclusive. suggested' that the initial tightness of the space had little effect on the resultant average density. It appeared that the density was more dependent on the final pressure developed as the insulation
progres-sively plugged the points of leakage. In the interest of expediency. how-ever. it was decided to proceed with the reinsulation tests using the standard test panel without modification.
REINSULATION TESTS
In addition to the two insulations used in the preliminary testing. "Moose Jaw Rock Wool", a coarse-fibered mineral wool with a high shot content, and" Zonolite", an expanded vermiculite normally sold for hand application. were included in the test program. The insulations were
- 4
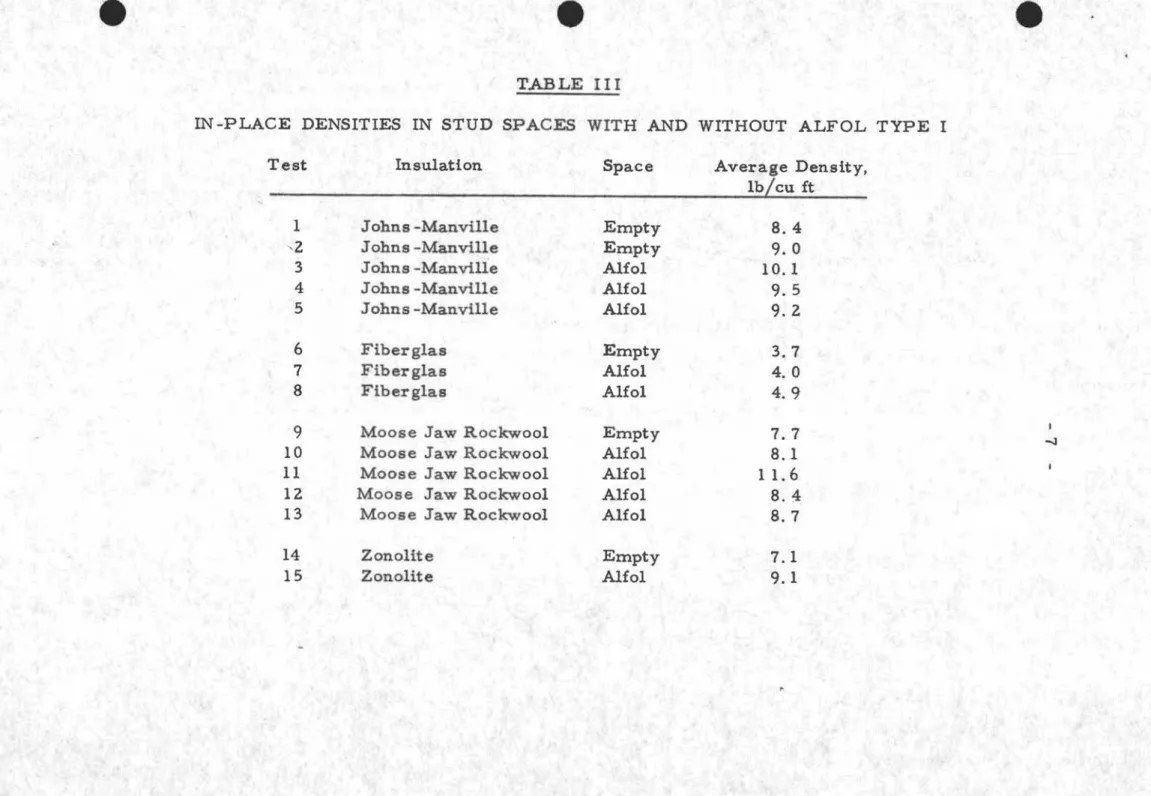
-first blown into an empty test panel and their applied density was deter-mined. AHol Type I insulation was then installed and the procedure repeated under essentially the same conditions. The observed densities are given in Table UI, those for the AHol insulated panels being based on the gross space volume.
The normal cross sectional profile of Alfol Type I 1$ shown in Figure 1 (a). The insulation was supplied flattened in rolls but was so designed that, when stretched to span a normal stud space, paper folds projected into the space to suspend a foil curtain, as indicated. At the top and bottom of the space the entire blanket was compressed between plywood panel and framing.
The extent of collapse of the AHol after reinsulation is indicated in Figures 1 (b), (c) and (d), where the measured profiles, before and after blowing at the Z-, 4- and 6 -ft levels are shown. Although these profiles are for one particular insulation, the values are reasonably representative, as can be seen from the photographs in Figures Z, 3, 4 and 5, showing the appearance of the four insulations after removal of the Alfol blanket.
SUPPLEMENTAR Y TESTS
It was believed that there could be cases in actual construction where nails or other projections might be present in the stud space. A test was run with Fiberglas insulation blown into a space having shiplap sheathing with shingle nails, used to secure sheathing paper, projecting l/Z in. into the space. A second test, with four 3 -in. nails projecting into the space. was run with both Johns-Manville and
Fiberglas insulation. In all cases the projections had little effect and normal densities were realized.
CONCLUDING STATEMENT
The investigation provided sufficient evidence of the feasibility of the method for Central Mortgage and Housing Corporation to initiate their program of house reinsulation. The contractor selected was not completely satisfied that filling of the stud spaces from the top would be the most satisfactory technique, and chose to use one which was his normal practice in house insulation. This method involved the insertion of a smal-ler diameter hose through an access hole at mid-height of the wall and fil-ling of the space as the hose was withdrawn, first from the bottom and then from the top of the space. It was his claim that this technique would produce a more uniform density and could avoid empty pockets that could be created by unknown obstructions. A trial of this method in a house in Saskatoon was witnessed by personnel from the Prairie Regional Station and from Central Mortgage and Housing Corporation. The method gave all indications of being satisfactory and was consequently accepted.
e
e
TABLE I
IN-PLACE DENSITY OF PNEUMATICALLY APPLIED INSULATION
e
Test Insulation Hose Rate of Density lb/cu ft
Length Feed
o -
2
2 - 4
4 -
6 6 -8
Ave.ft ft ft ft
1
Fiberglas 50 it Normal3.8
5.0
5.3
4.2
4. 6
2
Fiberglas 50 it Normal3.6
4.1
4.1
4. 3
4. 0
3
Fiberglas 50 it Normal4. 7
5.0
5.4
5.0
5.0
4
Fiberglas100
it Normal3.3
3.5
3.7
4.2
3.7
I1.6
\Jl5
Fiberglas 150 it Slow1.6
2.0
2.8
2.0
6
Fiberglas 150 it Slow2. 5
2.8
2.5
2. 5
2.5
7
Fiberglas 150 it Fast2.0
1.3
1.4
1.9
1.7
8
Fiberglas 150 it Fast1. 1
1.3
1.5
2.4
1.6
9 Johns -Manville 50 it Normal
7.2
8.0
8.6
10.1
8.5
10
Johns -Manville 50 it Slow8.6
8.3
9.5
11.5
9. 5
11
Johns -Manville100
it Slow5.4
6.2
7.3
8.4
6.8
12
Johns -Manville100
it Slow7.0
6.7
7.8
9.0
7.6
13
Johns -Manville 150 it Slow5.7
7.4
8.3
8.5
7.5
14
Johns -Manville 150 it Slow7.6
7.1
7.9
10.7
8.4
15
Johns -Manville 150 it Normal8.9
9.4
8.8
6.5
8.4
16
Fiberglas 150 it Normal4.2
4. 5
5.4
5.2
4.8
-
e
TABLE I I
EFFECT OF MODIFIED AIR LEAKAGE CHARACTERISTICS ON THE AIR PRESSURE WITHIN THE SPACE AND THE AVERAGE IN-PLACE DENSITY OF THE INSULATION
It
Test Insulation Modification Pressure at Top of Space, in. HzO Average
1/4 1/2 3/4 In -Place Density,
No. Start Full Full Full Full
1b/cu £t
I J-M Rockwoo1 None 5.0
-
-
-
9.5 8.92 J -M Rockwoo1 None 5.0
-
7.0 8.0 16.5 10.33 J -M .Rockwoo1 One spacer 1.5 1.5 2.0 4.0 11. 0 10.2
4 J-M Rockwool Two spacers .5
-
1.0-
10.0 7.7 C'5 J -M Rockwoo1 Three spacers
-
-
-
-
-
8.16 J -M Rockwoo1 Open top and
three spacers 0.0 0.0 0.0 0.0
-
6.07 J -M Rockwool Open top and
two spacers 0.0 0.0 0.0 0.0
-
6.08 Fiberglas One spacer 2.0 3.0 6.0 9.0 14.0 4. 7
e
e
e
..
TABLE III
IN -PLACE DENSITIES IN STUD SPACES WITH AND WITHOUT ALFOL TYPE I
Test Insulation Space Average Density,
lbjcu ft
1
Johns -Manville Empty8.4
,Z
J ohna -Manville Empty9.0
3
J ohna -Manville Alfol10.1
4 Johns -Manville AHol
9.5
5
Johns -Manville AHol9.Z
6
Fiberglas Empty3.7
7
Fiberglas Alfol4. 0
8
Fiberglas AHol4.9
9
Moose Jaw Rockwool Empty7.7
-J10
Moose Jaw Rockwool AHol8.1
11 Moose Jaw Rockwool Alfol
11.6
lZ
Moose Jaw Rockwool Alfol8.4
13
Moose Jaw Rockwool AHol8.7
14
Zonolite Empty7.1
15
Zonolite Alfol9.1
Normal Profile of Alfol Type 1
{el
ilnitial Profile at
4'-0"
--e---e---e-
e
_e--e-_ e
_-e---e-,
/
- -
---
--
-//
Profile After Reinsulation
"
(b)
Llnitlal Profile at
6'-0"
r - e
---e---e--e__ e
e
e
e_,
/ .
//
Profile After Reinsulation
'"
(0)
=
..
...
...
o::s
セセ f...J H;) o f...J 1-3 <.... "<1 t-d CD '" ••..
JC-
セ ", v CD Ll tJ1 •(fJ ::stil·
1...Jセ P - ' I Tt '6'
I
f\) ::s C' 8 I CD f...J ',1 1 cor 0' UJ 0'.'"
!II:
....
-,...
(d)
£Initial Profile at 2
1-0"
_ - --e_
_-e-,-e
--e---e-
e
-e---e---e-
"
/
,
//
セpイッヲゥャ・
After Reinsulation
'
FIGURE
1
PRO FI LEO F ALFO L TYPEl BE FO REA NDAFT ERR EINS ULA TION
WITH
J.
M. ROCKWOOL INSULATION
-セMMMMMMMMMMMM
Figure 2 Johns -Manville insulation after removal of AHol blanket.
Figure 3 Fiberglas insulation after removal of Alfol blanket.
- M⦅NセセセセセMMMMMN
Figure 4 Moose Jaw Rockwool after removal of Alfol blanket.
Figure 5 Zonolite insulation after removal of Alfol blanket.