The MIT Faculty has made this article openly available.
Please share
how this access benefits you. Your story matters.
Citation
Veronika, Merlin et al. “Correlation of cell membrane dynamics and
cell motility.” BMC Bioinformatics 12 (2011): S19. Web. 2 Dec. 2011.
© 2011 Veronika et al.
As Published
http://dx.doi.org/10.1186/1471-2105-12-S13-S19
Publisher
BioMed Central Ltd
Version
Final published version
Citable link
http://hdl.handle.net/1721.1/67351
Terms of Use
Creative Commons Attribution
P R O C E E D I N G S
Open Access
Correlation of cell membrane dynamics and cell
motility
Merlin Veronika
1,2, Roy Welsch
1,3, Alvin Ng
1,2, Paul Matsudaira
1,4,5,6, Jagath C Rajapakse
1,2,7*From Asia Pacific Bioinformatics Network (APBioNet) Tenth International Conference on Bioinformatics
– First
ISCB Asia Joint Conference 2011 (InCoB2011/ISCB-Asia 2011)
Kuala Lumpur, Malaysia. 30 November - 2 December 2011
Abstract
Background: Essential events of cell development and homeostasis are revealed by the associated changes of cell morphology and therefore have been widely used as a key indicator of physiological states and molecular
pathways affecting various cellular functions via cytoskeleton. Cell motility is a complex phenomenon primarily driven by the actin network, which plays an important role in shaping the morphology of the cells. Most of the morphology based features are approximated from cell periphery but its dynamics have received none to scant attention. We aim to bridge the gap between membrane dynamics and cell states from the perspective of whole cell movement by identifying cell edge patterns and its correlation with cell dynamics.
Results: We present a systematic study to extract, classify, and compare cell dynamics in terms of cell motility and edge activity. Cell motility features extracted by fitting a persistent random walk were used to identify the initial set of cell subpopulations. We propose algorithms to extract edge features along the entire cell periphery such as protrusion and retraction velocity. These constitute a unique set of multivariate time-lapse edge features that are then used to profile subclasses of cell dynamics by unsupervised clustering.
Conclusions: By comparing membrane dynamic patterns exhibited by each subclass of cells, correlated trends of edge and cell movements were identified. Our findings are consistent with published literature and we also identified that motility patterns are influenced by edge features from initial time points compared to later sampling intervals.
Background
Cellular populations exhibit phenotypic heterogeneity across various physiological and pathological processes. The causative factors range from biological noise to com-plex distinct states of cell functions. Different approaches have been reported to study cellular heterogeneity from different fronts. Morphological responses to perturba-tions in cellular environments have been characterized by patterns of signaling marker colocalization from high content images [1]. Cellular heterogeneity through FACS (fluorescence activated cell sorting) has been captured to provide a large number of cell read outs, but without any
spatial information [2]. Earlier studies have profiled cell subpopulations from fluorescent images by computing dynamic features of the cells along with static features by using unsupervised clustering [3]. Cellular morphology is a highly dynamic entity and time-lapse high-content ima-ging of cells provides an unprecedented opportunity to understand the mechanisms of morphodynamics. Morphodynamics is defined as a correlation of cell morphology and the underlying functional activity with respect to time [4]. This concept has enabled the discovery of functionality of specific biomolecules and demanded new techniques for interpretability, accuracy, and speed. Extensive research has been performed in understanding and application of morphodynamics of cell edges. High throughput analysis of cell morphody-namics has been used to discover functions of specific
* Correspondence: [email protected]
1
Computation and Systems Biology, Singapore-MIT Alliance, Nanyang Technological University, Singapore 637460
Full list of author information is available at the end of the article
© 2011 Veronika et al; licensee BioMed Central Ltd. This is an open access article distributed under the terms of the Creative Commons Attribution License (http://creativecommons.org/licenses/by/2.0), which permits unrestricted use, distribution, and reproduction in any medium, provided the original work is properly cited.
proteins [5]. A series of studies using quantitative fluores-cent speckle microscopy have revealed the power of com-puter assisted high throughput analysis of time-lapse microscopy images: an analysis of the number of speckles suggested distinct regulation of actin polymerization-depolymerization dynamics in different intracellular regions [6,7]. The ratio of protrusive to inactive cell peri-meter has been used as the measure of cell edge activity [8]. Difference of the cell membrane boundary was reported in the study of cell spread dynamics [9] and its role in actin transport for protruding lamellipodia [10], formation of filopodia downstream of SCAR (Suppressor of cAMP receptor) [11], and the role of cofilin as a pro-moter of actin polymerization leading to protrusion [12]. Alternatively protrusion rates are measured at multiple locations of the cell boundary. The morphological changes have been studied by placing markers in the cell boundary at regular intervals and tracking their displace-ment in orthogonal directions to the cell boundary [13]. Instead of direct displacement of tracking, cell bound-aries can be analyzed with kymographs [14]. This techni-que involves high resolution time-lapse microscopy to capture subcellular motion which is widely used for rela-tively small sample sizes due to highly magnified imaging and for relatively short periods of time. However, these approaches are not suitable for high throughput applica-tions due to computational complexity compounded by elaborate cell shapes and its ever changing dynamics.
In this work, we propose novel morphodynamics con-cepts to quantify the relationship between whole cell movement and edge dynamics. Whole cell movement as a function of space and time and its possible influence on protrusion retraction dynamics have not been studied in detail. Heterogeneous populations exhibiting characteristic protrusion and retraction patterns have been completely exploited by us in order to identify possible correlations with motility features. Such information is helpful in determining overall motility functions of cells in collective migration. Cell membrane movements are extracted and protrusion/retraction dynamics along the cell edges at dif-ferent time points were obtained to correlate with whole cell motility features. An approach to extract such patterns from heterogeneous cell populations is presented. Our experiments show that the cells with similar kinetic pro-files display different edge movements and that features observed in initial time points have profound influence in determining the type of motility patterns as the cell adapts to its motion.
Results and discussion
Dataset
Cells used in this experiment were mouse macrophage cell lines IC-21 (American Type Culture Collection (ATCC) TIB-186) treated with solvent DMSO (Dimethyl
sulphoxide). Cells were observed over a period of 120
minutes and 12-bit images with 0.5µm2pixels were
col-lected using Cellomics KineticScan at every 10 minutes giving a total of 12 snapshots. Data and statistical analysis were implemented in MATLAB R2008a (The Math-works, Inc., USA) and R project [15].
Cell identification and tracking
Cells are bright objects protruding from a relatively uni-form dark background in microscopic images. The pur-pose of segmentation is to identify cells accurately in an automated manner. Segmentation algorithms cluster image pixels based on their features into two groups representing objects of interest and background. Simple methods like thresholding do not work because they are not robust to noise and artifacts of images as well as images with overlapping cells [16]. Methods such as region growing, watershed, clustering and active contours have been attempted on cellular images [17-19]. However, these methods fail on images composed of overlapping or clus-tered cells. Cell segmentation is crucial to this work since tracking and subsequent analyses depend on the segmen-tation results. In our analyses, active contour without edges was used since it is not dependent on initialization, noise and boundary leakage by using intensity gradients [20,21]. The energy functional for regularization term is controlled by the length terms only and it was set accord-ing to the resolution of fluorescence intensity. The two phase level-set method is able to identify cells with maxi-mum shape information since it handles sharp corners and cusps of the objects well. Thus, the original shapes of cells are retained yielding accurate features. Since dynamics of cell is dependent on geometric centroid, cell shape has to be accurately segmented. We subjectively evaluated segmentation results from different methods and confirmed that slight changes in the methods could dislodge the cell boundary by several pixels but did not affect the global boundary movement. Since we used run length of the boundary, minor boundary displacement did not affect the overall downstream analysis.
The spatiotemporal tracking method does not assume overlapping of cell boundaries between adjacent frames. It is able to handle dividing cells by using a set of heuris-tics. Four different scenarios are encountered during matching: (i) a cell in the current frame could match a cell in the proceeding frame (a successful match), (ii) no matching for cells in both frames (cells moving out of focus), (iii) one cell in current frame matches with more than one cell in the proceeding frame (possible cell divi-sion), and finally (iv) more than one cell in the current frame matches with only one cell in the proceeding frame (over segmentation). For differentiating case (iii) and case (iv), matching between second and third frame are checked to see whether a cell in multiple matches has its
own unique characteristics. If a cell matches its counter-parts in second and third frame, then we conclude that this cell has divided in the middle frame. If it has only one match in the third frame, then we conclude that this cell might have been over-segmented in the second frame. We used the same settings for weights as suggested by authors [22].
Classification of cell features
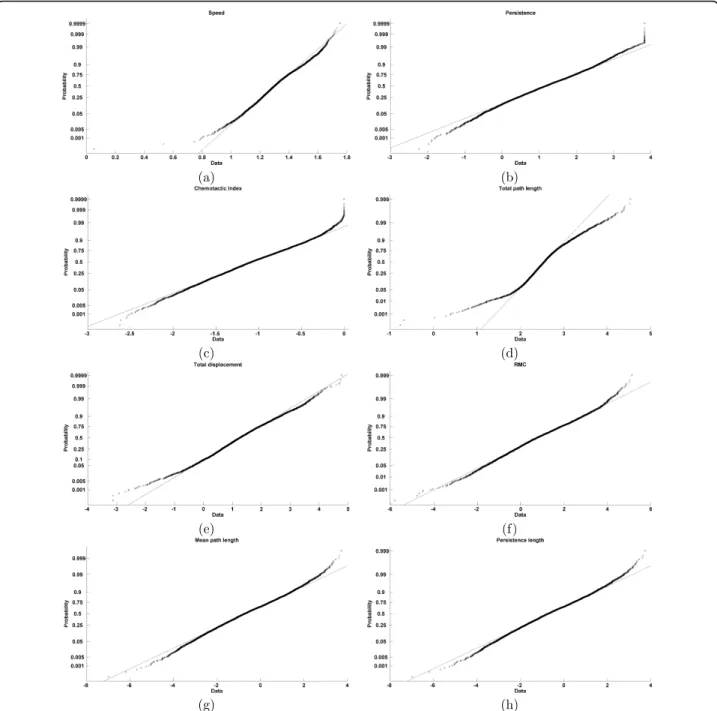
The classification of cells is done in two steps. First, the numbers of clusters are found by modeling features by using a Gaussian mixture model; second, unsupervised K-means clustering was used with the number of clusters, obtained with GMM model. Since underlying structure of distribution of cell features are unknown, unsupervised approaches are more suitable. However, K-means cluster-ing requires to know the number of clusters a priori. In order to implement Gaussian mixture models, cell features have to be normally distributed. We used probability plots and chi-square goodness-of-fit to test for Gaussianity of features. Probability plot is a graphical method for deter-mining whether sample data conforms to a hypothesized distribution decided upon visual examination. The data is sorted and plotted against the midpoint in the jump of the empirical cumulative distribution function (CDF) on
Y-axis. The CDFF(z), describes the probability that a
ran-dom variablez with a given probability distribution takes
on a value less than or equal to a specific value. The mid-point is given by (j – 0.5)/N for jth sorted value from a
sample size ofN. This plot also includes a reference line
joining the first and third quartile and extrapolated out to the ends, which is useful for judging whether data follows a normal distribution. A departure from normality is indi-cated by presence of points away from the reference line (Fig. 1). All features except one, the total path length con-formed to normality test. Since the cluster membership did not change significantly by removing total path length, this feature was included to derive the cell classes. A chi-square goodness-of-fit test also showed that Gaussian
mixture modeling is appropriate to represent heteroge-neous cell populations (Table 1).
The GMM model was computed for every possible
number of subpopulations in the dataset (K = 2, 3, …
100). To eliminate the influence of convergence failures, each run was attempted up to 5 times with new initial conditions until convergence was reached. MDL criteria were used since it can lead to a consistent estimator even for large values of observations. For each value of K, MDL was calculated after convergence in the EM step. The optimal value of K corresponds to minimum MDL. In our dataset, this method identified four distinct subclasses from dynamic features. These classes were termed as (i) Class 1, (ii) Class 2, (iii) Class 3, and (iv) Class 4. The features for individual classes are tabulated in Table 2.
Classification of edge features
The cell images sampled at 12 different time points pro-vided a vector of values of protraction and retraction velocities respectively. This vector constitutes to an edge print of a cell, characterizing the membrane movement of the cell over time. For dataset with 12 time points, the features are computed using the adjacent frames. Finally we get a feature set of 11 protrusion features and 11 retraction features and thus 22 features in total. This set of measurements provides novel dynamic features to cap-ture individual cell movements and membrane (edge) dynamics. This measurement does not necessarily inform about cell migration, since membrane retraction and pro-trusion without translocation can lead to high values. Reference sets for each cell class were estimated by K-means clustering. The initial centroids for K-means were obtained by performing the clustering phase on a random 10% sample of the data. Since the choice of initial cluster centroids is important, only 10% of ran-domly sampled data was used for K-means clustering. The centroids obtained from the subsamples (first phase) was used as seeds in the clusters for the second phase
Figure 1 Tests of normality of features: every cross in the plot corresponds to midpoint in the jump of empirical cumulative distribution function on Y axis to sorted data in X axis (number of cells=5415).
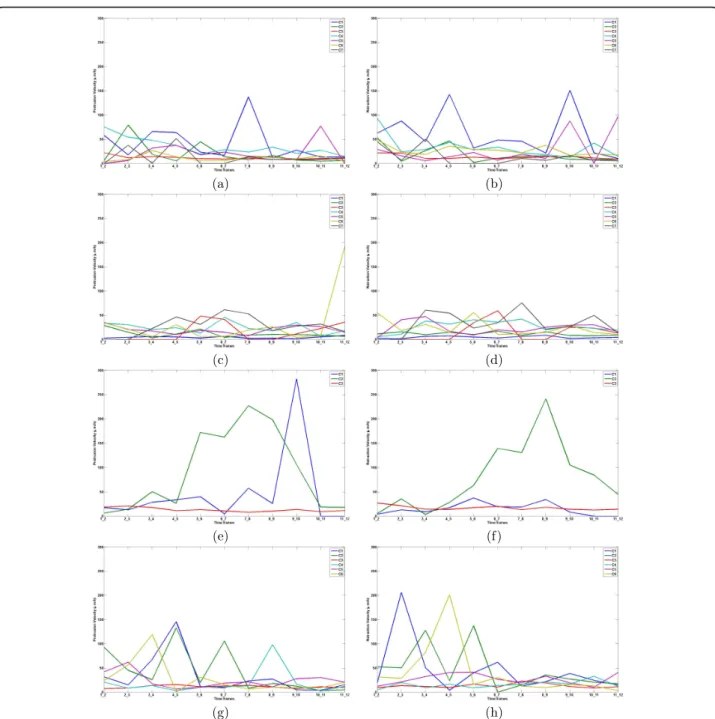
which used all the data. This procedure overcomes the problem of initialization in K-means clustering. About 1000 iterations were used each time to get the cluster centroids and members. K-means identified dif-ferent number of sub-clusters in each of the cell classes (Fig. 2a - 2h).
Correlation of cell and edge features
To evaluate correlation between cell and edge features, Spearman’s rank correlation (r) and multiple correlation analysis (R2
) were used on averaged dynamic and edge features over time. The Spearman rank correlation is a non-parametric measure of statistical dependence between two features using the ranks of features and is less sensitive to outliers. For this analysis, MATLAB
function‘corrcoef’ with type ‘Spearman’ was used.
Cor-relation coefficient was computed for every pair of moti-lity and edge features and the results were reported for
statistically significant correlations atp < 0.05. The
p-values were computed by transforming the correlation to create a t-statistic ( ts =r 1N−−r22 ; wherer =
correla-tion coefficient,N = number of samples) having N – 2
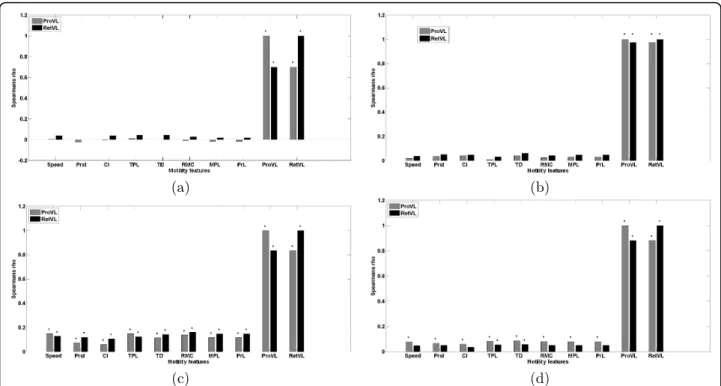
degrees of freedom and under the assumption that fea-tures are normally distributed. Rank correlations indi-cated that both motility and edge features varied in the degree of their correlation among clusters of cell dynamics (Fig. 3). The correlation plots in Figs. 3a - 3d show that the level of correlation varies among different classes. Multiple correlation measures the
goodness-of-fit in linear regression; the‘speed’ was the dependent
variable and all other features (motility and edge fea-tures) were the predictors in regression analysis. This analysis showed strong positive correlation for all the
features (R2 = 0.97). In order to account for bias due to
outliers in the regression analysis, we also performed jackknife cross-validation (results are given in Table 3). This qualitatively prove the existence of correlation of edge patterns with whole cell motility in individual classes.
• Class 1: This class consists of cells with low speed and persistence. The pattern shows that active membrane ruf-fling may not translate into active cell movement. It might have even restricted the cells overall movement which is evident from the low total displacement feature. For
exam-ple, NRK49F cells with defect inrho or adducin have been
shown to have active lamellopodial ruffling, while being unable to migrate [23] (Fig. 2a and 2b).
• Class 2: Cells with medium speed and persistence showing positive correlation for protrusion and retrac-tion. Similar protrusion and high retraction activity may be the reason for multiple peaks of edge features over the length of time (Fig. 2c and 2d).
• Class 3: This class is represented by fast moving cells displaying high speed and persistence and is positively correlated with edge movement features. These cells also had the highest edge activity which may help in moving the cell over long distances with high persistence. When the static features of these cells were analyzed they had typical fan shaped morphology (Fig. 2e and 2f).
• Class 4: These cells frequently change directionality as indicated by low persistence. Edge features are also posi-tively correlated to dynamic features and this suggests that the frequent change in direction may be accompanied by a respective change in edge movements. Although the cells change direction, they travel within a limited radius more like in spiral motion. This can be seen from the low total displacement and mean path length compared to class 3. Even though, the cell speed is greater than Class 3, the cells do not travel in a constant direction (as indicated by low persistence) and tend to display a spiral or circular concentric motion (Fig. 2g and 2h).
In order to determine which features contributed to the diversity of correlation patterns, or rather influenced the type of motility pattern adapted by any cell, factor analysis was performed on all four sub-clusters. This method has been proven efficient in describing cell shape dynamics in cancer cells [24]. This method postu-lates the existence of a small number of latent factors which explains the systematic contribution of the origi-nal features. The number of factors that should be retained is suggested by the Kaiser criterion (factors with Eigenvalues more than or equal to one should be retained) [25]. For class 1 and class 2, six factors were retained which accounted for 91.6% and 90.1% of the
Table 1 Chi-square goodness-of-fit for dynamic features
Feature c2 p value
Speed 2.62 < 0.001
Persistence 2.19 < 0.001 Chemotactic Index 9.92 < 0.001 Total path length 43.10 0.78 Total displacement 7.53 < 0.001 Random motility coefficient 7.07 < 0.001 Mean path length 4.40 < 0.001 Persistence length 4.40 < 0.001
Table 2 Feature values of individual clusters
Feature Class 1 Class 2 Class 3 Class 4 Speed (µm2/h) 9.50 9.53 11.95 12.32
Persistence (h) 1.46 8.93 10.57 0.82 Chemotactic Index 0.10 0.41 0.34 0.34 Total path length (µm) 15.07 14.46 16.89 17.27 Total displacement (µm) 1.85 6.10 6.55 6.04 Random motility coefficient 2.32 8.30 56.76 21.96 Mean path length (µm) 0.30 1.50 3.41 1.98 Persistence length (µm) 13.87 85.1 126.31 10.10
variance respectively. For class 3 and class 4, seven fac-tors were retained and they accounted for 88.2% and 89.0% of the variance respectively (Table 4). Factor 1 indicated the presence of high number of edge fea-tures. In particular, protrusion and retraction features extracted from initial six time points (Table 5 ). Factor 2 had predominantly cell dynamics features. The remaining factors contained edge features sampled from middle to end time points. These findings con-clude that the motility patterns are decided largely by cell membrane features observed in the initial time points.
Conclusion
Non-genetic heterogeneity in cell populations arises from a combination of intrinsic and extrinsic factors. This het-erogeneity has been measured for gene transcription, phosphorylation, cell morphology, drug perturbations, and used to explain various aspects of cellular physiology. Our understanding of individual players in cell migration pro-cess is increasing; but there remains a vital gap to be filled concerning how they are coordinated spatially and tempo-rally. New techniques are needed which can quantify dynamic cell movements at the level of single cell resolu-tion in an automated manner.
Here, we report multivariate analysis of different sets of motility features through a meaningful combination of both novel (edge) and existing (centroid based) dynamic features. The first set of measurements has been already proved to improve subpopulation analysis. The second set of features is a novel measurement of edge activity. These
features capture pixel movement, either through protrusion or retraction frame by frame over the entire length of observation. Since these measurements are temporally sampled, it is suitable to study cell activity over time. These features are unique and not necessarily a measurement of cell migration, as membrane protrusion-retraction is possi-ble without translocation. Our data indicate different levels of correlation between sets of features, depending on the dynamic classes they belong to. This type of relationship was expected for this cell line due to its highly motile nat-ure. Our findings compare well with previous literature [23].
The introduction of edge features is the major contribu-tion of this work since it captures edge activity of large number of cells from high throughput imaging platforms in a way that no other profiling methods we are aware of have previously demonstrated. Our profiling method was able to provide additional insights which might have been missed using population based cell migration techniques or classi-cal motility assays. To conclude, we have identified hetero-geneous edge patterns of related dynamic profiles and validated our correlation patterns by comparing with pre-vious publications. The dynamic profiles were obtained from cell displacement data by GMM clustering. Edge prints from these subclasses were further used to character-ize heterogeneity arising due to different edge movements. The patterns arising from statistical correlation analysis were validated by comparing with previous publications. We also provided statistical evidence that initial time point edge features influence the motility patterns that a cell adapts.
(a) (b)
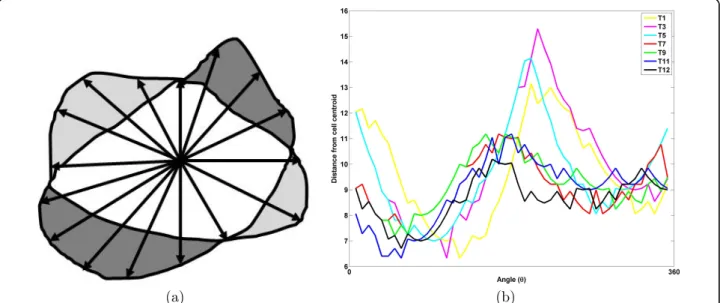
Figure 2 Edge prints for reference population from edge classes: left panel shows protrusion activity and right panel shows retraction activity for: class 1 (a and b); class 2 (c and d); class 3 (e and f); class 4 (g and h). The lines in each subplot represent edge prints of reference cells of each edge class.
Methods
Segmentation and tracking of cells
Level-set was used to segment cells from images, inde-pendently at all the time frames [20]. The image gradient was used to stop the evolution of level-sets. Touching cells were further separated by a marker-controlled watershed that uses initially segmented cells as shape
markers for marking function [26]. The segmented cells in adjacent frames were correspondingly matched by spa-tiotemporal matching scheme that uses features like size, intensity, and spatial coordinates for matching [22]. The tracks of cells were subsequently corrected for mis-matches and only those cells moving for the entire period of observation were included for further analysis.
(a) (b)
(c) (d)
(e) (f)
(g) (h)
Figure 3 Correlation analysis of dynamic and edge features: Spearman rank correlation coefficient (r) demonstrates various levels of correlation among the features in different dynamic classes. The subplots (a), (b), (c), and (d) depicts distribution of features in four dynamic classes obtained from GMM clustering (class 1, class 2, class 3, and class 4). A black bullet on top of the bar represents significant correlation at (p < 0.05). CI: chemotactic index, TPL: total path length, TD: total displacement, RMC: random motility coefficient, MPL: mean path length, PrL: persistence length, ProVL: protrusion velocity, RetVL: retraction velocity.
Dynamic feature extraction
Dynamic features of cells are classified into two cate-gories based on motility modes: features describing whole cell dynamics and features representing membrane
(edge) dynamics. Two different methods were employed to extract the two sets of features.
Cell dynamics
A persistent random walk model was used to study directional migration of cells, in which the geometric centroid of a cell forms the basis for modeling cell moti-lity [27]. A total of eight cell dynamics features were extracted: speed, persistence, chemotactic index (CI), total path length (TPL), total displacement (TD), ran-dom motility coefficient (RMC), mean path length (MPL) and persistence length (PrL) [3]. The set of sub-populations obtained from these features represent cell classes. The overview of the analysis is illustrated in the flowchart of Fig. 4 and Algorithm 1 summarises the dif-ferent steps in the analysis.
Algorithm 1 Statistical analysis of features
Step 1: Deteermine the number of clusters by GMM modeling Step 2: Perfoorm K-means clustering to find subclasses
Step 3: Determinee correlation between edge features and cell features, usiing (i) Spearman rank correlation coefficient
(ii) Multiple correlation analysis
Step 4: Perform factor analysis to deetermine which factors are most correlated
A Gaussian mixture model (GMM) is used to repre-sent feature distribution of the cell classes. The initial subpopulations were obtained by Gaussian mixture modeling of the cell feature distribution where each cluster is represented by a parametric distribution. The
weighted sum of K component Gaussian densities is
given by: p x w G xk k k k K ( : )q = ( :m ,∑ ) =
∑
1where x={ }xi iN=1 is a set of N samples and xi is the
ith sample comprising of n features, {wk k}K=1 are the
mixture weights, and { ( :G x mk,∑k)}kK=1 are component
Gaussian densities. Each class density is a n-variate
Gaussian function. The mixture weights satisfy the
con-straints that wk k K = =
∑
1 1. The complete Gaussian mixture
Table 3 Leave-one-out cross-validation of correlation (mean ± std.dev) ×10–4
Feature Protrusion Retraction Speed 55.78 ± 2.93 380.18 ± 3.20 Persistence –263.96 ± 0.40 –5.33 ± 0.45 CI –31.24 ± 1.98 377.82 ± 3.08 Class 1 TPL 95.82 ± 4.64 418.90 ± 3.66 TD 15.80 ± 2.52 426.21 ± 2.11 RMC –88.32 ± 2.22 285.68 ± 1.60 MPL –168.86 ± 1.33 169.92 ± 3.51 PrL –169.26 ± 1.33 169.84 ± 3.51 Speed 182.02 ± 1.15 346.26 ± 0.80 Persistence 329.58 ± 0.65 498.53 ± 0.82 CI 411.92 ± 3.50 489.53 ± 1.28 Class 2 TPL 84.41 ± 0.02 299.57 ± 0.48 TD 427.14 ± 1.57 602.57 ± 0.80 RMC 242.12 ± 2.11 413.72 ± 2.78 MPL 280.53 ± 1.41 452.87 ± 1.82 PrL 280.41 ± 1.41 452.79 ± 1.82 Speed 149.57 ± 2.49 127.09 ± 1.82 Persistence 736.33 ± 0.53 119.63 ± 0.96 CI 599.60 ± 0.12 105.90 ± 0.28 Class 3 TPL 148.64 ± 1.62 123.50 ± 1.37 TD 114.32 ± 0.63 142.40 ± 1.23 RMC 137.66 ± 1.47 159.82 ± 1.26 MPL 116.66 ± 3.48 148.01 ± 2.52 PrL 116.66 ± 3.48 148.01 ± 2.52 Speed 776.22 ± 0.01 481.55 ± 0.36 Persistence 655.13 ± 0.61 504.45 ± 0.44 CI 595.36 ± 0.40 360.12 ± 0.55 Class 4 TPL 828.03 ± 1.53 539.72 ± 0.20 TD 872.38 ± 0.40 562.92 ± 0.40 RMC 808.41 ± 0.43 506.85 ± 0.31 MPL 796.51 ± 0.19 503.66 ± 0.23 PrL 776.57 ± 0.19 503.71 ± 0.23
Table 4 Factor analysis on cell and edge features
Class 1 Class 2 Class 3 Class 4
Factor name (number) Var Cum. Var Var Cum.Var Var Cum.Var Var Cum.Var Initial edge features (1) 35.69 35.69 35.08 35.08 38.64 38.64 24.92 24.92 Motility features (2) 24.39 60.06 22.02 57.28 17.79 56.44 20.58 45.50 Intermediate/late edge features (3) 10.19 70.28 13.80 71.09 11.12 67.56 11.90 57.4 Late retractions (4) 9.44 79.73 7.83 78.93 7.13 74.70 10.62 68.03 Intermediate retractions (5) 6.32 86.05 7.76 86.70 6.08 80.79 10.45 78.48 Intermediate retractions (6) 5.59 91.65 3.47 90.17 3.99 84.79 5.87 84.36
model is parameterized by the mean vector, covariance matrices and mixture weights from all component den-sities. These parameters are collectively represented as q ={(wk,mk,∑k)}kK=1 where (µk, Σk) denotes the mean
and covariance of thekth component.
Given training vectors and a GMM configuration, the parameters of GMM are given by maximum likelihood
(ML) estimates ˆq .
ˆ arg max log ( : )
q q
q
= p x
ML estimates of parameters are obtained by using Expectation Maximization (EM) algorithm. In order to find the optimal number of classes, a minimum descrip-tion length (MDL) estimator was employed [28]. MDL is an information theoretic model selection principle pre-sumed as the most compact representation of data in the probabilistic network. MDL estimator finds the model
order ˆK by the following criteria:
ˆ arg min{ log ( | , ˆ) log( )}
K p x K L Nn
K
= − q +1
2
Where L=K
(
1+ +n (n+21)n)
−1. The penalty term in MDL includes the total number of features to avoid over-fitting of the model.Edge dynamics
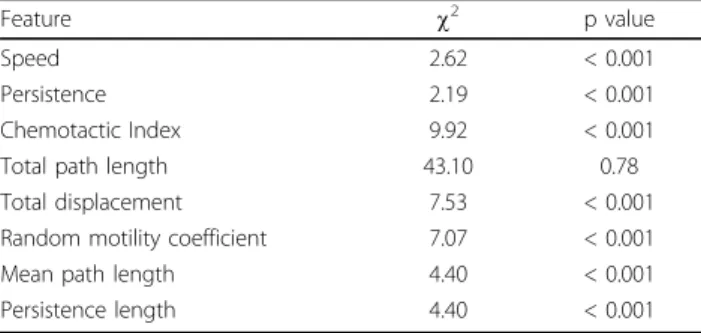
Cell membrane features are defined as features character-izing movements of cell protrusions and retractions. Given a sequence of cell boundaries at the image frames, cells are aligned using their centroids. Edge pixels are then transformed to polar coordinates from Cartesian
coordinates and a set ofM markers { }fm mM=1 are placed
on the segmented boundaryj of the cell marked by the
radial coordinate. The movement of cell boundaryjtat
timet to jt+τat timet + τ is calculated by measuring the
displacements of individual markers within an intervalτ.
Protrusion and retraction features {( , )}p rt t tT=1 of a cell
are computed as a function of marker displacements over
Table 5 Factor loading matrix computed from covariance matrix for all classes
Feature Factor 1 Factor 2 Factor 3 Factor 4 Factor 5 Factor 6 Factor 7
Speed -0.79 Persistence 0.82 CI 0.56 TPL -0.91 TD -0.73 RMC 0.87 MPL 0.96 PrL 0.96 p1,2 0.82 p2,3 0.56 p3,4 -0.80 p4,5 0.68 p5,6 -0.96 p6,7 0.88 p7,8 -0.93 p8,9 -0.93 p9,10 -0.45 p10,11 -0.85 p11,12 0.83 r1,2 0.40 r2,3 0.84 r3,4 0.80 r4,5 -0.91 r5,6 0.75 r6,7 -0.91 r7,8 -0.91 r8,9 -0.96 r9,10 -0.69 r10,11 -0.87 r11,12 -0.79
sampling intervalsτ. A positive displacement is consid-ered as a protrusion and negative displacement a retrac-tion. The protrusion and retraction features are
computed from total boundary displacementν(t : τ) of
the cell at timet:
n( : )t t t (fm t, t fm t,) m M = + − =
∑
2 1where jm,tdenotes the location of themth marker of
the boundary jtat timet. The protrusion ptand
retrac-tionrtfeatures at each time pointt are then computed
and features are extracted thereof. Fig. 5 illustrates the steps involved in evaluating edge features.
Cells are classified by a set of protrusion and retrac-tion features measured over all the time points. These features provide an idea about the activity level of a cell at respective time instances and are used to cluster
(a) (b)
(c) (d)
(e) (f)
(g) (h)
Figure 4 IIllustration of subpopulation identification using cell dynamics features: the time-lapse images are segmented by level-set framework followed by marker controlled watershed to separate touching cells; tracking by spatiotemporal scheme, clustering (GMM followed by K-means, and analysis of correlation among features).
the cells. Clustering was performed using K-means algorithm.
Acknowledgements
This article has been published as part of BMC Bioinformatics Volume 12 Supplement 13, 2011: Tenth International Conference on Bioinformatics– First ISCB Asia Joint Conference 2011 (InCoB/ISCB-Asia 2011): Bioinformatics. The full contents of the supplement are available online at http://www. biomedcentral.com/1471-2105/12?issue=S13.
Author details
1Computation and Systems Biology, Singapore-MIT Alliance, Nanyang
Technological University, Singapore 637460.2BioInformatics Research Centre, Nanyang Technological University, Singapore 637553.3Sloan School of
Management, Massachusetts Institute of Technology, Cambridge, MA 02142, USA.4Department of Biological Sciences, National University of Singapore,
Singapore 117543.5Centre for BioImaging Sciences, National University of
Singapore, Singapore 117543.6Mechanobiology Institute, National University
of Singapore, Singapore 117411.7Department of Biological Engineering,
Massachusetts Institute of Technology, Cambridge, MA 02142, USA.
Authors’ contributions
MV conceived, designed and wrote the paper. RW participated in the design of study and helped draft the manuscript. AN performed the wet-lab experiments and collected the data, PM designed the wet-lab experiments, JCR conceived, designed and helped write paper. All authors read and approved the final manuscript.
Competing interests
The authors declare that they have no competing interests.
Published: 30 November 2011
References
1. Slack DM, Martinez DE, Lani WF, Altschuler JS: Charaterizing heterogeneous cellular responses to pertubations. PNAS 2008, 105(49):19306-19311.
2. Sachs K, Perez O, Pe’er D, Lauffenburger DA, Nolan GP: Causal protein signaling networks derived from multiparameter single cell data. Science 2005, 308:523-529.
3. Veronika M, Evans J, Matsudaira P, Welsch R, Rajapakse J: Sub-population analysis based on temporal features of high content images. BMC Bioinformatics 2009, 10:S4.
4. Dieterich P, Odenthal-Schnittler M, Mrowietz C, Kramer M, Sasse L, Oberleithner H, Schnittler HJ: Quantitative morphodynamics of endothelial cells within confluent cultures in response to fluid shear stress. Biophysical Journal 2000, 79(3):1285-1297.
5. Bakal C, Aach J, Church G, Perrimon N: Quantitative morphological signatures define local signalling networks regulating cell morphology. Science 2007, 316:1753-1756.
6. Vallotton P, Gupton S, Waterman-Storer C, Danuser G: Simultaneous mapping of filamentous actin flow and turnover in migrating cells by quantitative fluorescent speckle microscopy. Proc Natl Acad Sci USA 2004, 101:9660-9665.
7. Ponti A, Machacek M, Gupton S, Waterman-Storer C, Danuser G: Two distinct actin networks drive the protrusion of migrating cells. Science 2004, 305:1782-1786.
8. Waterman-Storer C, Worthylake R, Liu B, Burridge K, Salmon E: Microtubule growth activates Rac1 to promote lamellipodial protrusions. Nature Cell Biology 1999, 1:45-50.
9. Dunn G, Zicha D: Dynamics of fibroblast spreading. Journal of Cell Science 1995, 108:1239-1249.
10. Zicha D, Dobbie IM, Holt MR, Monypenny J, Soong DYH, Gray C, Dunn GA: Rapid actin transport during cell protrusion. Science 2003, 300:142-145. 11. Biyasheva A, Svitkina T, Kunda P, Baum B, Borisy G: Cascade pathway of filopodia formation downstream of SCAR. Journal of Cell Science 2004, 117:837-848.
(a) (b)
(c) (d)
Figure 5 Illustration of edge feature extraction: (a) measuring protrusion or retraction displacements: heavy gray represents the protruded region while the light gray region represents retracted region, and (b) edge activity along the whole periphery, difference in radial length represented in Y axis and angleθ is represented in X axis.
12. Ghosh M, Song X, Mouneimne G, Sidani M, Lawrence D, Condeelis J: Cofilin promotes actin polymerization and defines the direction of cell motility. Science 2004, 304(5671):743-746.
13. Machacek M, Danuser G: Morphodynamic profiling of protrusion phenotypes. Biophysical Journal 2006, 90(4):1439-1452.
14. Woo S, Gomez T: Rac1 and RhoA promote neurite outgrowth through formation and stabilization of growth cone point contacts. Journal of Neuroscience 2006, 26:1418-1428.
15. R Development Core Team: R: a language and environment for statistical computing. R Foundation for Statistical Computing Vienna, Austria; 2009, http://www.R-project.org. ISBN 3-900051-07-0.
16. Otsu N: A threshold selection method from gray-level histograms. IEEE Transactions on Systems, Man, and Cybernetics 1979, 9:62-66.
17. Gonzalez R, Woods R: Digital Image Processing. IEEE Transactions on Systems, Man, and Cybernetics New Jersey, USA: Prentice Hall; 2003. 18. Vincent L, Soille P: Watersheds in digital spaces: and efficient algorithm
based on immersion simulations. IEEE Transactions on Pattern Analysis and Machine Intelligence 1991, 13(6):583-598.
19. Kass M, Witkin A, Terzopoulos D: Snakes: active contour models. International Journal of Computer Vision 1997, 1(4):321-331.
20. Chan T, Vese L: Active contours without edges. IEEE Transactions on Image Processing 2001, 10(2):266-277.
21. Mark N, Albert A: Feature extraction and image processing. Oxford, UK: Academic press; 2008.
22. Rajapakse J, Veronika M, Cheng J: Spatiotemporal cell profiling for cell phase identification. Submitted to Bioinformatics .
23. Dove A: Membrane specilization. Journal of Cell Biology 1999, 145(2). 24. Heckman AC, Jamasbi JR: Describing cell shape dynamics in transformed
cells through latent factors. Experimental Cell Research 1999, 246:69-82. 25. Kaiser HF: The application of electronic computers to factor analysis.
Educational and Psychological Measurement 1960, 20:141-151. 26. Cheng J, Rajapakse J: Segmentation of clustered nuclei with shape
markers and marking function. IEEE Transactions on Biomedical Engineering 2009, 56(3):741-748.
27. Zygourakis K: Quantification and regulation of cell migration. Tissue Engineering 1996, 2:1-16.
28. Rissanen J: A universal prior for integers and estimation by minimum description length. Annals of Statistics 1983, 11(2):417-431.
doi:10.1186/1471-2105-12-S13-S19
Cite this article as: Veronika et al.: Correlation of cell membrane dynamics and cell motility. BMC Bioinformatics 2011 12(Suppl 13):S19.
Submit your next manuscript to BioMed Central and take full advantage of:
• Convenient online submission
• Thorough peer review
• No space constraints or color figure charges
• Immediate publication on acceptance
• Inclusion in PubMed, CAS, Scopus and Google Scholar
• Research which is freely available for redistribution
Submit your manuscript at www.biomedcentral.com/submit