HAL Id: hal-02912573
https://hal-normandie-univ.archives-ouvertes.fr/hal-02912573
Submitted on 11 Aug 2020HAL is a multi-disciplinary open access archive for the deposit and dissemination of sci-entific research documents, whether they are pub-lished or not. The documents may come from teaching and research institutions in France or abroad, or from public or private research centers.
L’archive ouverte pluridisciplinaire HAL, est destinée au dépôt et à la diffusion de documents scientifiques de niveau recherche, publiés ou non, émanant des établissements d’enseignement et de recherche français ou étrangers, des laboratoires publics ou privés.
Nanosized zeolites as a gas delivery platform in a
glioblastoma model
Clement Anfray, Sarah Komaty, Aurélien Corroyer-Dulmont, Moussa Zaarour,
Charly Hélaine, Hayriye Özçelik, Clélia Allioux, Jérôme Toutain, Kamila
Goldyn, Edwige Petit, et al.
To cite this version:
Clement Anfray, Sarah Komaty, Aurélien Corroyer-Dulmont, Moussa Zaarour, Charly Hélaine, et al.. Nanosized zeolites as a gas delivery platform in a glioblastoma model. Biomaterials, Elsevier, 2020, 257, pp.120249. �10.1016/j.biomaterials.2020.120249�. �hal-02912573�
1
Nanosized zeolites as a gas delivery platform in a glioblastoma model
Running headline: Nanozeolites to deliver gases to glioblastoma
Clément Anfray1, Sarah Komaty2, Aurélien Corroyer-Dulmont1, Moussa Zaarour2, Charly
Helaine1, Hayriye Ozcelik1, Clélia Allioux1, Jérôme Toutain1, Kamila Goldyn2, Edwige Petit1,
Karim Bordji1, Myriam Bernaudin1, Valentin Valtchev2, Omar Touzani1, Svetlana Mintova2*,
and Samuel Valable1*
1Normandie Université, UNICAEN, CEA, CNRS, ISTCT/CERVOxy group, GIP Cyceron, Caen,
France.
2Normandie Université, ENSICAEN, UNICAEN, CNRS, Laboratoire Catalyse et Spectrochimie
(LCS), 14050 Caen, France.
*Correspondence and requests for materials should be addressed to: Samuel Valable (samuel.valable@cnrs.fr)
Fax : +33 2 31 47 02 22
GIP CYCERON, Bd H Becquerel, BP 52259 14074 Caen, France
Svetlana Mintova (mintova@ensicaen.fr) Fax : +33 2 31 45 28 21
2 LCS, ENSICAEN, CNRS
6, boulevard Maréchal Juin 14050 Caen, France
Abstract
Approaches able to counteract, at least temporarily, hypoxia, a well-known factor of resistance to treatment in solid tumors are highly desirable. Herein, we report the use of nanosized zeolite crystals as hyperoxic/hypercapnic gas carriers for glioblastoma. First, the non-toxic profile of nanosized zeolite crystals in living animals (mice, rats and non-human primates) and in various cell types is presented. Second, the ability of the nanosized zeolites to act as a vasoactive agent for a targeted re-oxygenation of the tumor after intravenous injection is shown. As attested by an MRI protocol, the zeolites were able to increase oxygenation and blood volume specifically within the brain tumor whilst no changes in the healthy- non tumoral brain- were observed. The first proof of concept for the use of metal-containing nanosized zeolites as a tool for vectorization of hyperoxic/hypercapnic gases in glioblastoma is revealed.
3
Introduction
Even with aggressive conventional therapies for the treatment of glioblastoma (GBM), the most lethal primary brain tumor [1], the median survival of patients remains around 15 months [2]. Hypoxia, a feature of numerous solid tumors, including GBM [3], is defined as the disproportion between oxygen supply and oxygen consumption. Hypoxia arises from increased metabolic rate of cancer cells, poorly efficient tumor vascularization and augmented interstitial pressure, leading to poor oxygen diffusion. Hypoxia activates adaptive survival mechanisms in cancer cells which in turn stimulate tumor development [4]and resistance to treatments [5]. Hypoxia is a well-known factor of poor prognosis for GBM [6]. Therefore, there is great need to develop a new approach to increase oxygen pressure selectively into the hypoxic tumor, at least transiently. Several methods have been proposed to alleviate hypoxia in tumors. Among them, one cites pure oxygen breathing or carbogen (5% CO2 mixedwith 95% O2) breathing. Nevertheless, the global
outcomes were disappointing in terms of sensitization to radiation therapy in GBM [7,8]. Moreover, in rodent models of GBM, through the use of advanced magnetic resonance imaging (MRI), we have shown that carbogen improved the cerebral blood volume (CBV) and the oxygenation in the healthy brain tissue at the expense of the GBM tumor [9].
Because of the atypical structure and organization of the tumor vasculature and the absence of a lymphatic system [10], many nanoparticles (NP) of several chemical natures have been
examined as transporters of contrast agents and anti-cancer agents due to their aptitude to specifically reach tumors [11]. Furthermore, numerous NP have been designed to sensitize the tumor to RT. These comprise gadolinium-containing NP which rely on the Auger effect [12], NP that decrease the self-repair of cancer cells following RT [13], NP which protect the healthy tissue by reducing oxidative stress [14], and NP that generate oxygen in-situ [15]. Nevertheless,
4 few NP were developed to locally and selectively carry gases in the tumor. Even if micron-sized particles were recently demonstrated to carry approximately five times more oxygen that human red blood cells, their use to alleviate hypoxia in brain tumors is not satisfactory because of their large diameter [16].
Among nanoparticles, zeolites with their excellent chemical selectivity, large sorption ability and absence of toxicity [17–19], are now more and more considered for biomedical usage [20,21], including cancer therapy [22,23]. Zeolites are crystalline, porous materials made of
interconnected TO4 tetrahedra, where T atoms are represented by Si and Al. They have regular
framework structures composed of cages and pores of different sizes and forms [24]. Zeolites have been synthesized at the nanosize scale and stabilized in colloidal suspensions [25]. The ordered pores of the zeolites are able to adsorb and desorb various molecules, which allow them to act as efficient carriers of several gases such as NO, CO2 and O2 [18,26]. The tunable chemical
composition of these crystalline materials allows them to adapt to different chemical
environments and thus to display an important stability in acidic and alkaline media. Moreover, adding different metal cations (Fe, Gd) inside the nanosized zeolites can modify their
functioning, and therefore significantly rises the interest of zeolite NP as an instrument for imaging [27] and gases carriage [18]applications. Consequently, it is of interest to examine nanosized zeolites as gas transporters to alleviate hypoxia in GBM.
In the present study, in a rodent model of GBM, we provide a proof of concept to precisely carry O2 and/or CO2 to tumors through the use of metal-containing nanosized zeolite crystals with
FAU-type structure to enhance oxygenation and/or blood volume. Gadolinium (Gd) was introduced into the nanozeolites via ion exchange to be administered into the blood circulation and tracked using MRI.
5
Materials and Methods
Preparation of nanosized faujasite (Na-FAU) type zeolites
Stable suspensions of nanosized zeolite (Na-FAU) were prepared from colloidal precursor solution under hydrothermal conditions as we described earlier [28]. The as-prepared precursor suspension for Na-FAU zeolite was kept at room temperature for 24 h, followed by dehydration using freeze-drying method prior hydrothermal treatment at 50 C for 26 h. After the
hydrothermal treatment, the zeolite nanoparticles were purified by six step centrifuge (24,500 rpm, 45 min) and redispersed in double distilled water till pH of 7.
Ion exchange of nanosized faujasite (Gd-FAU) type zeolites
The purified zeolite suspensions (pH=7) were ion exchanged with gadolinium (III) nitrate hexahydrate (Gd(NO3)3.6H2O). 25 mL of Gd(NO3)3.6H2O (3 mM) were added to 5 mL Na-FAU
suspension (2.5%). The suspensions were then kept under stirring at room temperature for 1 h and then washed by double distilled water. This procedure was repeated twice to obtain the suspensions of ion-exchanged gadolinium (Gd-FAU) nanosized zeolites; pH=7.
Powder X-ray diffraction (XRD) analysis
Powder samples were measured using a PANalytical X'Pert Pro diffractometer with CuKα monochromatized radiation (λ = 1.5418 Å). The samples were scanned in the range of 4-50 °2θ with a step size of 0.02 °.
Transmission electron microscopy (TEM)
The crystal size, morphology and crystallinity of samples were analyzed by a transmission electron microscopy (TEM) using a JEOL 2010 FEG and a FEI LaB6 TECNAI G2 30UT
6 operated at 200 kV and 300 kV, respectively. Energy Dispersive Spectrometer (EDS) coupled with both microscopes was employed to analyze the chemical content of the zeolite nanocrystals.
Dynamic light scattering (DLS) and zeta potential analysis
The hydrodynamic diameter of nanosized zeolites in water was quantified through the use of Malvern Zetasizer Nano. The quantifications were carried out on samples after purification with a solid concentration of 1 wt%. Furthermore, the surface charge of nanosized zeolite was
examined by assessing the zeta potential value of the same suspensions.
N2 sorption analysis
N2 adsorption/desorption isotherms were evaluated by Micrometrics ASAP 2020 volumetric
adsorption analyzer. Samples were degassed at 250 °C under vacuum overnight before the evaluation. The external surface area and micropore volume were assessed by alpha-plot method using Silica-1000 (22.1 m2 g -1 assumed) as a reference. The micropore and mesopore size
distributions of solids were extracted from adsorption branch by the Nonlocal Density Functional Theory (NLDFT) and from the desorption branch using the Barret-Joyner-Halenda (BJH)
algorithm, respectively.
In-situ adsorption of CO2 and O2 on nanosizedzeolites
Powder samples of Na-FAU and Gd-FAU were pressed (~107 Pa) into self-supported disks (2
cm2 area, 20 mg.cm-2). Fourier-transform infrared (FTIR) spectra were acquired using a Nicolet
6700 IR spectrometer equipped with a mercury cadmium telluride (MCT) detector and an extended KBr beam splitter. Spectra were recorded in the 400−5500 cm-1 range at 4 cm-1 with
128 scans. The in situ was evacuated or flooded with different gases and also heated up to 577 °C. The samples were activated at 225 °C for 2 h under vacuum. Various amounts of CO2 (at 25
7 °C) or O2 (at -196 °C) were incorporated into the cell and maintained in equilibrium for 5 min at
the corresponding temperatures before recording each spectrum. The in situ IR measurements were performed with pure CO2 up to 4 Torr and pure O2 up to 100 Torr. Small doses of these
gases were introduced progressively, and saturation was achieved after loading ~50% of the specified quantities. The measurements with carbogen (5% CO2, 95% O2) were performed at
80-100 Torr, thus ensuring the presence of higher O2 and CO2 quantities than those required to
achieve saturation upon adsorbing the gases in pure form. All the spectra were normalized to the sample’s mass and plotted as absorbance per gram over the wavelength.
Chemical analyses
The chemical composition of as prepared and ion-exchanged zeolites was determined by inductively coupled plasma (ICP) optical emission spectroscopy using a Varian ICP-OES 720-ES.
Loading of gases in zeolite nanocrystals
Na-FAU and Gd-FAU were loaded with CO2 and/or O2 by bubbling of the desired gas into the
zeolite suspensions with a flow rate of 80 ml/min for 30 min.
Analysis of oxygen release in aqueous and hypoxic conditions
A hypoxia workstation (IN VIVO2 500, 3M) was employed to reach a steady and precise gas content of the atmosphere by replacing O2 by nitrogen. Phosphate buffered saline (PBS) solution
was equilibrated with the gas mix of the hypoxia workstation 1 h before the experiment. A closed reaction vessel containing 12 ml of equilibrated PBS at 37 °C was used, and a dissolved oxygen sensor (SevenGo (Duo) pro™ / OptiOx™, Mettler Toledo) was positioned inside the hypoxia chamber. Before any test, baseline was determined by quantifying the oxygen saturation
8 for 30 min in the PBS solution within the vessel. Zeolites nanocrystals were then added to the system (500 µl, 1 wt%) and oxygen dissolved in the PBS solution was quantified continuously for 1 h. The oxygen liberation capacity of as prepared and ion-exchanged nanosized zeolites was compared to oxygen-saturated water (used as control). The oxygen release ability of Na-FAU zeolites nanocrystals was assessed at several levels of O2 (21, 5, 1 and 0.1% of O2). To
discriminate the amount of O2 provided by the nanosized zeolites from the oxygen contained in
the dispersing solution (pure water), the values were subtracted from those of saturated water alone.
Cell culture
The U87-MG human glioblastoma cell line (ATCC, Manassas, VA, USA), HEK 293 cells (Human Embryonic Kidney cells, ATCC) and bEnd.3 (mouse brain endothelial cells, ATCC) were employed. Cells were maintained in DMEM (Sigma-Aldrich, France) supplemented with 10% fetal bovine serum (Eurobio, France), 2 mM glutamine (Sigma-Aldrich, France) and 100 U/ml penicillin/streptomycin (Sigma-Aldrich, France). Cells were kept in culture at 37 °C with 5% CO2 and 95% humidity.
Primary culture of cortical neurons, from E15–E16 mouse embryos (Swiss mice; CURB, France) and astrocytes, obtained from neonatal (1 to 3-day-old) mice (Swiss, CURB, France) were prepared as previously described [29].
Cells exposure to zeolite nanocrystals
Cells were exposed to zeolites (Na-FAU and Gd-FAU) during 48 h. Nanosized zeolites were added into the wells at a final concentration of 1, 10, 50 or 100 µg/ml and. Distilled water was used as reference tests.
9
Analysis of cell viability
Cells were seeded in 24-wells plates before adding zeolites. The viability of the cells was measured 48 h following the treatment with zeolites nanoparticles using the WST-1 assay (Roche, France).
Analysis of cell cycle
The cell cycle of U87-MG and HEK 293 was analyzed using flow cytometry at several time points after cell treatment with 100 µg/ml zeolite nanoparticles. was determined (Beckman Coulter’s Gallios flow cytometer, Beckman Coulter SAS, France). The cell distribution in a given phase of cell cycle was determined using propidium iodide labelling and analyzed through the use of the Kaluza software.
Analysis of genotoxicity
Cells were placed in 24-well plates on coverslips and then exposed to 100 µg/ml of nanosized zeolites during 14, 24 or 48 h. Cells irradiated with X-rays (4 Gy, XRad225Cx, PXi) were used as a positive control. Cells were thereafter fixed in 4% PFA during 1 h at 4 °C.
Immunohistochemistry staining of phospho-histone H2AX and micronuclei was performed as previously described [30]. The following primary antibodies were used: phospho-histone H2AX (ser139) (1/200; Cell Signalling Technology, D175, 2577S) and Alexa-555-conjugated anti-rabbit secondary antibody (1/200; Molecular Probes, A21429). Pictures were acquired on a Leica DMi8 microscope.
Animal studies
All animal studies were performed according to European directive (2010/63/EU) and approved by the Ethics committee (agreement numbers: 12727 and N/02-12-11/25/12-14). The animals
10 were purchased from the Centre Universitaire de Ressources Biologiques (CURB, A14118015, France). Athymic nude rats (250–300 g) were housed in specific pathogen free cages and were fed with γ-irradiated laboratory food. Three marmosets (Callithrix jacchus, 285-370g; aged 36-64 months) were employed. Data are reported according to ARRIVE guidelines.
All experimentations were performed on anesthetized animals (isoflurane 1.5-2%; N2O/
O270/30%).
Delivery of zeolite nanocrystals
Na-FAU or Gd-FAU nanosized zeolites (100 µl, 1 wt%) or distilled water were daily injected intraperitoneally in Swiss mice during 5 consecutive days. The body weight of the animals was quantified daily during 1 month.
CO2-loaded Gd-FAU zeolites (300 µl, 1 wt%) or distilled water were administered i.v. to Wistar
rats (CURB, A14118015, France) and arterial blood samples were taken each 5 min to measure CO2 partial pressure and the pH (RapidLab 348 analyzer; Siemens, Germany).
Glioblastoma model
The model of GBM used was previously described [31]. Briefly, U87-MG cells (5.104 cells in 3
µl PBS-glutamine 2mM) were implanted in the striatum of nude rats.
MRI studies
All the MRI examinations were performed on a 7 teslas horizontal magnet (Bruker, Ettlingen). In order to quantify the volume of the tumor, T2-weighted MRI examinations were completed once a week according to the following parameters (RARE, acceleration factor of 8; TR/ TEeff= 5000/62.5 msec; number of experiments (NEX) = 2; 20 contiguous slices; resolution = 0.15×0.15×0.5 mm3). Tumor volumes were calculated using ImageJ.
11 To track Gd-FAU nanosized zeolites, T1w-FLASH images (TR= 500 ms, TEeff= 10.32 ms; NEX=1; 10 slices; resolution = 0.15×0.15×1.5 mm3) were acquired before and every 2 min after
the intravenous injection of 300 µl Gd-FAU zeolite suspension (1 wt%) to tumor bearing rats. In order to quantify the fractional cerebral blood volume (fCBV), P904® (200 µmol.kg-1, Guerbet
Research) was used as a contrast agent as previously described [9]. fCBV was calculated before and every 5 min during 1 h following an intravenous administration of 300 µl of gas loaded Gd-FAU (1 wt%). Image analyses were performed through the use of ImageJ software [9].
To measure oxygen saturation (SatO2) in the brain tissue, we used the BOLD-MRI approach
described in our previous article [9]. SatO2 maps before and after administration of gas loaded
Gd-FAU zeolites were obtained in every rat.
Statistical analyses
Data are expressed as mean ± s.d. Statistical analyses were carried out with JMP programs (SAS Institute) and are detailed in each caption.
Results and discussion
Physicochemical characterizations of nanosized zeolites
The main physicochemical properties of Na-FAU zeolite nanocrystals are presented in Figure 1 and Table S1 and S2. Powder X-ray diffraction (XRD) patterns of the zeolite samples contain broad peaks reflecting the small particle size and typical Bragg peaks corresponding to FAU-type zeolite (Figure 1A). As quantified by DLS, the nanosized zeolites have an average size of 15-20 nm in water suspension with a concentration of 1% (Figure 1B). The zeta potential () of the zeolite nanocrystals in water suspension is -43 to -45 mV, which corresponds to highly stable negatively surface charged crystals (Figure 1C). Porosity of zeolite nanoparticles was analyzed
12 by N2 sorption approach (Figure 1D and Table S2). The data show type I isotherm at low P/P0,
indicative of microporous materials and high adsorption uptake at P/P0 > 0.8. This shows the
high textural mesoporosity of closely packed zeolite nanoparticles with similar particle dimensions.
Na-FAU zeolites with a large supercage (1.1 nm) have been reported as gas carriers [32] and drug delivery systems [22,33]. The adsorption of pure O2, pure CO2 and carbogen (95% O2, 5%
CO2) was examined. The physisorbed O2 and physi- and chemi-sorbed CO2 in zeolites were
assessed by in-situ IR spectroscopy following the incorporation of precise amounts of the desired gases into the zeolite samples (Figure 2A). Following the addition of carbogen, the intensity of the band at 2346 cm-1 corresponding to the physisorbed CO
2 (Table S3) is similar to that of pure
CO2 (see the experimental section), indicating that the presence of O2 does not substantially
influences the capacity of Na-FAU towards CO2. On the other hand, the intensity of physisorbed
O2 is lowered by 50% upon using carbogen for loading of zeolites (Figure 2B). These results
suggest that in the presence of carbogen (O2 and CO2), a competition of the two gases on the
available cationic sites takes place. The band area corresponding to the adsorbed O2 decreased
which may be related, at least in part, to the low sensitivity of the IR. While the band area corresponding to the adsorbed CO2 from the pure gas and carbogen is similar due to the same
concentration delivered to the sample (see experimental section). Additionally, our theoretical studies showed that a strong affinity of FAU-type zeolites towards O2, even in the presence of
CO2, is expected [34].
The capacity of zeolites to release the oxygen payload was analyzed in aqueous solutions preliminary equilibrated at various O2 concentrations in a hypoxic workstation to mimic the
oxygen-13 loaded Na-FAU were introduced in the system and the evolution of oxygen concentration was recorded (Figure 2C). Interestingly, the quantity of O2 released from the Na-FAU zeolites
increased as the initial O2 concentration in the system decreased. Indeed, when the oxygen
concentration in the workstation was set at 21%, the oxygen release was 0.6 ± 0.23 mg/ml. When the O2 concentration was set at 5% (which corresponds to the percentage of O2 measured in the
healthy brain [35]), the release increased to 0.96 ± 0.15 mg/ml. Further, the oxygen release continued increasing to 1.28 ± 0.12 and to 1.5 ± 0.10 mg/ml at 1% and 0.1% of oxygen in the workstation. These oxygen concentrations were chosen to mimic the area of severe hypoxia found in some regions of GBM [36]. More precisely, at 0.1% O2, addition of 5 mg of Na-FAU
zeolite to the system resulted in the delivery of 0.26 mg of oxygen per ml (value deducted from water alone). Based on these experimental results, we calculated that Na-FAU zeolites can transport approximatively 19 mmol of O2/g. To compare with other products developed to
deliver oxygen, for example the HEMOXYCarrier®, a natural giant extracellular haemoglobin from polychaete annelids [37] and the Polymer Hollow Microparticles [16] can transport 0.0433 mmol and 0.511 mmol of O2/g respectively. These experimental results suggest that the lower
the external O2 concentration is, the more zeolites release their O2 payload. This result reinforces
the idea that they could be appropriate gas carriers (CO2 and/or O2) to reduce hypoxia in the
most hypoxic regions of the tumor.
Evaluation of nanosized zeolites toxicity in vitro
Several cell types originating from many organs were exposed to zeolite suspensions with
concentrations ranging from 1 to 100 µg/ml for 48 h (Figure 3A). DLS analyses of the nanosized zeolites in serum show no aggregation of the nanoparticles (Figure S2A). In addition, we
14 conditions used to mimic tumor microenvironment (pH = 6.8). Zeolites were diluted at a
concentration of 1% in serum and in saline and stored at 37 °C for 9 days. The results are presented in Figure S2B. The aspect of the samples did not change with time, no sedimentation was observed, which confirms their stability in these milieu.
U87-MG and primary cell cultures of brain origin were employed to address potential toxicities to the brain tumor and to the surrounding brain cells. We also used an endothelial cell line (bEnd.3) and a kidney cell line (HEK 293) as a reflection of possible systemic toxicities after intravenous injections. No significant toxicity was found for all cell lines and astrocytes (Figure
3A). Neurons seemed to be the most sensitive as the maximal loss in cell viability (65.8 ± 2.1%)
was encountered at the concentration of 100 µg/ml of Na-FAU (Figure 3A). The introduction of Gd in the zeolite nanocrystals decreased the toxicity to neurons. This may be attributed to the affinity of Na-FAU for calcium in ion exchange process. In neurons’ cytosol, it could compete with the neuronal calcium signaling and calcium regulation. When Gd is present in zeolites, the exchange with calcium would be lower, resulting in the reduction of the toxicity. Another explanation would be that the activation of Na/K ATPase in the presence of Na-FAU may enhance potential excitotoxicity processes. To further reinforce this study, the cell cycle was analyzed on U87-MG and HEK 293 by flow cytometry. No difference in the cell distribution at different phases of cell cycle between the control group and cells exposed to nanosized zeolites was observed (Figure 3B).
Some reports show, in vitro, a genotoxicity of certain types of NP (with a comparable size of about 30 nm) although devoid of cytotoxicity [38]. Therefore, a possible genotoxic action of nanosized zeolites was explored using γH2AX as a marker of DNA double strand breaks and a micronucleus formation assay as a marker of mitotic death. No difference in U87-MG γH2AX
15 positive cells was observed between control conditions and after exposure to Na-FAU. A slight reduction was observed in the marker after 24 h of experiment in all experimental settings. HEK 293 cells showed a higher number of γH2AX positive cells in comparison to the U87-MG cells, and the rate of γH2AX labelled cells was slightly higher at 24 h and 72 h of exposure.
Nevertheless, no difference in the percentage of γH2AX positive cells after exposure to nanosized zeolites compared to the control condition was detected (Figure 3C, E). These findings are also strengthened by the assessment of micronuclei formation. For HEK 293 and U87-MG cells, the amount of cells with micronuclei was less than 10% and was not modified through the time. Moreover, exposure of the cells to the nanosized zeolites did not change the formation of micronuclei. In addition, we found that the presence of Gd did not induce any further toxicity relative to the original Na-FAU zeolites nor further DNA damage (Figure 3D,
E). Overall, the data indicate that, in vitro, nanosized zeolite crystals are devoid of cytotoxicity
and genotoxicity on a wide range of cell types.
Evaluation of toxicity of nanosized zeolites in living animals
Although nanoparticles are promising for several clinical applications, their toxicity for living organisms is still a crucial issue. To evaluate the potential adverse actions associated with administrations of nanosized zeolites, studies were performed in vivo. First, nanosized zeolites were injected into mice during five successive days, for a total dose of 5 mg per mouse (Figure
4A). The body weight curves of mice did not change in comparison to controls. Irrespective of
the group and as expected, mice gained 7 g (37% of their initial weight) during the time of the experiment, suggesting no adverse effects of nanosized zeolites on mice.
Though rodent models are helpful to understand the pathophysiology and test treatments of human diseases, more pertinent animal models are necessary to reflect the adverse reactions that
16 might be displayed in humans. Chiarelli and colleagues proved the importance of employing both rodents and non-human primates for better assessment of the safety of NP [39].
In order to confirm the low toxicity of the nanosized zeolites, the nanosized zeolite suspension (300 µl, 1 wt%) was injected intravenously to non-human primates (marmoset), and
physiological parameters were monitored. A slight decrease in arterial pressure was observed following the injection, from 63 mmHg to 42 mmHg, nevertheless, it was fully reversed in less than 2 min (Figure 4B). In addition, blood samples were taken from marmosets. A
representative blood analysis is represented for one marmoset (14 years old, male, 350 g) to follow the effects of Na-FAU on blood counts, kidney and liver health of the animal. In order to have general view about the health of animal, whole blood was tested one week before injection (Day -7). Same parameters were tested one hour after injection (Day 0) and one week after injection (Day +7) and are summarized in Table 1.
RBC, hemoglobin, hematocrit and platelets values stayed in the normal range during the course of the experiment. Although the measurements of monocytes and eosinophils were found to be in the normal range, the recorded values were close to lower boundary. We observed a slight
increase in the number of basophils which may indicate mild allergic reactions. Creatinine and ASAT are commonly measured clinically as part of diagnostic renal and liver function tests respectively. Creatinine concentration along two weeks may show that Na-FAU zeolites have been filtrated/cleared through kidneys. The amount of transaminase also remained in the normal range. Overall, these results clearly demonstrate the absence of acute and chronic toxicity of zeolites nanocrystals applied to living animals.
Post-synthesis modifications of nanosized zeolites and in vivo tracking of nanosized zeolites in healthy and tumor bearing rats
17 We introduced low amount of extra framework gadolinium to track the particles with ICP-MS and MRI. ICP-MS analysis showed that the ion-exchange process resulted in incorporation of 1.24 wt% of Gd in zeolites (Gd-FAU) (Table S1). The presence of Gd did not induce any remarkable change in the crystal properties including size, shape, porosity and surface charge (Figure S3). Typical Bragg peaks corresponding to FAU-type zeolite are fully preserved after ion exchange treatment (Figure S3A). The introduction of cations into zeolites was used to track their ability to reach the brain tumor after intravenous injection using MRI. Gd-containing zeolites were already examined as MRI contrast agents and showed no leakage of Gd outside the framework [27]. First, a Gd-FAU zeolite suspension was injected intravenously in healthy rats and blood samples were then taken at various times thereafter. Quantification of Gd-FAU zeolites in the blood was performed through the characterization of gadolinium content with ICP-MS. The blood half-life of Gd-FAU was calculated to be 12 min (Figure 5A).
Gd-FAU zeolites were then used to assess whether nanosized zeolites can extrasavate into the brain tumors after intravenous injection. An earlier study reported that nanosized zeolites are expected to extravasate and accumulate in the tumor tissue, although they should not cross the intact blood-brain barrier [40]. To verify this assumption, dynamic T1-weighted MRI was employed to examine the distribution of zeolite nanocrystals in the brain after their intravenous administration. A hyper-signal was observed specifically inside the tumor (Figure 5B, C, Figure
S4, and supplementary movie) while no change was observed in the healthy brain. The
comparison between the T1-w images acquired before and after the injection of zeolites confirms that the zeolite nanocrystals efficiently reached the tumor and not the surrounding healthy tissue (Figure 5B). The maximum increase in the signal was seen 100 sec after the administration of
18 zeolites (Figure 5C). These results confirmed the precise transfer of the zeolite nanocrystals in the tumor, thus they could be evaluated as a carrier to deliver hypercapnic/hyperoxic gases.
Nanosized zeolites as gas carriers to specifically reoxygenate brain tumors
Multiparametric MRI was employed in a human GBM model to assess the functional benefits of nanosized zeolites as gas (CO2 and O2)carriers. Furthermore, the incorporation of gadolinium
into zeolites did not modify their capacity to adsorb O2 (Figure S5A). Likewise, Gd-FAU
zeolites retained their ability to adsorb CO2, while in a lower amount (3.98 to 2.28 and 3.79 to
1.36 band area/g for physisorbed and chemisorbed CO2 respectively, Figure S5B).
Variations in cerebral blood volume (CBV) following an intravenous administration of zeolites loaded with CO2 was measured and expressed as ΔCBV. Findings showed an augmentation of
the CBV inside the tumor relative to the non-tumoral tissue (Figure 6A, B), leading to a difference of 15% between the two tissues at 15 min following the injection. When water saturated with CO2 was used as a reference, a maximum difference of 5% of the CBV in the
tumor compared to the healthy tissue was quantified (Figure 6A, B). Upon switching the pure CO2 with carbogen into Gd-FAU for concurrently targeting the CBV and the tissue oxygenation,
the difference of signal measured between the healthy and tumor tissues was 5.36% (Figure 6A,
C). These results indicate that nanosized zeolites loaded with dilatator gases induce
vasodilatation specifically within the tumor. This contrast with our earlier investigations in which inhalation of carbogen induced a CBV increase in the healthy brain but not in the tumor [9].
The SatO2-MRI, an imaging technique reported to precisely assess tissue hypoxia [41], was used
before and after administration of the zeolites loaded with CO2 or carbogen (ΔSatO2). The
19
6A, B, C). The intravenous delivery of zeolites carrying CO2 and carbogen increased ΔΔSatO2 of
6.43% and 2.07%, respectively. A further control was made by injecting zeolites (300 µl, 1 wt%) without gas loading. No augmentation of CBV or SatO2 was found, indicating that the
modifications are due to the transported gas and not to the nanosized zeolites per se (Figure S6). Furthermore, when CBV and SatO2-MRI were quantified 1 h after injection, the selective
enhancement of CBV and SatO2 within the tumor relative to the healthy tissue was still observed.
The lower effect observed with carbogen suggest that the primary effect is an increased perfusion via vasodilatory effects of CO2 and not reoxygenation via oxygen delivery. However, the U87
GBM model used here is moderately hypoxic. [31,42]. Figure 2C shows that the delivery of oxygen by zeolites is dependent on the oxygen pressure of the environment. Therefore, the relatively high oxygen pressure in the U87-MG tumor could prevent the zeolites from releasing their oxygen payload.
We lastly evaluated if any release of CO2 could also take place in the systemic circulation by
monitoring the arterial partial pressure of CO2 (PaCO2) following the intravenous administration
of the Gd-FAU loaded with CO2 (Figure 6D). The PaCO2 displayed a 4 mmHg increase at 10
min following the injection of CO2-loaded zeolites(Figure 5A), paralleled by a minor
acidification, i.e., the pH decreased from 7.53 to 7.36 (Figure 6E). These modifications were not observed when the control sample was used. The augmentation of the PaCO2 could lead to a
vasodilation. Therefore, dynamic BOLD-MRI was achieved to follow the variations of blood flow of large vessels, such as the venous sinus. The intravenous administration of nanosized zeolites loaded with CO2 induced an enhancement of the BOLD signal up to 5.05 ± 6.50% as did
inhalation of 5% CO2. Administration of control sample or pure nanosized zeolites without CO2
20 able to carry CO2 or carbogen and enhance blood volume and oxygenation specificallywithin the
tumor.
Conclusions
The use of functional nanoparticles has dramatically increased during the last years in the management of tumors [43,44]. In the present study, the use of nanosized zeolite particles as a specific gas carrier for glioblastoma was studied. Additionally, thanks to the presence of Gd into zeolite nanoparticles, enabling MRI tracking, the specific accumulation of nanosized zeolites in the tumor was evidenced. The nanosized zeolites loaded with CO2 or carbogen (95% O2 and 5%
CO2) successfully increased the blood volume and oxygenation in the tumor tissue relative to the
healthy tissue (Figure 7).
No clinical study that evaluated targeted administration of hyperoxic/hypercapnic in
glioblastoma is available. A clinical investigation has suggested that hyperbaric oxygen therapy (HBOT) may improve the efficacy of radio-chemotherapy to some extent [45]. In clinical trials, although it showed some positive results in certain types of cancer (e.g. head & neck), carbogen inhalation resulted in unsatisfactory outcomes for GBM patients [7,8]. In our previous study [9], we showed that inhalation of carbogen increased cerebral blood flow in the healthy tissue at the expense of the tumor, a phenomenon that can be attributed to the flow steal phenomenon and argues for the importance of vectorization of hyperoxic/hypercapnic gases to specifically target the tumor using zeolites. The specific delivery of hyperoxic gases has been suggested using micronsize particles [16] but their use to alleviate hypoxia in brain tumors is not satisfactory because of their large diameter disabling any entry into the tumor. The use of perfluorochemicals has also been recently discussed [46] but this strategy has not been applied to GBM.
21 In addition, the results from our study show that the amount of oxygen released from the zeolites is higher as the external oxygen pressure is low. Interestingly, it can be assumed that in an organism, the zeolite would keep its oxygen payload until it reaches a hypoxic region, like in GBM, where they would release the oxygen. In addition, the incorporation of other cations may improve the ability of zeolites to carry more oxygen.
Zeolites are alternative nanoparticles designed for delivery of oxygen. In addition to their stability, one of the main advantages of zeolites is their versatility. By adjusting their physicochemical properties, it is possible to add new features, such as the incorporation of cations, used in the present study to image the particles in vivo. In addition, heavy atoms such as gadolinium can act as radiosensitizers [12], and this could be combined with the gas delivery in a context of radiotherapy treatment. Other studies reported on the incorporation of gamma-emitter such as 111In3+ via ion exchange [20]. Nanosized zeolites have been used to encapsulate and deliver siRNA and chemotherapy agents, in particular temozolomide [22]. Functionalized zeolites with antibodies were also used to target cancer cells [23]. Nanosized zeolites could simultaneously gather many features to improve the diagnosis and treatment of GB. Another important advantage of nanozeolites is their stability and limited toxicity.
In summary, the great potential of nanosized zeolites for glioblastoma is envisioned. This paves the way for the use of carbogen-loaded or oxygen loaded Gd-containing zeolite nanocrystals to the tumor, as a carrier of (i) high-Z containing elements and (ii) re-oxygenating gases, which are known to increase the efficiency of radiotherapy.
After demonstrating that nanozeolites could be used to improve tumor oxygenation, further in vivo studies will be performed to address their efficacy together with conventional therapies used for glioblastoma.
22
Acknowledgements
This work was supported by the Conseil Régional de Basse-Normandie (Projet Emergence ZEOXY), the European Union-Fonds Européen de Développement Régional (FEDER), the CNRS, the University of Caen Normandy and the Institut National du Cancer (INCA 11699).
References
[1] D.N. Louis, A. Perry, G. Reifenberger, A. von Deimling, D. Figarella-Branger, W.K. Cavenee, H. Ohgaki, O.D. Wiestler, P. Kleihues, D.W. Ellison, The 2016 World Health Organization Classification of Tumors of the Central Nervous System: a summary, Acta Neuropathol. 131 (2016) 803–820. https://doi.org/10.1007/s00401-016-1545-1.
[2] O.L. Chinot, W. Wick, W. Mason, R. Henriksson, F. Saran, R. Nishikawa, A.F. Carpentier, K. Hoang-Xuan, P. Kavan, D. Cernea, A.A. Brandes, M. Hilton, L. Abrey, T. Cloughesy, Bevacizumab plus Radiotherapy–Temozolomide for Newly Diagnosed Glioblastoma, New
England Journal of Medicine. 370 (2014) 709–722.
https://doi.org/10.1056/NEJMoa1308345.
[3] A. Chakhoyan, J.-S. Guillamo, S. Collet, F. Kauffmann, N. Delcroix, E. Lechapt-Zalcman, J.-M. Constans, E. Petit, E.T. MacKenzie, L. Barré, M. Bernaudin, O. Touzani, S. Valable, FMISO-PET-derived brain oxygen tension maps: application to glioblastoma and less aggressive gliomas, Sci Rep. 7 (2017). https://doi.org/10.1038/s41598-017-08646-y.
[4] K.L. Eales, K.E.R. Hollinshead, D.A. Tennant, Hypoxia and metabolic adaptation of cancer cells, Oncogenesis. 5 (2016) e190. https://doi.org/10.1038/oncsis.2015.50.
[5] W.R. Wilson, M.P. Hay, Targeting hypoxia in cancer therapy, Nature Reviews Cancer. 11 (2011) 393–410. https://doi.org/10.1038/nrc3064.
[6] S.M. Evans, K.W. Jenkins, H.I. Chen, W.T. Jenkins, K.D. Judy, W.-T. Hwang, R.A. Lustig, A.R. Judkins, M.S. Grady, S.M. Hahn, C.J. Koch, The Relationship among Hypoxia, Proliferation, and Outcome in Patients with De Novo Glioblastoma: A Pilot Study, Transl Oncol. 3 (2010) 160–169.
[7] J.H. Kaanders, J. Bussink, A.J. van der Kogel, ARCON: a novel biology-based approach in radiotherapy, The Lancet Oncology. 3 (2002) 728–737. https://doi.org/10.1016/S1470-2045(02)00929-4.
[8] R.W.M. van der Maazen, H.O.M. Thijssen, J.H.A.M. Kaanders, A. de Koster, A. Keyser, M.J.J. Prick, J.A. Grotenhuis, P. Wesseling, A.J. van der Kogel, Conventional radiotherapy combined with carbogen breathing and nicotinamide for malignant gliomas, Radiotherapy and Oncology. 35 (1995) 118–122. https://doi.org/10.1016/0167-8140(95)01534-N.
[9] A. Chakhoyan, A. Corroyer-Dulmont, M.M. Leblond, A. Gérault, J. Toutain, L. Chazaviel, D. Divoux, E. Petit, E.T. MacKenzie, F. Kauffmann, N. Delcroix, M. Bernaudin, O. Touzani, S. Valable, Carbogen-induced increases in tumor oxygenation depend on the vascular status of the tumor: A multiparametric MRI study in two rat glioblastoma models, J. Cereb. Blood Flow Metab. (2016). https://doi.org/10.1177/0271678X16663947.
[10] H. Maeda, H. Nakamura, J. Fang, The EPR effect for macromolecular drug delivery to solid tumors: Improvement of tumor uptake, lowering of systemic toxicity, and distinct tumor
23 imaging in vivo, Advanced Drug Delivery Reviews. 65 (2013) 71–79. https://doi.org/10.1016/j.addr.2012.10.002.
[11] S.C. Baetke, T. Lammers, F. Kiessling, Applications of nanoparticles for diagnosis and therapy of cancer, Br J Radiol. 88 (2015) 20150207. https://doi.org/10.1259/bjr.20150207. [12] S. Kotb, A. Detappe, F. Lux, F. Appaix, E.L. Barbier, V.-L. Tran, M. Plissonneau, H.
Gehan, F. Lefranc, C. Rodriguez-Lafrasse, C. Verry, R. Berbeco, O. Tillement, L. Sancey, Gadolinium-Based Nanoparticles and Radiation Therapy for Multiple Brain Melanoma Metastases: Proof of Concept before Phase I Trial, Theranostics. 6 (2016) 418–427. https://doi.org/10.7150/thno.14018.
[13] A.R. King, C.D. Corso, E.M. Chen, E. Song, P. Bongiorni, Z. Chen, R.K. Sundaram, R.S. Bindra, W.M. Saltzman, Local DNA Repair Inhibition for Sustained Radiosensitization of High-Grade Gliomas, Mol Cancer Ther. 16 (2017) 1456–1469. https://doi.org/10.1158/1535-7163.MCT-16-0788.
[14] J. Xie, Y. Yong, X. Dong, J. Du, Z. Guo, L. Gong, S. Zhu, G. Tian, S. Yu, Z. Gu, Y. Zhao, Therapeutic Nanoparticles Based on Curcumin and Bamboo Charcoal Nanoparticles for Chemo-Photothermal Synergistic Treatment of Cancer and Radioprotection of Normal Cells, ACS Appl Mater Interfaces. 9 (2017) 14281–14291. https://doi.org/10.1021/acsami.7b02622.
[15] Y. Sheng, H. Nesbitt, B. Callan, M.A. Taylor, M. Love, A.P. McHale, J.F. Callan, Oxygen generating nanoparticles for improved photodynamic therapy of hypoxic tumours, J Control Release. 264 (2017) 333–340. https://doi.org/10.1016/j.jconrel.2017.09.004.
[16] R.P. Seekell, A.T. Lock, Y. Peng, A.R. Cole, D.A. Perry, J.N. Kheir, B.D. Polizzotti, Oxygen delivery using engineered microparticles, PNAS. 113 (2016) 12380–12385. https://doi.org/10.1073/pnas.1608438113.
[17] C. Anfray, B. Dong, S. Komaty, S. Mintova, S. Valable, Acute Toxicity of Silver Free and Encapsulated in Nanosized Zeolite for Eukaryotic Cells, ACS Appl. Mater. Interfaces. (2017). https://doi.org/10.1021/acsami.7b00265.
[18] V. Georgieva, C. Anfray, R. Retoux, V. Valtchev, S. Valable, S. Mintova, Iron loaded EMT nanosized zeolite with high affinity towards CO2 and NO, Microporous and Mesoporous Materials. 232 (2016) 256–263. https://doi.org/10.1016/j.micromeso.2016.06.015.
[19] L.C.J. Thomassen, D. Napierska, D. Dinsdale, N. Lievens, J. Jammaer, D. Lison, C.E.A. Kirschhock, P.H. Hoet, J.A. Martens, Investigation of the cytotoxicity of nanozeolites A and Y, Nanotoxicology. 6 (2012) 472–485. https://doi.org/10.3109/17435390.2011.587901. [20] M.M. Tsotsalas, K. Kopka, G. Luppi, S. Wagner, M.P. Law, M. Schäfers, L. De Cola, Encapsulating 111In in Nanocontainers for Scintigraphic Imaging: Synthesis, Characterization, and In Vivo Biodistribution, ACS Nano. 4 (2010) 342–348. https://doi.org/10.1021/nn901166u.
[21] M. Tsotsalas, M. Busby, E. Gianolio, S. Aime, L. De Cola, Functionalized Nanocontainers as Dual Magnetic and Optical Probes for Molecular Imaging Applications, Chem. Mater. 20 (2008) 5888–5893. https://doi.org/10.1021/cm8006183.
[22] O. Martinho, N. Vilaça, P.J.G. Castro, R. Amorim, A.M. Fonseca, F. Baltazar, R.M. Reis, I.C. Neves, In vitro and in vivo studies of temozolomide loading in zeolite structures as drug delivery systems for glioblastoma, RSC Adv. 5 (2015) 28219–28227. https://doi.org/10.1039/C5RA03871E.
24 [23] R. Marega, E.A. Prasetyanto, C. Michiels, L. De Cola, D. Bonifazi, Fast Targeting and Cancer Cell Uptake of Luminescent Antibody-Nanozeolite Bioconjugates, Small. 12 (2016) 5431–5441. https://doi.org/10.1002/smll.201601447.
[24] M. Zaarour, B. Dong, I. Naydenova, R. Retoux, S. Mintova, Progress in zeolite synthesis promotes advanced applications, Microporous and Mesoporous Materials. 189 (2014) 11– 21. https://doi.org/10.1016/j.micromeso.2013.08.014.
[25] S. Mintova, M. Jaber, V. Valtchev, Nanosized microporous crystals: emerging applications, Chem. Soc. Rev. 44 (2015) 7207–7233. https://doi.org/10.1039/C5CS00210A.
[26] D.G. Seifu, T.T. Isimjan, K. Mequanint, Tissue engineering scaffolds containing embedded fluorinated-zeolite oxygen vectors, Acta Biomaterialia. 7 (2011) 3670–3678. https://doi.org/10.1016/j.actbio.2011.06.010.
[27] E. Csajbók, I. Bányai, L. Vander Elst, R.N. Muller, W. Zhou, J.A. Peters, Gadolinium(III)-loaded nanoparticulate zeolites as potential high-field MRI contrast agents: relationship between structure and relaxivity, Chemistry. 11 (2005) 4799–4807. https://doi.org/10.1002/chem.200500039.
[28] H. Awala, J.-P. Gilson, R. Retoux, P. Boullay, J.-M. Goupil, V. Valtchev, S. Mintova, Template-free nanosized faujasite-type zeolites, Nat Mater. 14 (2015) 447–451. https://doi.org/10.1038/nmat4173.
[29] M. Bernaudin, A. Bellail, H.H. Marti, A. Yvon, D. Vivien, I. Duchatelle, E.T. Mackenzie, E. Petit, Neurons and astrocytes express EPO mRNA: oxygen-sensing mechanisms that involve the redox-state of the brain, Glia. 30 (2000) 271–278.
[30] M.M. Leblond, E.A. Pérès, C. Helaine, A.N. Gérault, D. Moulin, C. Anfray, D. Divoux, E. Petit, M. Bernaudin, S. Valable, M2 macrophages are more resistant than M1 macrophages following radiation therapy in the context of glioblastoma, Oncotarget. 8 (2017) 72597– 72612. https://doi.org/10.18632/oncotarget.19994.
[31] A. Corroyer-Dulmont, E.A. Pérès, E. Petit, L. Durand, L. Marteau, J. Toutain, D. Divoux, S. Roussel, E.T. MacKenzie, L. Barré, M. Bernaudin, S. Valable, Noninvasive assessment of hypoxia with 3-[18F]-fluoro-1-(2-nitro-1-imidazolyl)-2-propanol ([18F]-FMISO): a PET study in two experimental models of human glioma, Biological Chemistry. 394 (2013). https://doi.org/10.1515/hsz-2012-0318.
[32] S. Komaty, C. Anfray, M. Zaarour, H. Awala, V. Ruaux, S. Valable, S. Mintova, A Facile Route toward the Increase of Oxygen Content in Nanosized Zeolite by Insertion of Cerium
and Fluorinated Compounds, Molecules. 23 (2018).
https://doi.org/10.3390/molecules23020037.
[33] N. Vilaça, R. Amorim, A.F. Machado, P. Parpot, M.F.R. Pereira, M. Sardo, J. Rocha, A.M. Fonseca, I.C. Neves, F. Baltazar, Potentiation of 5-fluorouracil encapsulated in zeolites as drug delivery systems for in vitro models of colorectal carcinoma, Colloids and Surfaces B: Biointerfaces. 112 (2013) 237–244. https://doi.org/10.1016/j.colsurfb.2013.07.042.
[34] S. Komaty, A. Daouli, M. Badawi, C. Anfray, M. Zaarour, S. Valable, S. Mintova, Incorporation of trivalent cations in NaX zeolite nanocrystals for the adsorption of O2 in the presence of CO2, Phys. Chem. Chem. Phys. 22 (2020) 9934–9942. https://doi.org/10.1039/D0CP00111B.
[35] M.Y. Koh, G. Powis, Passing the baton: The HIF switch, Trends Biochem Sci. 37 (2012) 364–372. https://doi.org/10.1016/j.tibs.2012.06.004.
25 [36] H. Kempf, M. Bleicher, M. Meyer-Hermann, Spatio-Temporal Dynamics of Hypoxia
during Radiotherapy, PLOS ONE. 10 (2015) e0133357.
https://doi.org/10.1371/journal.pone.0133357.
[37] T. Le Gall, V. Polard, M. Rousselot, A. Lotte, M. Raouane, P. Lehn, P. Opolon, E. Leize, E. Deutsch, F. Zal, T. Montier, In vivo biodistribution and oxygenation potential of a new generation of oxygen carrier, Journal of Biotechnology. 187 (2014) 1–9. https://doi.org/10.1016/j.jbiotec.2014.07.008.
[38] N. Bayat, V.R. Lopes, J. Schölermann, L.D. Jensen, S. Cristobal, Vascular toxicity of ultra-small TiO2 nanoparticles and single walled carbon nanotubes in vitro and in vivo, Biomaterials. 63 (2015) 1–13. https://doi.org/10.1016/j.biomaterials.2015.05.044.
[39] P.A. Chiarelli, R.A. Revia, Z.R. Stephen, K. Wang, M. Jeon, V. Nelson, F.M. Kievit, J. Sham, R.G. Ellenbogen, H.-P. Kiem, M. Zhang, Nanoparticle Biokinetics in Mice and
Nonhuman Primates, ACS Nano. 11 (2017) 9514–9524.
https://doi.org/10.1021/acsnano.7b05377.
[40] A. Karageorgis, S. Dufort, L. Sancey, M. Henry, S. Hirsjärvi, C. Passirani, J.-P. Benoit, J. Gravier, I. Texier, O. Montigon, M. Benmerad, V. Siroux, E.L. Barbier, J.-L. Coll, An MRI-based classification scheme to predict passive access of 5 to 50-nm large nanoparticles to tumors, Scientific Reports. 6 (2016). https://doi.org/10.1038/srep21417.
[41] T. Christen, B. Lemasson, N. Pannetier, R. Farion, C. Segebarth, C. Rémy, E.L. Barbier, Evaluation of a quantitative blood oxygenation level-dependent (qBOLD) approach to map local blood oxygen saturation, NMR Biomed. 24 (2011) 393–403. https://doi.org/10.1002/nbm.1603.
[42] S. Valable, A. Corroyer-Dulmont, A. Chakhoyan, L. Durand, J. Toutain, D. Divoux, L. Barré, E.T. MacKenzie, E. Petit, M. Bernaudin, O. Touzani, E.L. Barbier, Imaging of brain oxygenation with magnetic resonance imaging: A validation with positron emission tomography in the healthy and tumoural brain, J. Cereb. Blood Flow Metab. (2016). https://doi.org/10.1177/0271678X16671965.
[43] C. Chen, Y. Liu, H. Wang, G. Chen, X. Wu, J. Ren, H. Zhang, Y. Zhao, Multifunctional Chitosan Inverse Opal Particles for Wound Healing, ACS Nano. 12 (2018) 10493–10500. https://doi.org/10.1021/acsnano.8b06237.
[44] J. Wang, G. Chen, Z. Zhao, L. Sun, M. Zou, J. Ren, Y. Zhao, Responsive graphene oxide hydrogel microcarriers for controllable cell capture and release, Sci. China Mater. 61 (2018) 1314–1324. https://doi.org/10.1007/s40843-018-9251-9.
[45] L. Huang, W. Boling, J.H. Zhang, Hyperbaric oxygen therapy as adjunctive strategy in treatment of glioblastoma multiforme, Med Gas Res. 8 (2018) 24–28. https://doi.org/10.4103/2045-9912.229600.
[46] Z. Zhou, B. Zhang, H. Wang, A. Yuan, Y. Hu, J. Wu, Two-stage oxygen delivery for enhanced radiotherapy by perfluorocarbon nanoparticles, Theranostics. 8 (2018) 4898– 4911. https://doi.org/10.7150/thno.27598.
[47] D.W. McNees, B.J. Ponzio, R.W. Lewis, F.J. Stein, R.F. Sis, B.M. Levy, Hematology of common marmosets (Callithrix jacchus), Primates. 23 (1982) 145–150. https://doi.org/10.1007/BF02381447.
[48] D.W. McNees, R.W. Lewis, B.J. Ponzio, R.F. Sis, F.J. Stein, Blood chemistry of the common marmoset (Callithrix jacchus) maintained in an indoor-outdoor environment: Primate comparisons, Primates. 25 (1984) 103–109. https://doi.org/10.1007/BF02382300.
26
Author Contributions and competing interests
Author contribution: CA, SK, ACD, MZ, CH, HO, CA, JT, KG, SM, SV performed the experiments and analyzed the data. CA, EP, VV, OT, SM and SV interpreted the data. CA, KB, OT, SM and SV contributed to conception and design. CA, OT, SM and SV approved the final version.
Data availability
The datasets generated during and/or analyzed during the current study are available from the corresponding author on reasonable request.
27 Figure 1. (1.5-column fitting image)
20 nm 10 20 30 40 50 2 Theta ( ) Int en s ity (a.u .) Hydrodynamic diameter (nm) S c att erin g inte ns ity (a.u .) 1 10 100 1000 10000
A
B
V ol um e ad s orbed (c m 3/g) Relative pressure (P/P0) 0.0 0.2 0.4 0.6 0.8 1.0 0 200 400 600 800 -150 -100 -50 0 50 Zeta potential (mV)C
D
Int ens ity (a.u .)28 Figure 2. (1.5 fitting image)
2400 2200 2000 1800 1600 1400 Wavenumber (cm-1) A bs orbanc e /m g CO2 adsorption 1565 1560 1555 1550 1545 1540 Pure O2 Carbogen 0.002 O2 adsorption
Carbogen Pure CO2 Pure O2
Oxygen release Physisorbed CO2 Chemisorbed CO2 Physisorbed O2 Physisorbed O2 Pure CO2 Carbogen 0.0 0.2 0.4 0.6 0.8 1.0 1.2 1.4 1.6 1.8 21% 5% 1% 0.1% O x y ge n rel ea s ed (m g/m l) * *
A
B
C
0 0.015 0.03 0.045 0.06 0 1 2 3 4 A d s o rp ti o n c a p a c ity (B an d a area/m g ) * 0.3 1707 1680 148914331365 155329 Figure 3. (2-column fitting image)
0 20 40 0 20 40 0 20 40 60 0 20 40 60 0 25 50 75 100 0 20 40 60 80 100 120 0 20 40 60 80 100 120 γH 2 A X p o s it iv e c e lls (% ) *
DNA double strand break
C e lls fo rm ing m ic ro n u c lei (% ) * Mitotic death 14 24 72 Time of exposure (h) 14 24 72 14 24 72 Cel l nu m be r (%) Cel l nu m be r (%) HEK 293 U87-MG Sub-G1 G1 S G2/M Polyploidy Cel l V iab ili ty (% of c on tr ol ) A B C D Control Na-FAU Control Na-FAU 14h 24h 48h 72h 96h 14h 24h 48h 72h 96h γH 2 A X p o s it iv e c e lls (% ) C e lls fo rm ing m ic ro n u c lei (% ) Time of exposure (h) Time of exposure (h) HEK 293 U87-MG E Gd-FAU Hoechst γH2AX C o n tr o l Na -X Gd -X U87-MG HEK 293 Hoechst U87-MG HEK 293 C o n tr o l Na -X Gd -X Time of exposure (h) 14 24 72 * * 1 µg/ml 10 µg/ml 50 µg/ml 100 µg/ml Na-FAU Gd-FAU
30 Figure 4. (2-column fitting image)
Control 15 20 25 30 1 6 11 16 21 26 W ei gh t (g) Time (day) Na-FAU Gd-FAU 0 25 50 75 100 0 2 4 6 8 Diastol Systol Mean AP m m H g Time (min) Non-human primate 10
A
B
31 Figure 5. (2-column fitting image)
A B C 90 95 100 105 110 0 2 4 6 8 10 T 1 s ig n a l in te n s ity (% o f ba s el ine ) Time (min) * Tumor tissue Healthy tissue 0 20 40 60 [G d]bl oo d (m g/L ).10 -3 Time (min) 16 12 8 4 0 18 T2w T1w 20 0 Anatomical Before Gd-X injection (1) 2min after Gd-X injection (2) Tumor tissue Healthy tissue T1w
32 Figure 6. (2-column fitting image)
0 30 60 90 0 30 60 90 -10 -5 0 5 10 15 0 5 10 15 20 -10 0 10 20 Pa CO 2 (% o f b a s e lin e ) 100 60 120 140 * D E F Gd-FAU Control Gd-FAU Control A Anatomical CBV T2-w SatO2 Control Gd-FAU CO 2 Carbogen
Baseline 15 min ΔCBV Baseline 15 min ΔSatO2
20 -20 0 -20 0 20 Carbogen CO2 Time (min) Gd-FAU Control – CO2 Gd-FAU – CO2 CO2
Differences in BOLD signal (%)
ΔΔCBV ΔΔSatO2
B C
Differences between healthy and tumor tissue (%)
***
Differences between healthy and tumor tissue (%) 7.8 7.6 7.4 7.2 pH Time (min) * Control Gd-FAU Tumor tissue Healthy tissue 80 Control Gd-FAU
33 Figure 7. (1.5 column fitting image)
O2level T1-w MRI Blood Volume Physisorbed CO2 Chemisorbed CO2 Blood Flow Glioma Gd Na CO2 CO3 2-Nanosized zeolites i.v.
34
Figure Captions and Tables
Figure 1. Main physicochemical properties of zeolite nanocrystals. (A) XRD patterns (Inset:
TEM pictures). (B) Dynamic Light Scattering (DLS) curves. (C) Zeta potential curves. (D) Nitrogen adsorption/desorption isotherms (full symbols refer to adsorption, open symbols refer to desorption).
Figure 2. Nanosized zeolites are able to adsorb and release gases. (A) FTIR spectra of
physisorbed and chemisorbed CO2 under delivery of carbogen and pure CO2 and physisorbed
oxygen under delivery of carbogen and pure O2 on Na-FAU zeolites. (B) Adsorption capacity of
CO2 using carbogen or pure CO2 and O2 using carbogen or pure O2 (*p<0.05) Mean ± s.d.,
n=3/condition. (C) Quantification of oxygen released from zeolites in aqueous solution (phosphate buffered saline) (*p<0.05 vs 21%). Mean ± s.d., n=3/condition.
Figure 3. Zeolite nanocrystals display no sign of toxicity in vitro. (A) Astrocytes, neurons,
U87-MG, HEK 293 and bEnd.3 cells viability following a 48 h exposure to nanosized zeolites. Mean ± s.d., n=3/condition (*p<0.05 vs control; ANOVA and HSD Tuckey). (B) Cell cycle analysis by flow cytometry. Quantification of U87-MG and HEK 293 cells distribution in different phases of cell cycle after different times of exposure to 100 µg/ml of zeolites or water as a control. Mean ± s.d., n=3/time point. (C, D) Representative photographs of DNA double-strand breaks identified with γH2AX immunostaining (C) and micronuclei formation identified with Hoechst 33342 staining (D) on U87-MG and HEK 293 cells, 14 h after exposure to 100 µg/ml of zeolites. (E) Quantification after 14, 24 or 72 h exposure to 100 µg/ml of zeolites. Mean ± s.d., n=3/condition (*p<0.001; ANOVA and HSD Tuckey).
35
Figure 4. Evaluation of toxicity of nanosized zeolites in vivo. (A) Weight curves of mice
following intraperitoneal injections of Na-FAU and Gd-FAU zeolites or water as a control during 5 consecutive days (represented with arrows). Mean, 4 mice per group. (B) Arterial pressure (AP) of a marmoset after i.v. injection of nanosized Gd-FAU zeolite carrying CO2
(arrow indicates the time of injection). Representative example from 3 independent experiments.
Figure 5. Bio-distribution of nanosized zeolites in rats. (A) Quantification of gadolinium
content in the blood versus time after i.v. injection of Gd-FAU (300 µl, 1 wt%). Mean ± s.d., 4 independent experiments. (B) Representative T1-w images acquired before (1) or two min after (2) i.v. administration of Gd-FAU (300 µl, 1 wt%); T2w image (left) and a map of the
differences between the two T1w images (right). (C) Quantification of the normalized T1w signal intensity in the healthy and the tumor tissue. Baseline is the measurement of T1w signal carried out before injection and arrow refers to the time of injection. Mean ± s.d., 5 independent experiments. (*p<0.0001; two-way ANOVA). See also the video in Supplementary Information.
Figure 6. Nanosized zeolites carrying hyperoxic gases influence CBV and SatO2 in the
tumour. (A) Representative T2-w anatomic images, CBV and SatO2 maps obtained before and
15 min after i.v. injection of nanosized Gd-FAU zeolite (300 µl, 1 wt%) carrying CO2 or
carbogen and the corresponding differences between the two maps (ΔCBV and ΔSatO2,
respectively). Control consisted of injection of H2O saturated with CO2 or carbogen. (B) and (C)
Quantification of the differences of ΔCBV and ΔSatO2 (%) between the healthy and the tumor
tissue (ΔΔCBV and ΔΔSatO2, respectively). Mean ± s.d., n=5 for control group; n=8 for
Gd-FAU with CO2 group; n=5 for Gd-FAU with carbogen group (***p<0.001; ANOVA). (D)
Evolution of the arterial pressure of CO2 (PaCO2) expressed in percentage of baseline and (E)
36 CO2 orcontrol. Baseline refers to measurement of PaCO2 performed before injection and arrow
indicates the time of injection. Mean ± s.d., n=5 per group (*p<0.05; two-way ANOVA). (F) Differences in Blood Oxygen Level Dependent (BOLD) signal measured in the venous sinus of healthy Wistar rats before and 3 min after an i.v. injection of Gd-FAU (300 µl, 1 wt%) carrying CO2, or control or Gd-X without CO2 or breathing of 5% of CO2. Mean ± s.d., n=6 for Gd-FAU
– CO2 group; n=5 for Gd-FAU group; n=4 for control – CO2 group; n=3 for inhalation of 5%
CO2 group.
Figure 7. Nanosized zeolites are used as a specific hyperoxic gases carrier, in which they act
as a vasoactive agent to increase both the blood and the oxygen supply for reoxygenation of glioblastoma. Nanosized zeolites do not cross the intact blood brain barrier, resulting in an increase in cerebral blood volume/oxygenation specifically in the tumor as compared to the healthy brain. Moreover, Gd cations introduced in the zeolite nanoparticles enable the tracking of the particles into the tumor.
Table 1. Effects of Na-FAU zeolites on the marmoset.
Parameters to be
tested Reference range
Baseline Day (-7)
Injection Day (0)
One week after injection Day (+7) RBC (x106)/mm3 4.8-8.6 [47] 5.1 5.8 5 Hemoglobin (g %) 10.5-19.6 [47] 11.7 13.7 10.9 Hematocrit (%) 30-6 [47] 38.7 44.3 37.5 Platelets (x103/mm3) 490[47] 560 680 610 Monocytes (%) 0-1 [47] 1.7 0.4 1.2 Eosinophiles (%) 0-5 [47] 0.4 0.6 0.7
37
Basophiles (%) 0-4 [47] 0.5 1.2 1.7
Creatinine (mg/L) 0.4-11.1 [48] 8.3 5.5 5
Transaminase
38
Supplementary Data
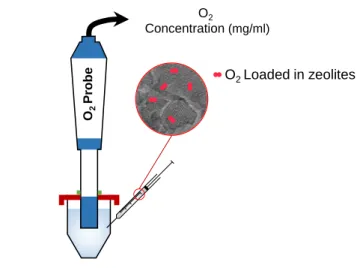
O2 Concentration (mg/ml) O2 Probe O2 Loaded in zeolites Buffer solution (pH 7.4 ; 37 C)Figure S1. Schematic representation of the experimental setup used for studying the release of oxygen from zeolites in aqueous and hypoxic conditions.
39 1 10 100 1000 Na-X in serum Na-X in H2O S c att e r i ng I nte ns i ty ( a. u) Diameter (nm) Hydrodynamic diameter (nm) S c att erin g inte ns ity (a.u .) 1 10 100 1000 A = Serum alone B = Serum + Na-FAU C = Saline (pH 6.8) alone D = Saline (pH 6.8) + Na-FAU. 1 day 9 days A B
Figure S2. Nanosized zeolites remain stable in serum and at low pH. (A) Dynamic Light
40 (B) The appearance of samples of Na-FAU zeolites in serum and saline with a pH of 6.8 over time. -150 -100 -50 0 50 Inte ns ity (a.u .) Zeta potential (mV) V ol um e ad s orbed (c m 3/g) Relative pressure (P/P0) Na-FAU Gd-FAU 0.0 0.2 0.4 0.6 0.8 1.0 0 200 400 600 800 20 nm 20 nm 10 20 30 40 50 2 Theta ( ) Na-FAU Gd-FAU Int en s ity (a.u .) Hydrodynamic diameter (nm) S c a tt e ri n g in te n s ity (a .u .) 1 10 100 1000 10000 Na-FAU Gd-FAU A C D B E Na-FAU Gd-FAU Na-FAU Gd-FAU
Figure S3. Comparative physicochemical properties of Na-FAU and Gd-FAU. (A) XRD
patterns. (B) Dynamic Light Scattering (DLS) curves. (C) TEM pictures. (D) Nitrogen adsorption/desorption isotherms (full symbols refer to adsorption, open symbols refer to desorption). (E) Zeta potential curves.
41
20s 80s Gd-X 180s 280s 380s 480s 580s
Figure S4. Gd-FAU zeolites reach the tumor. T1-w images of a rat brain acquired during an
intravenous injection of a Gd-FAU suspension. The injection started at 120 s. Map of the differences of signal between the first T1-w image and the following images. See also supplementary movie. 0 0.02 0.04 0.06 0.08 0.1 Physisorbed O2 Na-FAU Gd-FAU 0 1 2 3 4 5 Ads or ption c apac ity (Band ar ea/g ) Physisorbed CO2 Chemisorbed CO2 Na-FAU Gd-FAU
A
B
Figure S5. O2 and CO2 adsorption by Gd-FAU zeolites. (A) Physisorbed O2 (measured at -196
°C) and (B) physisorbed and chemisorbed CO2 (measured at 25 °C) on nanosized zeolites under delivery of pure CO2 and O2.
42
-30 -20 -10 0 10
Differences between healthy and tumor tissue (%) ΔΔCBV ΔΔSatO2 ΔCBV 20 -20 0 Anatomical T2-w ΔSatO2
A
B
Fig. S6. Effect of empty zeolites on CBV. (A) Representative T2-w anatomic image, CBV and
SatO2 maps of the differences of signal (ΔCBV and ΔSatO2, respectively) before and 15 min after i.v. injection of Gd-FAU (300 µl, 1 wt%). (B) Quantification of the differences of ΔCBV and ΔSatO2 (%) between the healthy and the tumour tissue (ΔΔCBV and ΔΔSatO2, respectively). Mean ± s.d. and dot-plot, n=4.
Table S1. Summary of the main characteristics of nanosized FAU-X. Chemical composition (wt%)
Size potentialZeta Si (wt%) Al (wt%) Na (wt%) Gd (wt%)
Na-FAU 18.10 14.59 13.41 0 10-30 nm -38mV
Gd-FAU 16.62 12.59 6.71 1.24 10-30 nm -37.7 mV
Table S2. BET specific surface area (SBET), micropore volume (Vmic) and total pore volume (Vtotal) of as prepared (Na-FAU) and gadolinium ion-exchanged (Gd-FAU) zeolite samples based on N2 adsorption measurements.
Samples SBET (m2.g-1) Vmic (cm3.g-1) Vtotal (cm3.g-1)
43
Na-FAU 777 0.29 1.26
Gd-FAU 738 0.27 1.25
Table S3. Assignment of FTIR bands: adsorption of O2, CO2, and carbogen by zeolite samples.
IR band Nature Species
1553 cm-1 Physisorbed O2 2346 cm-1 Physisorbed CO2 1707 cm-1 Chemisorbed Bridged bidentate carbonate
1680 cm-1 Bridged carbonate bidentate
1621 cm-1 Monodentate carbonate
1584 cm-1 Carbonate
1489 cm-1 Bidentate carbonate
1433 cm-1 Bidentate carbonate
1365 cm-1 Bridged carbonate bidentate