HAL Id: hal-03119683
https://hal.archives-ouvertes.fr/hal-03119683
Submitted on 25 Jan 2021
HAL is a multi-disciplinary open access
archive for the deposit and dissemination of
sci-entific research documents, whether they are
pub-lished or not. The documents may come from
teaching and research institutions in France or
abroad, or from public or private research centers.
L’archive ouverte pluridisciplinaire HAL, est
destinée au dépôt et à la diffusion de documents
scientifiques de niveau recherche, publiés ou non,
émanant des établissements d’enseignement et de
recherche français ou étrangers, des laboratoires
publics ou privés.
Variations of Cl, F, and S in Mount Etna’s plume, Italy,
between 1992 and 1995
Maddalena Pennisi, Marie-Françoise Le Cloarec
To cite this version:
Maddalena Pennisi, Marie-Françoise Le Cloarec. Variations of Cl, F, and S in Mount Etna’s plume,
Italy, between 1992 and 1995. Journal of Geophysical Research : Solid Earth, American Geophysical
Union, 1998, 103 (B3), pp.5061-5066. �10.1029/97JB03011�. �hal-03119683�
JOURNAL OF GEOPHYSICAL RESEARCH, VOL. 103, NO. B3, PAGES 5061-5066, MARCH 10, 1998
Variations of CI, F, and S in Mount Etna's plume, Italy,
between
1992 and 1995
Maddalena Pennisi
Istituto di Geocronologia e Geochimica Isotopica, Consiglio Nazionale delle Ricerche, Pisa, Italy
Marie-Fran9oise Le Cloarec
Centre des Faibles Radioactivit6s, Centre National de la Recherche Scientifique - Commissariat •t l'Energie Atomique
Gif sur Yvette, France
Abstract. This study investigates
data on the C1, F, and S concentrations
of plume-filter
samples
collected
between
1992 and 1995 from Mount Etna. The samples
were collected
during
eruptive
and noneruptive
activity and show fairly constant
C1/F ratios but wide variation in the C1/S ratios.
The determination
of the C1/F ratio (between
5 and 14) allows an estimate
of F degassing
to be
derived that ranges
from 10 to 30% of the initial F content
of the magma. The variation in the
C1/S ratio fits an empirical two-stage
degassing
model where gas with high C1/S ratio is
discharged
during quiescient
degassing
and gas with low C1/S ratios is discharged
during eruptive
degassing.
The typical permanent
degassing
occurs
from a depth at which chlorine
exsolution
exceeds
sulfur exsolution
(C1/S>
1). The opposite
of this behavior
is observed
during eruptive
periods
when significant
sulfur
degassing
occurs
because
magma
degasses
at near atmospheric
pressure
(C1/SN0.1).
The C1/S ratio in the plume, characterizing
the type of degassing,
has the
potential
to be a useful geochemical
tool for monitoring
the volcano.
1. Introduction
Mount Etna discharges a permanent volcanic plume consisting of hot magmatic gases which issues from four open conduits at the summit. SO2, HC1, and HF are described as the dominant sulfur and halogen species in the Mount Etna plume with much smaller amounts of particulate chlorides, fluorides, and sulfates [Faivre-Pierret et al., 1980; Andres et al., 1993], although thermodynamic calculations indicate that NaC1 and KC1 are the main halogen components [Le Guern, 1988]. Varekamp et al. [1986] reported an enrichment in A1 and Fe sulfates, which they explained as being due to the low C1/F ratio of the plume (5) controlling the vapor transport of A1 and
rare earth elements and possibly other elements (e.g., Si)
against Na, K, and metals (enriched in Cl-rich plumes). The discharge of heavy metals from the volcano to the atmosphere was estimated for the 1976 eruption [Buat-Menard and Arnold, 1978] and for the "quite activity" during July 1987 [Andres et al., 1993]. From the study of the 1983 eruption, potassium particulate content in the plume was suggested as helpful in characterizing the volcanic activity [Quisefit et al.,
1988]. An extensive series of data has been acquired for the
short-lived
aerosols
(21øpb,
21øBi,
21øpo)
of the 238U
family;
their activities in the plume during both eruptive and
noneruptive periods have been shown to be a tool for
characterizing the type of activity occurring at Mount Etna [Lambert et al., 1986; Le Cloarec et al., 1988].
Measurements of the C1/S ratio in gas discharges from other volcanoes show that generally the ratio decreases prior to
Copyright 1998 by the American Geophysical Union.
Paper number 97JB03011.
0148-0227/98/97JB-03011 $09.00
eruption [Stoiber and Rose, 1970; Menyailov, 1975] due to the outgassing of less degassed magma. A few measurements of the C1/S ratio in Mount Etna's plume during the eruptive activities have been reported [Buat-Menard and Arnold, 1978; Faivre-Pierret et al., 1980] and data on the C1/S ratio during quiescent activity were reported by Andres et al., [1993] and Francis et a/.[1995]. The aim of this paper is to investigate the C1/F and C1/S ratios with respect to the changing volcanic activity. The S (measured as SO2), C1, and F contents were investigated in the Bocca Nuova, Voragine, and Sud-Est plumes (Figure 1) during the 1991-1993 eruption, one of the most prolonged and volumetrically significant eruptions observed over the last 300 years at Mount Etna [Calvari et al., 1994], then during the posteruptive phase in 1993, a few months after the end of the eruption, during
quiescent degassing in 1994, and finally during Strombolian
activity in 1995.
2. Sampling and Analyses
The plumes of the summit craters were sampled as close as
possible to the rims. Wind conditions were taken into account
in order to avoid mixed plumes. In 1992 the degassing occurred from two cones located on the craters floor about 250 and 130 m from the rim at Voragine and Bocca Nuova,
respectively. Explosions often occurred with no visible
extrusion of lava. The Sud-Est plume, enriched in water vapor,
discharged quietly from two main vents located a few tens of
meters from the collection point. During 1993 and 1994 the same field conditions were observed with the exception that the intracrateric cone of Voragine was partly destroyed and
that only the northern vent was active at the Sud-Est crater.
5062 PENNISI AND LE CLOAREC' C1, F, AND S IN MOUNT ETNA'S PLUME BOCCA NUOVA ,-.NORD - EST / •,g9 .¾CRATER ! SUD- EST
•'"-(,CRAT
"3125ER
0 200 m I IFigure 1. Location map of the summit
area [after Murray et
al., 1981].
Lower SO2 fluxes
were measured
during 1993 (about 1500-
2000 t/d) than during
1994 (3000 t/d; T. Caltabiano,
personal
communication, 1994). During 1995, ash emissions and explosions were recorded in July and August at Bocca Nuovacrater (Coltelli M., personal
communication,
1995), before
plume sampling in September.The sampling device consists of two filter holders
connected
to a small pump
attached
to a 2 m long pole. Each
filter holder consists
of two Millipore cellulose
filters (in
series),
impregnated
following the techniques
described
by
Faivre-Pierret [1983]. During sampling, the filters are held farfrom the soil to minimize
soil contamination
or are kept off the
rim to avoid any contribution from the rim fumaroles. The flow
rate (calibrated at 2400 m)was 4 L/min. Saturation levels are
2, 1, and
9 mg on the filter for HCI, HF, and SO2,
respectively.
In the laboratory, both filters of each holder are washed and
then analyzed
for CI' by ion chromatography,
for F- by specific
electrode,
and for SO2 by colorimetry.
The analytical
error is
about 10%. On each
filter holder,
the trapping
efficiency
on
the first filter ranges
between
90 and 95%, as indicated
by the
C1,
F, and SO2 amounts
measured
on the second
filter (4% CI,
8% F, and 10% SO2). Particles can not be excluded on thefilters but are considered
negligible with respect
to gas
contribution [Faivre-Pierret et al., 1980; Andres et al.,1993]. 3. Results
Concentrations
of C1, F, and SO2
(expressed
as mg/m
3) are
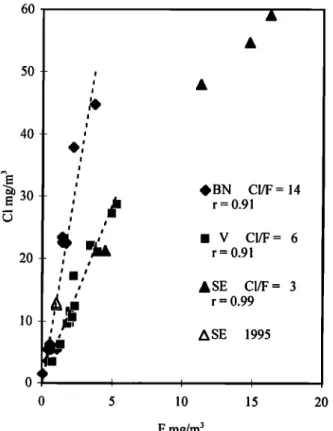
reported in Table 1. All analyzed plumes show a positive
correlation between C1 and F (Figure 2). The C1/F ratios (weight ratios) inferred fi'om the slope of the lines are 14, 6,
and 3 at Bocca Nuova (BN), Voragine (V), and Sud-Est (SE),
respectively, suggesting crater-specific C1/F ratios. While at BN the C1/F ratio is clearly higher than at V and SE, there are not enough measurements to ensure that the ratio at the SE crater is really different from that observed in the V plume.
The C1/F ratios range between 7.5 and 19.4 at Bocca Nuova (except for the ratio of 5.1 measured during 1994), between 3.6 and 12.7 at Sud-Est, and between 4.2 and 7.8 at Voragine. It is worth noting that during 1995 the C1 and F
data for the SE plume approach the line characterizing the BN
plume (Figure 2). Thus, although there are very few SE
Table 1. C1, F, and SO2 Contents in the Plume of Mount Etna During 1992, 1993, 1994, and 1995
Summit Craters Date CI F SO2
Bocca Nuova Jan. 16, 1992 0.15 n.d. 1.67
Voragine Jan. 16, 1992 0.88 n.d. 9.22
Bocca Nuova June 24, 1992 1.39 0.07 2.80
SudoEst June 24, 1992 6.51 n.d. 9.30
Bocca Nuova June 26, 1992 5.41 0.48 32.00 Bocca Nuova Oct. 25, 1992 6.14 0.60 67.00 Bocca Nuova Oct. 25, 1992 4.42 n.d. 49.00 Bocca Nuova Oct. 25, 1992 3.46 0.46 37.00
Bocca Nuova June 7, 1993 16.55 n.d. 16.40
Voragine June 7, 1993 28.73 5.27 14.40
Bocca Nuova June 8, 1993 22.57 1.43 14.40 Bocca Nuova June 9, 1993 23.38 1.40 18.10
Voragine June 9, 1993 21.95 3.55 20.50 Voragine June 9, 1993 27.27 4.91 18.93
Bocca Nuova June 10, 1993 9.16 n.d. 18.51 Bocca Nuova June 10, 1993 50.18 n.d. 30.41
Voragine June 10, 1993 15.55 n.d. 15.19
SudoEst June 10, 1993 48.00 11.27 23.14
Sud-Est June 10, 1993 54.68 14.73 27.58
Bocca Nuova June 11, 1993 44.73 3.68 9.96
Voragine June 11, 1993 22.09 3.41 6.66 Sud-Est June 11, 1993 59.05 16.23 n.d.
Bocca Nuova June 12, 1993 37.82 2.18 33.98
Voragine June 12, 1993 17.05 2.18 12.55
Bocca Nuova June 14, 1993 22.45 1.70 21.40
Voragine June 15, 1993 21.09 3.91 9.00
Bocca Nuova June 17, 1993 18.55 n.d. 30.44
Voragine June 17, 1993 11.55 2.00 n.d. Voragine June 17, 1993 11.73 n.d. 6.85
Bocca Nuova June 18, 1993 16.36 n.d. 7.96
Voragine June 18, 1994 6.24 1.33 25.63
Bocca Nuova June 20, 1994 5.40 1.06 14.33
Voragine June 20, 1994 17.20 2.22 48.10 Voragine June 21, 1994 9.75 1.97 12.54
Bocca Nuova June 22, 1994 4.51 n.d. 13.61 Bocca Nuova June 22, 1994 3.52 n.d. 10.59
Voragine June 22, 1994 3.37 0.77 7.42 Voragine June 22, 1994 9.58 1.78 9.08 Voragine June 23, 1994 10.60 2.15 24.83 Voragine June 23, 1994 12.37 2.34 15.39 Sud-Est June 23, 1994 21.25 4.48 29.78 Sud-Est June 23, 1994 n.d. 4.75 66.57
Bocca Nuova Sept. 15, 1995 5.36 0.46 21.10 Bocca Nuova Sept. 16, 1995 5.34 0.61 18.70 Sud-Est Sept. 16, 1995 12.52 1.05 32.20 Sud-Est Sept. 16, 1995 12.88 1.02 43.50
PENNISI AND LE CLOAREC: C1, F, AND S IN MOUNT ETNA'S PLUME 5063 60 50 40
•30
20 10 l l : •BN CI/F= 14 r- 0.91 ß V C1/F= 6 r=0.91I II
I
, , &SE CI/F= 3•j
, ASEr
- 0.99
1995 0 5 10 15 20F mg/m
3
Figure 2. Variations in time of CI and F contents in the plumes of the summit craters.
(Bocca Nuova). Changes in the CI/S ratio occurred from one year of sampling to another. Typically, the CI/S ratio was about 0.3 during the 1992 eruption and increased to about 3-4 during 1993 by the end of the eruption. Intermediate values of 0.9 and 0.6 are recorded during 1994 and 1995, respectively. As a first approximation, low CI/S ratios (0.2-0.6) seem consistent with eruptive or strombolian degassing, while higher CI/S ratios characterize the plume during quiescient activity.
4. Discussion
4.1. Chlorine and Fluorine Degassing at Mount Etna The CI/F ratios measured at Mount Etna plume during 1992-1995 display a small range of variation, less than one order of magnitude. At present, we have no explanation for the different C1/F ratios measured for each crater. In particular, they can not be explained by selective contributions from a crust formed on the magma column during low activity [Le Guern, 1988], as shown by the fairly constant CI/F ratios at BN during both eruptive and noneruptive periods. The positive correlation between C1 and F observed at BN and V suggests that the magma is the unique source for both elements. This observation might also suggest that the exsolution of these
halogens is governed by the same physical conditions, such
as temperature and/or pressure for example.
From the analyses of melt inclusions in olivine
phenocrysts the C1/F ratio in Mount Etna primitive basalts is
about 3.6 [Metrich et al., !993]. Based on this value and
noting that the plume C1/F ratio is between 5 and 14, the
samples, the large variability of their 1995 C1/F ratios when
compared
to their 1993 and 1994 CI/F ratios is probably
controlled by activity rather than by input from the crater rimfumaroles.
It was suggested
previously that low temperature
fumaroles can increase the C1 content thereby leading to high C1/F ratios [Faivre-Pierret et al., 1980; Miller et al., 1990]. This could explain the daily variation at the CI/F ratio that was sometimes recorded; the aquisition of a consistent set of data could help in detecting unreliable samples. Moreover, it seems from the F/S and CI/S ratios in 1995 that the significant variability is mainly due to F depletion than to C1 increase. According to the above considerations we suggest that the available data on the CI/F ratio are not sufficient to allow any detection of new magma entering the shallow system [Miller et al., 1990]. We suggest instead that the C1/F ratios between 5 (V+SE) and 14 (BN) should be considered as characteristic features of the volcano for further applications. The ratios measured in the period 1992-1995 are in agreement with previous analyses of C1/F = 9 for gas samples collected at the hornitos of the 1983 eruption [Le Guern, 1988], and with 4 < C1/F < 9 in the summit plume during 1978, 1981, and 1987 activities [Faivre-Pierret et al., 1980; Varekamp et al., 1986; Andres et al., 1993]. More generally, it appears that CI/Fratios between 4 and 13 are fairly typical for high-temperature volcanic gases [Symond et al., 1994].
The C1/S ratio in the separated plumes of the summit craters indicates that the plumes of Bocca Nuova and Voragine, and probably that of Sud-Est are characterized by similar C1/S signatures during a given period of activity (Figure 3).
Significant differences are shown on the CI/S ratio of the
plume, which varied by a factor 50 over the period of investigation, for the three craters or even for a single crater
80 70- 60- 50- 20- 10- 0 ß
/ ß
/ / / / / Deep degassing: 50% C1, 30% S P > 100 MPa C1/S = 2.5ß
/
Shallow
10% C1, 90% Sdegassing:
% •ß• ß
P<20MPa
ß •
ß
ß C1/S
= 0.1
0 10 20 30 40 50S mg/m
3
Figure 3. Comparison of the CI and S data measured in the
summit craters plumes with the hypothetical composition of the fluid phase at P > 100 MPa, and at P < 20 MPa following a model based on the whole rock and fluid inclusions [Metrich
and Clocchiatti, 1989]. Open circle, 1992; solid circle, 1993; square, 1994; solid triangle, 1995.
5064 PENNISI AND LE CLOAREC: C1, F, AND S IN MOUNT ETNA'S PLUME
partition coefficient of C1 into the gas phase (partition
coefficient
= Clgas/Clmagma)
should
be about
1.4 to 3.9 times
that of F. Given that in present-day hawaiitic lavas from Mount Etna the degassing of C1 has been quantified as around 40-50% [Metrich and Clocchiatti, 1989], we estimate that
between 10 and 30% of the initial magmatic
F is degassed.
This new result supports
the general
idea of a poor degassing
off from
magmas
but is not in agreement
with the negligible
degassing of F compared to that of C1 reported for Mount Etna[Metrich, 1990]. We believe that Metrich's data are not sufficient to investigate F behavior because of the small
number off analyses (6) when compared to the number of C1
measurements (26).
It should also be recognized that the effect of melt and fluid
composition, pressure, and temperature on C1 and F solubility in melts are still not well characterized for the range of magma
compositions encountered in nature [Carrol and Webster, 1994, and references therein]. Empirical studies show that
volcanoes
degass
different
amounts
of C1 and F, each
according
to the physical and chemical characteristics of the degassingmagma. For instance, based on the strong correlation between
C1 and other nonvolatile elements, the degassing of C1 from
basalts from Iceland is considered to be less than 10%
[Sigvaldason and Oskarsson, 1976]. Another example is drawn from the study of glass inclusions and quenched glass in products from the various stages of eruption [Thordarson
and Self, 1996]. This work shows that 66% of total C1 and in 37% of total F degassed from the Roza member of the Columbia River Basalt Group.
Considering both the richness of Etnean tholeiites in
chlorine (compared to Mid Atlantic Ridge basalts [Metrich, 1990]) and the huge degassing activity of the volcano, the quantification of the C1 (about 50%) and F (15-30%) degassing suggests Mount Etna's plume is a significant natural source of halogen to the atmosphere.
4.2. Chlorine and Sulfur Degassing at Mount Etna
The C1/S variation at Mount Etna over the period 1992-
1995 may be explained as follows. During 1992 the volcanicplume
was sustained
by full or "deep"
degassing
of convecting
and erupting
magma.
This eruption
was the largest
at Mount
Etna over the past three centuries
[Calvari et al., 1994] and
was associated
with a huge
release
of SO2
[Bruno
et al., 1994].
This left a residual
degassed
magma
(for sulfur
at least) with a
high C1/S ratio in the conduit system which then sustained avariable
Cl-rich plume during the June 1993 posteruptive
phase.
As new magma
entered
the system,
as also indicated
by
a SO2 flux increase
(T. Caltabiano,
personal
communication,
1993), "steady"
gas release
was restored
giving average
CI/S
ratio of 0.9-0.6 in 1994-1995. This model follows the
"classical"
interpretation
[e.g. Stoiber
and Rose, 1970], where
the C1/S ratio increases
with the degree
of degassing
of the
magma because the solubility of CI in the magma exceeds thatof S. According
to this model the C1/S variation is mainly
determined
by the evolution of sulfur degassing.
As a
consequence,
changing
activity from the degassing
of erupting
magma to the degassing of S-exhausted magma should accountfor a huge variation in the SO2 flux but produces
a fairly
constant HC1 flux (during both the eruptive and the residual-magma degassing).
However, data for the HC1 flux calculated from the C1/S
ratios in the plume and SO2 fluxes during the same
period
[Pennisi et al., 1997] are not consistent with the model
considered
above.
During the eruptive
period
(1992) a 10,000
t/d flux was measured
for SO2,
with the corresponding
HCI flux
estimated
at 1000 t/d. During the posteruptive
period, in June
1993,
the SO2
flux was 1500-2000
t/d, while HC1 flux ranged
from
3000 to 4000 t/d. High HC1 fluxes (3800 t/d) are also
estimated
for low SO2 fluxes
(1120 t/d) and high C1/S ratios
(3.4, measured
at BN) during a "quiet activity" in July 1987
[Andres et al., 1993]. The threefold to fourfold increase in the
HC1 flux from eruptive to quiescent
degassing
is consistent
with an increase
in the CI exolution
from the magma
rather
than
the simple evolution of sulfur degassing
from one stage of
activity to the other. Although a simple increase in the volume of degassed magma could account for the increased C1 flux, thisseems
unlikely because
the higher C1 fluxes
occured
during
post-eruptive activity.
4.3. Two-Stage Degassing Model
We attempt
to explain these results using a two-stage
degassing
model
deduced
from mineralogy
and from
the S and
C1 content in melt inclusions and in the whole rock of the
1763, 1865, and 1929 eruptions
of Mount Etna [Metrich and
Clocchiatti, 1989]. At the basalt-hawaiite transition(crystallization
of olivine
Fo74,
salite,
and
plagioclase)
about
50% of chlorine and 30% of sulfur are extracted from the
system. This degassing occurs at pressures greater than 100
MPa and is consistent
with the permanent
outgassing
present
at Mount Etna. At this pressure,
no evidence
exists
of gas
saturation [Clocchiatti et al., 1992; Metrich and Clocchiatti,1996]. In order to explain the low S content of the whole rock
(about
100 ppm),
these
authors
suggested
a second
degassing
stage,
which occurs
during eruptions
(or at least during a
degassing close to the surface at P < 20 MPa) and accounts forthe degassing
of 90% of S. The release
of CI during this phase
is limited. Although there is no clear evidence
yet for the
pressure dependence of HCI solubility in basalts, this empirical observation is consistent with experimental studieson felsic magmas
showing a decrease
of C1 solubility in the
melt with increasing pressure [Kilinc and Burnham, 1972; Anderson, 1974; Shinohara et al., 1989]. In order to calculatethe CI/S ratio in the fluid phase
that is issued
during the two
main observed degassing stages, we will assume in thefollowing
discussion
an initial content
of 1560 ppm of S and
2300 ppm of C1, as measured in melt inclusions of the 1991-
1993 eruption [Armienti et al., 1994]. These concentrations
fall in the ranges 1500-2400 and 1600-2400 ppm generally
observed
in olivine inclusions
for S and Cl, respectively
[Metrich
and Clocchiatti,
1989]. During the "first degassing
stage"
the degassing
of 50% Cl and 30% S from
a deep
magma
yields a fluid characterized by a CI/S ratio equal to 2.5 and adepleted
magma
containing
about l100 ppm S and 1150 ppm
Cl. During the second degassing stage the degassing of 90% S and 10% C1 will produce a fluid phase with C1/S = 0.1. Thetwo CI/S ratios of 2.5 and 0.1 are considered the current limits
of the CI/S ratio in the magma
degassing
at Mount Etna.
Figure
3 shows the comparison between the rock-degassing model and the data measured in the plume: the C1/S ratios in the plume fall inside the range assigned by the rock model to the gas; all samples from the 1992 eruption approach the"shallow degassing
line", while the 1993 samples
fit quite
well with the "permanent degassing line". Intermediate behavior is shown for the 1994 and the 1995 samples.PENNISI AND LE CLOAREC: C1, F, AND S IN MOUNT ETNA'S PLUME 5065
In the light of the two-stage degassing model some
revision of previous plume studies [Faivre-Pierret et al.,
1980] is suggested. The CI/S ratio of about 0.3 measured in
June 1978 belongs to a period of almost continous eruptive activity, which occurred from April to June, and in August and
November [Tanguy and Kieffer, 1993]. This result is i n agreement with our data on the eruptive plume, but it is interpreted by Faivre-Pierret et al. [1980] as indicative of
"deep degassing" on the basis of the theoretical laws of gas
solubilities and on empirical observations of the C1/S ratio in
volcanic gases [Menyailov, 1975]. In the light of our study the
characterization of the degassing as "deep" or "shallow"
inferred by the CI/S ratio has been reversed: the "deep" degassing yields an enrichment in chlorine with respect to
sulfur. The "shallow degassing" during eruptions occurs close to atmospheric pressure and yields an enrichment in sulfur with respect to chlorine.
Strombolian activity which began in July 1995. This conclusion is in contrast with other studies suggesting that
gas-chemistry changes may not precede ascending magma
[Gerlach, 1986].
The 1994 data show that uprising magma might be
detected by changes in the CI/S ratio but still might not preced an eruption. This process has already been recognized at Mount Etna [Lambert et al., 1986] and can account for the
observed decreases in the CI/S ratio during quiescent periods not followed by an eruption. It is still unknown how common this feature is and for this reason the monitoring of the feeding
system during noneruptive periods is suggested as the main
focus for forthcoming studies of the plume of Mount Etna.
Acknowledgments. This work was supported by the programm "CEE Environment". We thank N. Metrich, B. Symonds, J.C. Varekamp and two anonymous reviewers for their help in improving the manuscript. Contribution CFR 1977.
5. Conclusion
The C1, F, and S contents measured in the plume of Mount
Etna during eruptive and noneruptive activities show that the F degassing at Mount Etna ranges from 10 to 30% of the
initial F content in the magma• The CI/S ratios measured
during eruptive activity (average CI/S = 0.3) differ strongly from the CI/S ratios measured one month after the end of the eruption (average CI/S = 4). The variations of the CI/S ratio observed in the plume correlate significantly with an empirical degassing model derived from the study of the melt inclusions
and of the rocks of Mount Etna. Following this model, the
plume chemistry, characterized by the C1/S ratio, can help in distinguishing "deep degassing" (P > 100 MPa) from shallow degassing (P = 0.1 MPa). An anomalously shallow asthenosphere is considered responsible for the 20-30 km deep subcrustal reservoir at Mount Etna [Tanguy et al., 1997]. Convective movements within this mantle lens lead to continuous degassing, even without migration of magma [D'Alessandro et al., 1997]. According to Badalamenti et al. [1994], changes in magma pressure within the deep reservoir
can be detected by variable CO2 flux in the peripheral areas of
the volcano. We suggest that both deep and shallow
degassing can be detected by the plume chemistry. The C1/Sratio is close to 3 when a nonequilibrium rise of bubbles from
the deep reservoir dominates over the degassing of the strongly degasseal liquid, filling (with low convective movements) the upper level of the volcano. Drop in pressure
caused both by magma pressure and tectonic movements
triggers vesiculation and drives the deep-degassed magma
toward shallow level. At this stage, the CI/S ratio rises to 0.2
in the plume, leading to a shallow degassing signature
dominating over the deep one. The 1991-1993 eruption of
Mount Etna provided an important opportunity to test the model, as the plume signature changed in relation with injection of new magma in 1992 and its termination in June 1993. During the following noneruptive period a decrease of the C1/S ratio was recorded from CI/S = 0.9 in June 1994 to C1/S = 0.6 in September 1995. Data obtained by Fourier
transform infrared spectroscopy during September 1994
[Francis et al., 1995] report C1/S ratios ranging between 0.6
and 0.7; these data confirm our June 1994 results and concur
in supporting the C1/S ratio as an indicator for the gentle recharging of the system that occurs from June 1994 until the
References
Anderson, A.T., Chlorine, sulphur and water in magmas and oceans,
Geol. Soc. Am. Bull., 85, 1485-1492, 1974.
Andres, R.J., P.R. Kyle, and R.L. Chuan, Sulfur dioxide, particle and elemental emissions from Mount Etna, Italy during July 1987, Geol.
Run&., 82, 687-695, 1993.
Armienti, P., R. Clocchiatti, M. D'Orazio, F. Innocenti, R. Petrini, M.
Pompilio, S. Tonarini, and L. Villari, The long-standing 1991-1993 Mount Etna eruption: Petrography and geochemistry of lavas, Acta
Vulcanol., 4, 15-28, 1994.
Badalamenti, B., G. Capasso, M.L. Carapezza, W. D'Alessandro, F. Di Gangi, I.S. Diliberto, S. Giammanco, S. Gurrieri, F. Parello, and M. Valenza, Soil gases investigations during the 1991-1993 eruption, Acta
Vulcanol., 4, 134-141, 1994.
Bruno, N., T. Caltabiano, M.F. Grasso, M. Porto, and R. Romano, SO2 flux from Mt. Etna volcano during the 1991-1993 eruption: Correlation
and considerations, Acta Vulcanol., 4, 143-147, 1994.
Buat-Menard, P., and M. Arnold, The heavy metal chemistry of atmospheric particulate matter emitted by Mount Etna volcano, Geophys. Res. Lett., 5, 245-248, 1978.
Calvari, S., M. Coltelli, M. Pompilio, and V. Scribano, 1991-1993 Mount Etna eruption: Chronology and lava flow field evolution, Acta
Vulcanol., 4, 1-14, 1994.
Carroll, M.R., and J.D., Webster, Solubilities of sulfur, noble gases, nitrogen, chlorine and fluorine in magmas, in Volatiles in Magmas, Rev. Mineral., vol.30, edited by M. R. Carroll and J. R. Holloway, pp. 231-280, Mineral. Soc. of Am., Washington, D.C.,1994.
Clocchiatti, R., J. Weiz, M. Moshab, and J.C. Tanguy, Coexistence de "verres" alcalins et tho16Ytiques satur6s en CO2 dans les olivines des hyaloclastites d'Aci Castello (Etna, Sicile, Italie): Arguments en faveur d'un manteau anormal et d'un r6servoir profond, Acta
Vulcanol., 2, 161-173, 1992.
D'Alessandro, W., S. Giammanco, F. Parello, and M. Valenza, CO2
output
and
•'•C (CO2)
from
Mount
Etna
as indicators
of degassing
of
shallow asthenosphere, Bull. Vulcanol., 58, 455-458, 1997.
Faivre-Pierret, R., SO2, HCI, and HF detection and dosing in the volcanic gas phase, in Forecasting volcanic events, edited by H. Tazieff and J.C. Sabroux, pp. 399-408, Elsevier, New York, 1983.
Faivre-Pierret, R., D. Martin, and J.C. Sabroux, Contribution des sondes
a6rologiques motoris6es /t l'6tude de la physico-chimie des panaches volcaniques, Bull. Volcanol., 43-3, 473-485, 1980.
Francis, P., A. Maciejewski, C. Oppenheimer, C. Chaffin, and T. Caltabiano, SO2:HCI ratios in the plumes from Mt. Etna and Vulcano determined by Fourier transform spectroscopy, Geophys. Res. Lett.,
22, 1717-1720, 1995.
Gefiach, T.M., Exsolution of H20, CO2, and S during eruptive episodes at Kilauea volcano, Hawaii, J. Geophys. Res., 91, 12177-12185, 1986. Kilinc, I.A., and C.W. Burnham, Partitioning of chloride between a silicate melt and coexisting aqueous phase from 2 to 8 kbar, Econ.
Geol., 67, 231-235, 1972.
Lambert, G., M.F. Le Cloarec, B. Ardouin, and J.C. Le Roulley, Volcanic emission of radionuclides and magma dynamics, Earth
5066 PENNISI AND LE CLOAREC: C1, F, AND S IN MOUNT ETNA'S PLUME
Le Cloarec, M.F., and M. Pennisi, Degassing processes at Mount Etna during the period 1983-1994: Radionuclides constraints, paper
presented at IAVCEI General Assembly, Int. Assoc. of Volcanol. and
Chem. of the Earth's Inter., Puerto Vallarta, Mexico, Jan. 19-24,
1997.
Le Cloarec, M.F., M. Pennisi, B. Ardouin, J.C. Le Roulley, and G. Lambert, Relationship between gases and volcanic activity of Mount Etna in 1986, J. Geophys. Res., 93, 4477-4484, 1988.
Le Guern, F., Ecoulement gazeux r6actifs /t hautes temp6ratures, mesures et mod61isation, th•se de Doctorat d'Etat, 314 pp., Univ. Paris
VII, 1988.
Menyailov, I.A., Prediction of eruptions using changes in composition of volcanic gases, Bull. Volcanol., 39, 112-125, 1975.
Metrich, N., Chlorine and fluorine in tholeiitic and alkaline lavas of Etna
(Sicily), J. Volcanol. Geotherm. Res., 40, 133-148, 1990.
Metrich, N., and R. Clocchiatti, Melt inclusion investigation of the
volatile behaviour in historic alkali basaltic magmas of Etna, Bull.
Volcanol., 51, 185-198, 1989.
Metrich, N., and R. Clocchiatti, Sulfur abundance and its speciation in
oxidized alkaline melts, Geochim. Cosmochim. Acta, 60, 4151-4160,
1996.
Metrich, N., R. Clocchiatti, M. Mosbah, and M. Chaussidon, The 1989- 1990 activity of Etna: Magma mingling and ascent of H20-CI-S-rich
basaltic magma: Evidence for melt inclusions, d. Volcanol. Geotherm.
Res., 59, 131-144, 1993.
Miller, T.L., W.H. Zoller, B.M. Crowe, and D.L. 'Finnegan, Variations in
trace metal and halogen ratios in magmatic gases through an eruptive
cycle of the Pu'u O'o Vent, Kilauea, Hawaii: July-August 1985, J. Geophys. Res., 95, 12607-12615, 1990.
Murray J.B., C.R.J. Kilburn, T.J. Sanderson, S. Benazon, C. Crooks, and
A. Pullen, Sommit/t dell'Etna, Ordnance Survey, Southampton, England, 1981.
Pennisi M., T. Caltabiano, and M.F. Le Cloarec, Chlorine, fluorine and sulfur emissions from Mt. Etna volcano (Italy), paper presented at
IAVCEI General Assembly, Int. Assoc. of Volcanol. and Chem. of the
Earth's Inter., Puerto Vallarta, Mexico, Jan. 19-24, !997.
Phelan, J., D.L. Finnegan, D.S. Ballantine, and W.H. Zoller, Airborne aerosol measurement in the quiescient plume of Mount St. Helens:
September, 1980, Geophys. Res. Lett., 9, 1093-1096, 1982.
Quisefit, J.P., G. Bergametti, D. Tedesco, J. Pinart, and J.L. Colin, Origin of particulate potassium in Mt. Etna emission before and during the 1983 eruption, d. Volcanol. Geotherm. Res., 3.5, 111-119, 1988. Shinohara, H., J. Toshimichi, and S. Matsuo, Partition of chlorine
compounds between silicate melt and hydrothermal solutions, I,
Partition of NaC1-KCI, Geochim. Cosmochim. Acta, .53, 2617-2630,
1989.
Sigvaldason, G., and N. Oskarsson, Chlorine in basalts from Iceland,
Geochim. Cosmochim. Acta, 40, 777-789, 1976.
Stoiber, R.E., and W.I. Rose Jr, The geochemistry of Central American
volcanic gas condensates, Geol. Soc. Am. Bull., 81, 2891- 2911, 1970. Symond, R.B., W.I. Rose, G.J.S. Bluth, and T.M. Gerlach, Volcanic-gas
studies: Methods, result, and applications, in Volat#es in Magmas, Rev.
Mineral., vol. 30, edited by M.R. Carroll and J.R. Holloway, pp. 1-66, Mineral. Soc. of Am., Washington, D.C., 1994.
Tanguy, J.C., and G. Kieffer, Les 6ruptions de l'Etna et leur
m6canismes, Mem. Soc. Geol. Fr., 163, 239-252, 1993.
Tanguy, J.C., M. Condomines, and G. Kieffer, Evolution of the Mount Etna magma: Constraints on the present feeding system and eruptive
mechanism, J. Volcanol. Geotherm. Res., 7.5, 221-250, 1997.
Thordarson, T., and S. Self, Sulfur, chlorine and fluorine degassing and atmospheric loading by the Roza eruption, Columbia River Basalt Group, Washington, USA, d. Volcanol. Geotherm. Res., 74, 49-73, 1996.
Varekamp, J.C., E. Thomas, M. Germani, and P. Busek, Particle geochemistry of volcanic plumes of Etna and Mount St. Helens, J. Geophys. Res., 91, 12333-12248, 1986.
M.F. Le Cloarec, Centre des Faibles Radioactivit6s, CNRS/CEA,
Avenue de la Terrasse, 91198 Gif sur Yvette Cedex, France. (e-mail:
Marie-Franco is e. Le-Clo arec•c ft. cnrs. gi f. fr)
M. Pennisi, Istituto di Geocronologia e Geochimica Isotopica, CNR, via Cardinale Maffi 36, 56127 Pisa, Italy. (e-mail: iggi•iggi.pi.cnr. it)