HAL Id: hal-01755575
https://hal.archives-ouvertes.fr/hal-01755575
Submitted on 8 Jan 2019
HAL is a multi-disciplinary open access
archive for the deposit and dissemination of
sci-entific research documents, whether they are
pub-lished or not. The documents may come from
teaching and research institutions in France or
abroad, or from public or private research centers.
L’archive ouverte pluridisciplinaire HAL, est
destinée au dépôt et à la diffusion de documents
scientifiques de niveau recherche, publiés ou non,
émanant des établissements d’enseignement et de
recherche français ou étrangers, des laboratoires
publics ou privés.
Clinical and biological characteristics of the French
COBRA cohort of adult subjects with asthma
Marina Pretolani, David Soussan, Isabelle Poirier, Gabriel Thabut, Michel
Aubier
To cite this version:
Marina Pretolani, David Soussan, Isabelle Poirier, Gabriel Thabut, Michel Aubier. Clinical and
biological characteristics of the French COBRA cohort of adult subjects with asthma. European
Respiratory Journal, European Respiratory Society, 2017, 50 (2), �10.1183/13993003.00019-2017�.
�hal-01755575�
Clinical and biological characteristics of
the French COBRA cohort of adult
subjects with asthma
Marina Pretolani
1,2,3,7, David Soussan
1,2,3,7, Isabelle Poirier
1,2,3,
Gabriel Thabut
1,2,3,4,5and Michel Aubier
1,2,3,4, on behalf of the COBRA
Study Group
61Inserm UMR1152, Physiopathology and Epidemiology of Respiratory Diseases, Paris, France. 2Paris Diderot University, Faculty of Medicine, Paris, France.3Laboratory of Excellence, INFLAMEX, Université
Sorbonne Paris Cité and DHU FIRE, Paris, France. 4Pneumology A and B Departments, Bichat-Claude
Bernard University Hospital, Paris, France.5Assistance Publique des Hôpitaux de Paris, Paris, France.6A full
list of the French COBRA Study Group can be found in the Acknowledgements section. 7M. Pretolani and
D. Soussan contributed equally to this study.
Correspondence: Michel Aubier, Inserm UMR1152, Paris Diderot University, Faculty of Medicine, Bichat campus, 16, rue Henri Huchard, 75018 Paris, France. E-mail: michel.aubier@inserm.fr
ABSTRACT The COhort of BRonchial obstruction and Asthma (COBRA) is a longitudinal cohort that involves 12 French academic institutions.DNA, serum samples and clinicaldata are collected at entry and every 6 months thereafter.
Of 1080 patients with asthma recruited between 2007 and 2015,401 had mild/moderate and 613 had severe asthma.In cross-sectional analyses,compared with patients with milder disease,patients with severe asthma had more symptoms, exacerbations,hospitalisations and visits to the emergency department during the preceding 12 months, higher numbers of blood eosinophils, and more comorbidities. More than 60% of patients with severe asthma were therapy-uncontrolled at entry,and 152 of them were being treated with omalizumab.In addition, patients with asthma who had the highest eosinophilia levels (>300/ mm3) had shorter asthma duration, lower lung function, and higher rates of severe exacerbations and unacceptable asthma control than patients with lower eosinophil counts.
Longitudinal analyses performed in 427 patients with asthma with at least three differential blood cell counts demonstrated that both eosinophil numbers and eosinophil increase over time were associated with the number of exacerbations occurring until the next visit and with Juniper score.
Studies with the COBRA cohort will help to improve knowledge concerning the risk and biological factors associated with asthma severity and to better understand their influence on the disease trajectory.
Introduction
Asthma is a global health problem affecting more than 300 million people of all ages and ethnic origins around the world [1]. Although most patients are usually highly responsive to inhaled corticosteroids (ICS), associated with short- or long-acting β2 agonists (SABA and LABA, respectively),some patients experience severe and persistent asthma,and they respond sub-optimally to high doses of ICS or even oral corticosteroids (OCS). Recent reports estimated that 5–10% of patients with severe asthma fall into a category of relative steroid insensitivity [2, 3]. These patients develop recurrent symptoms and exacerbations and/or persistentairflow obstruction, and they incur significant morbidity, disability and decrement in quality of life.
During the past decade,severe asthma hasbeen identified as a heterogeneousdisease,manifesting as severaldistinct clinical phenotypes that develop through a variety of mechanisms [4,5]. In particular, the presence or absence of increased numbers of eosinophils defines a pathophysiologically and clinically distinct subset of the disease [6]. This phenotypic characterisation has become clinically valuable for developing add-on treatments for patients with severe asthma who are atopic and hypereosinophilic, including development of monoclonal antibodies directed against immunoglobulin E (IgE) (e.g. omalizumab) [7] or the eosinophilic cytokine, interleukin (IL)-5 (e.g. mepolizumab and reslizumab) [8– 10]. To date, firm clinical and biological criteria that will enable clinicians to allocate individual patients to specific phenotypic groups remain,to a large extent,to be established.
Studies with cohorts are a prerequisite for characterising novel asthma phenotypes and for developing more personalised treatment [11]. Some European and US cohorts have already provided insights into novel asthma phenotypes,and have improved our understanding of the underlying pathological processes [12–16]. However, most studies conducted with these cohorts were cross-sectional or, when longitudinal, they included low numbers of patients in the cohort or limited numbers of examinations during follow-up [13–15].
In the present report, we describe a novellongitudinal multicentre French cohort of patients with asthma, named the COhort of BRonchial obstruction and Asthma (COBRA). This cohort, which involves 12 academic centres in France, started in 2007, is still ongoing and has already enrolled more than 1000 patients,among which approximately 60% have severe asthma.
The current priorities of studies with the COBRA cohort include cross-sectionalcharacterisation of the physiopathological,biological and genetic factors related to asthma,particularly to the severe forms of the disease,as well as their stability over time in longitudinal studies.In this first report, we describe in detail the characteristics of the COBRA cohort. In this study, we investigated variations over time in peripheral blood eosinophils in relation to exacerbations and to hallmarks of asthma control.
These approaches willcontribute to the identification of relevant outcomes, biomarkers,and personaland environmental factors that modulate the natural history of severe asthma,thereby providing a mechanistic basis for developing more targeted therapies.
Methods
Patient inclusion and demographic and clinical assessment
This cohort was approved by the CPP Ile-de-France I ethics committee (number 09-11962) and all subjects gave their written informed consent before being enrolled. Patients are managed according to the best standard care of the tertiary hospital outpatient clinics in each centre participating in the study.
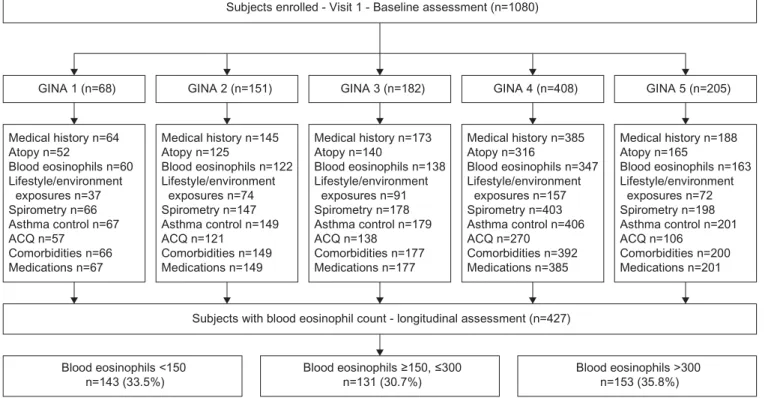
Between January 2007 and December 2015, 1080 adult patients with asthma, aged between 18 and 85 years, were included. During the first visit, demographic data, personal and family history, age at asthma onset, atopic manifestations, indoor and outdoor allergen exposure, smoking history, allergic and nonallergic co-morbidities, cutaneous hypersensitivity reactions to 11 common allergens, hospitalisations for asthma and admissions to the intensive care unit (ICU), elements from the clinical examination, and details of treatments were recorded in a validated standardised folder (study flow chart is shown in figure 1). In addition, all patients underwent assessmentof flow volume, and forced expiratory volume in 1 s (FEV1) and forced vital capacity (FVC) were monitored before and after the inhalation of 400 µg of salbutamol. Patients were asked to withhold the use of SABA and LABA for 6–12 h before the measurements.
Based on the Global Initiative for Asthma (GINA) guidelines [17], these 1080 subjects were distributed into five groups (steps 1 to 5) (table 1 and tables S1 to S3). This classification was established by considering the frequency and intensity of daytime and night-time asthma symptoms; the need, dose and type of treatment, including add-on therapies; the use of rescue medication; and the respiratory function.
Specifically,severe asthma was defined according to inadequate symptom control and/or two or more exacerbations (defined as a worsening of asthma symptoms requiring treatment with systemic corticosteroids in the 12 months preceding study inclusion), despite use of at least 1000 μg of fluticasone equivalents,combined with LABA. In these patients with severe asthma,the number of hospitalisations for asthma during their lifetime and during the past year, of emergency department visits in the past year,of ICU admissions, and of exacerbations requiring OCS bursts were also monitored. Asthma control was established using the Asthma Control Questionnaire (ACQ), which contains five activity questions and defines scores ⩽0.5 as optimal asthma control, >0.5–1.5 as suboptimal asthma control and >1.5 as unacceptable asthma control [18].
Any change in treatment, including SABA and LABA, inhaled and/or oral ICS and OCS dose and other controller medication, such as antihistamine, nasal corticosteroids, leukotriene modifiers, theophylline, anticholinergics and omalizumab,at the end of the inclusion visit was noted.
Data were entered into a central database that was elaborated and managed by LaSer Analytica, Paris, France (http://www.la-ser.com).
Biology
Peripheral venous blood was obtained from each patient at entry for the measurement of total IgE (international units per mL) and blood eosinophilia (number per mm3) and for preparation and storage of
250-µL serum aliquots.In addition, venous blood was collected from allpatients into three EDTA-treated vials containing 7 mL blood for DNA isolation. Serum and blood samples were immediately frozen at −80°C in each centre and were then shipped to the Biological ResourcesCentre (CRB) of the Bichat Hospital in Paris (Drs Sarah Tubiana and Virginie Huart). At CRB, DNA was isolated and aliquots were stored at −80°C,together with serum samples.All samples were tracked by a dedicated database. We examined demographic and clinical factors associated with the number of eosinophils at baseline, using data from 855 of the 1080 patients having peripheral blood cell counts. We distributed these
Subjects enrolled - Visit 1 - Baseline assessment (n=1080)
GINA 1 (n=68) GINA 2 (n=151) GINA 3 (n=182) GINA 4 (n=408) GINA 5 (n=205)
Medical history n=64 Atopy n=52 Blood eosinophils n=60 Lifestyle/environment exposures n=37 Spirometry n=66 Asthma control n=67 ACQ n=57 Comorbidities n=66 Medications n=67 Medical history n=145 Atopy n=125 Blood eosinophils n=122 Lifestyle/environment exposures n=74 Spirometry n=147 Asthma control n=149 ACQ n=121 Comorbidities n=149 Medications n=149 Medical history n=173 Atopy n=140 Blood eosinophils n=138 Lifestyle/environment exposures n=91 Spirometry n=178 Asthma control n=179 ACQ n=138 Comorbidities n=177 Medications n=177 Medical history n=385 Atopy n=316 Blood eosinophils n=347 Lifestyle/environment exposures n=157 Spirometry n=403 Asthma control n=406 ACQ n=270 Comorbidities n=392 Medications n=385 Medical history n=188 Atopy n=165 Blood eosinophils n=163 Lifestyle/environment exposures n=72 Spirometry n=198 Asthma control n=201 ACQ n=106 Comorbidities n=200 Medications n=201
Subjects with blood eosinophil count - longitudinal assessment (n=427)
Blood eosinophils <150
n=143 (33.5%) Blood eosinophils ≥150, ≤300n=131 (30.7%) Blood eosinophils >300n=153 (35.8%)
FIGURE 1 Flow chart showing visit schedule and consort diagram. The items listed in the frames have been defined as follows. Medical history: age of asthma onset, family history of asthma, hospitalisations for asthma and intensive care unit (ICU) admissions during lifetime, visits to emergency department in the past year; atopy: at least one positive skin prick test or detectable levels of specific IgE for any of the 11 allergens tested; lifestyle and environmental exposures: smoking, cat, dog, carpet, plants, mould and professional exposure; spirometry: pre-bronchodilator forced expiratory volume in 1 s (in L·s−1, or as % pred); asthma control: optimal, suboptimal or inacceptable; Asthma Control Questionnaire (ACQ):
the complete five-question Juniper questionnaire; comorbidities: allergic (sinusitis, nasal polyposis, allergic rhinitis, conjunctivitis, eczema, urticaria, anaphylactic shock, Quincke oedema, food, drug and venom allergy) and nonallergic (cardiovascular and gastro-oesophageal reflux disease); medications: short-acting β2 agonists, long-acting β2 agonists, antihistamine, antigastro-oesophageal reflux, inhaled corticosteroids, oral corticosteroids, anti-cholinergics, leukotriene modifiers, omalizumab. GINA: Global Initiative for Asthma.
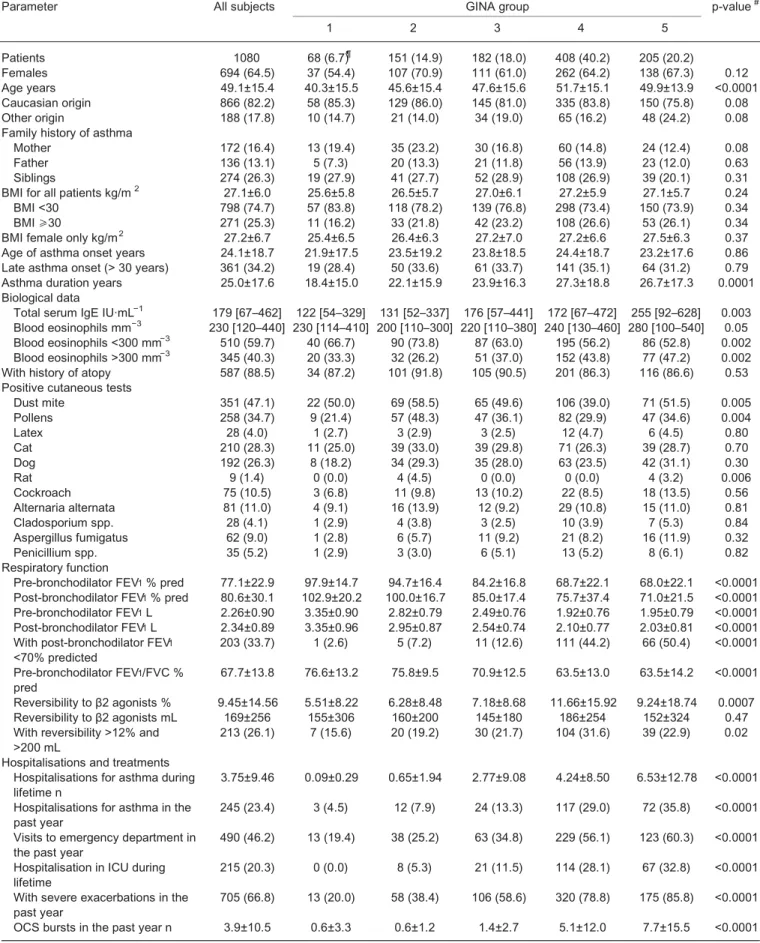
TABLE 1 Patient characteristics at baseline
Parameter All subjects GINA group p-value#
1 2 3 4 5 Patients 1080 68 (6.7)¶ 151 (14.9) 182 (18.0) 408 (40.2) 205 (20.2) Females 694 (64.5) 37 (54.4) 107 (70.9) 111 (61.0) 262 (64.2) 138 (67.3) 0.12 Age years 49.1±15.4 40.3±15.5 45.6±15.4 47.6±15.6 51.7±15.1 49.9±13.9 <0.0001 Caucasian origin 866 (82.2) 58 (85.3) 129 (86.0) 145 (81.0) 335 (83.8) 150 (75.8) 0.08 Other origin 188 (17.8) 10 (14.7) 21 (14.0) 34 (19.0) 65 (16.2) 48 (24.2) 0.08 Family history of asthma
Mother 172 (16.4) 13 (19.4) 35 (23.2) 30 (16.8) 60 (14.8) 24 (12.4) 0.08 Father 136 (13.1) 5 (7.3) 20 (13.3) 21 (11.8) 56 (13.9) 23 (12.0) 0.63 Siblings 274 (26.3) 19 (27.9) 41 (27.7) 52 (28.9) 108 (26.9) 39 (20.1) 0.31 BMI for all patients kg/m2 27.1±6.0 25.6±5.8 26.5±5.7 27.0±6.1 27.2±5.9 27.1±5.7 0.24
BMI <30 798 (74.7) 57 (83.8) 118 (78.2) 139 (76.8) 298 (73.4) 150 (73.9) 0.34 BMI ⩾30 271 (25.3) 11 (16.2) 33 (21.8) 42 (23.2) 108 (26.6) 53 (26.1) 0.34 BMI female only kg/m2 27.2±6.7 25.4±6.5 26.4±6.3 27.2±7.0 27.2±6.6 27.5±6.3 0.37
Age of asthma onset years 24.1±18.7 21.9±17.5 23.5±19.2 23.8±18.5 24.4±18.7 23.2±17.6 0.86 Late asthma onset (> 30 years) 361 (34.2) 19 (28.4) 50 (33.6) 61 (33.7) 141 (35.1) 64 (31.2) 0.79 Asthma duration years 25.0±17.6 18.4±15.0 22.1±15.9 23.9±16.3 27.3±18.8 26.7±17.3 0.0001 Biological data
Total serum IgE IU·mL−1 179 [67–462] 122 [54–329] 131 [52–337] 176 [57–441] 172 [67–472] 255 [92–628] 0.003
Blood eosinophils mm−3 230 [120–440] 230 [114–410] 200 [110–300] 220 [110–380] 240 [130–460] 280 [100–540] 0.05
Blood eosinophils <300 mm−3 510 (59.7) 40 (66.7) 90 (73.8) 87 (63.0) 195 (56.2) 86 (52.8) 0.002
Blood eosinophils >300 mm−3 345 (40.3) 20 (33.3) 32 (26.2) 51 (37.0) 152 (43.8) 77 (47.2) 0.002
With history of atopy 587 (88.5) 34 (87.2) 101 (91.8) 105 (90.5) 201 (86.3) 116 (86.6) 0.53 Positive cutaneous tests
Dust mite 351 (47.1) 22 (50.0) 69 (58.5) 65 (49.6) 106 (39.0) 71 (51.5) 0.005 Pollens 258 (34.7) 9 (21.4) 57 (48.3) 47 (36.1) 82 (29.9) 47 (34.6) 0.004 Latex 28 (4.0) 1 (2.7) 3 (2.9) 3 (2.5) 12 (4.7) 6 (4.5) 0.80 Cat 210 (28.3) 11 (25.0) 39 (33.0) 39 (29.8) 71 (26.3) 39 (28.7) 0.70 Dog 192 (26.3) 8 (18.2) 34 (29.3) 35 (28.0) 63 (23.5) 42 (31.1) 0.30 Rat 9 (1.4) 0 (0.0) 4 (4.5) 0 (0.0) 0 (0.0) 4 (3.2) 0.006 Cockroach 75 (10.5) 3 (6.8) 11 (9.8) 13 (10.2) 22 (8.5) 18 (13.5) 0.56 Alternaria alternata 81 (11.0) 4 (9.1) 16 (13.9) 12 (9.2) 29 (10.8) 15 (11.0) 0.81 Cladosporium spp. 28 (4.1) 1 (2.9) 4 (3.8) 3 (2.5) 10 (3.9) 7 (5.3) 0.84 Aspergillus fumigatus 62 (9.0) 1 (2.8) 6 (5.7) 11 (9.2) 21 (8.2) 16 (11.9) 0.32 Penicillium spp. 35 (5.2) 1 (2.9) 3 (3.0) 6 (5.1) 13 (5.2) 8 (6.1) 0.82 Respiratory function
Pre-bronchodilator FEV1% pred 77.1±22.9 97.9±14.7 94.7±16.4 84.2±16.8 68.7±22.1 68.0±22.1 <0.0001 Post-bronchodilator FEV1% pred 80.6±30.1 102.9±20.2 100.0±16.7 85.0±17.4 75.7±37.4 71.0±21.5 <0.0001
Pre-bronchodilator FEV1L 2.26±0.90 3.35±0.90 2.82±0.79 2.49±0.76 1.92±0.76 1.95±0.79 <0.0001 Post-bronchodilator FEV1L 2.34±0.89 3.35±0.96 2.95±0.87 2.54±0.74 2.10±0.77 2.03±0.81 <0.0001 With post-bronchodilator FEV1
<70% predicted 203 (33.7) 1 (2.6) 5 (7.2) 11 (12.6) 111 (44.2) 66 (50.4) <0.0001 Pre-bronchodilator FEV1/FVC %
pred 67.7±13.8 76.6±13.2 75.8±9.5 70.9±12.5 63.5±13.0 63.5±14.2 <0.0001 Reversibility to β2 agonists % 9.45±14.56 5.51±8.22 6.28±8.48 7.18±8.68 11.66±15.92 9.24±18.74 0.0007 Reversibility to β2 agonists mL 169±256 155±306 160±200 145±180 186±254 152±324 0.47 With reversibility >12% and
>200 mL 213 (26.1) 7 (15.6) 20 (19.2) 30 (21.7) 104 (31.6) 39 (22.9) 0.02 Hospitalisations and treatments
Hospitalisations for asthma during
lifetime n 3.75±9.46 0.09±0.29 0.65±1.94 2.77±9.08 4.24±8.50 6.53±12.78 <0.0001 Hospitalisations for asthma in the
past year 245 (23.4) 3 (4.5) 12 (7.9) 24 (13.3) 117 (29.0) 72 (35.8) <0.0001 Visits to emergency department in
the past year 490 (46.2) 13 (19.4) 38 (25.2) 63 (34.8) 229 (56.1) 123 (60.3) <0.0001 Hospitalisation in ICU during
lifetime 215 (20.3) 0 (0.0) 8 (5.3) 21 (11.5) 114 (28.1) 67 (32.8) <0.0001 With severe exacerbations in the
past year 705 (66.8) 13 (20.0) 58 (38.4) 106 (58.6) 320 (78.8) 175 (85.8) <0.0001 OCS bursts in the past year n 3.9±10.5 0.6±3.3 0.6±1.2 1.4±2.7 5.1±12.0 7.7±15.5 <0.0001
Continued
855 patients with asthma into three groups, according to their eosinophil count at baseline, i.e., low eosinophilia, <150 mm –3 (n=271, 31.7%), mild eosinophilia, 150–300 mm –3 (n=251, 29.4%) and high eosinophilia, >300 mm –3(n=333, 38.9%) (figure 1).
Patient follow-up and longitudinal analyses
In the COBRA cohort, patients were reviewed over a period of 10 years,with a visit performed every 6– 9 months for the first 5 years, and then once a year for the following 5 years. At the time of each visit, serum samples were collected and stored at the CRB. Peripheral blood eosinophil level, spirometry and clinical examination results, asthma symptoms and control, and quality of life were recorded, and any change in treatment was noted. Specifically, normalised annual dose and burst frequency of OCS, and addition or removal of controlling medications were recorded.
We first determined the evolution in the number of peripheral blood eosinophils, according to the categories defined above at entry (low, mild and high eosinophilia). This analysis was performed in 427 patients with asthma out of the 1080 initially included, as they had at least three differential blood cell counts, including at the inclusion visit (figure 1). The time elapsing from the first (inclusion) and the third measurement was (mean± SD) 22.0±15.6 months.
Secondly,we examined potential associations between changes in blood eosinophil counts from baseline to various points during follow-up, and the rate of exacerbations and asthma control.
Statistical analyses
All statistical analyses were performed using SAS (V.9.3, SAS Institute Inc., Carey, North Carolina, USA) and R 2.15.2 (R Foundation for Statistical Computing, Vienna, Austria) software programs. In all analyses, p<0.05 was considered significant.
Categorical variables were summarised as numbers and percentages and compared by the Chi-squared test. Normally distributed quantitative variables were reported as mean values and standard deviations (mean ±SD), and compared using ANOVA. Non-normal variables were log-transformed prior to testing, and were reported as medians and interquartile range (IQR). These variables were compared using Kruskal–Wallis analysis and Mann–Whitney U-test. Cross-sectionalassociations between biologicaland clinical variables at baseline were assessed using the nonparametric Spearman’s rank correlation coefficient (ρ). Benjamini– Hochberg correction with a family-wise error rate of 0.05 was used to adjust for multiple comparisons. The association between eosinophilcount, eosinophil count evolution and the rate of asthma exacerbations was assessed using a Poisson regression model. In this model, a random intercept was included (mixed-effects model) to account for several measurements occurring in the same patient. The association between eosinophil count, eosinophil count evolution and the Juniper score was determined using a linear regression model. In this model, a random intercept was included (mixed-effects model) to account for several measurements occurring in the same patient. Multivariate models including tobacco smoking, long-term steroid use and anti-IgE use were built. In these models, all the variables were allowed to vary over time. Results
Patient characteristics at baseline
In total, 1080 adults were recruited between 2007 and 2015, and they were distributed into five groups: three with either mild or moderate asthma (groups from GINA 1, 2 and 3, n=401) and two with severe asthma (groups from GINA steps 4 and 5, n=613) (table 1). The age of patients with asthma increased as
TABLE 1 Continued
Parameter All subjects GINA group p-value#
1 2 3 4 5 Asthma control Optimal 239 (23.3) 47 (70.1) 75 (50.3) 51 (28.5) 43 (10.6) 19 (9.5) <0.0001 Suboptimal 299 (29.2) 15 (22.4) 55 (36.9) 78 (43.6) 114 (28.1) 31 (15.4) <0.0001 Unacceptable 486 (47.5) 5 (7.5) 19 (12.8) 50 (27.9) 249 (61.3) 151 (75.1) <0.0001 ACQ score 1.99±1.49 0.67±0.86 1.07±1.09 1.74±1.26 2.58±1.47 2.66±1.43 <0.0001 Data are presented as n (%), mean±SDor median (interquartile range). #: ANOVA, or chi-squared test across Global Initiative for Asthma (GINA)
groups 1 to 5. BMI: body mass index; FEV1: forced expiratory volume in 1 s; FVC: forced vital capacity; ICU: intensive care unit; OCS: oral corticosteroids; ACQ: Asthma Control Questionnaire. Bold type denotes statistical significance.
the severity of asthma progressed and, therefore, asthma duration was higher in patients with severe asthma (GINA groups 4 and 5) than in patients with mild/moderate disease. Overall, the large majority of the 1080 patients included in the COBRA cohort were of Caucasian origin (i.e. 82.2%), although this proportion was slightly lower in patients with severe asthma from GINA group 5 (74.9%, p=0.08). Compared with patients with mild/moderate asthma, patients with severe asthma had higher numbers of peripheral blood eosinophils (overall p=0.002), and the proportion of patients with blood eosinophil counts of >300 mm−3was higher in both the GINA groups 4 and 5 (43.8 and 47.2%, respectively),than in
the groups of patients with mild/moderate asthma (from 26.2% to 37.0%) (table 1). There was also a significant increase in the levels of total IgE in patients with severe asthma in GINA group 5, compared with the other groups (overall p=0.003) (table 1).
Body mass index (BMI) was not statistically different between patients with severe asthma (GINA groups 4 and 5) and those with mild/moderate asthma (GINA groups 1–3) (overall p=0.37). This lack of significance was also found when we analysed only female patients with asthma (overall p=0.37) (table 1). There was a high incidence of atopy history in the five asthma groups (86.3–91.8%), and this condition slightly, but not significantly, prevailed in GINA groups 2 and 3 (table 1). In addition, whereas the rate of patients with asthma with positive cutaneous tests to most of the allergens tested (latex, cat, dog, rat, cockroach and moulds) was similar in all asthmatic groups, more patients with mild/moderate asthma from GINA groups 2 and 3 had cutaneous hypersensitivity reactions to dust mites and pollen (overall p=0.005 and p=0.004, respectively) (table 1).
As expected, patients with severe asthma (GINA groups 4 and 5) had significantly lower pre- and post-bronchodilator FEV1 and pre-bronchodilator FEV1/FVC, and the proportion of patients with persistent airflow obstruction (i.e. post-bronchodilator FEV 1 < 70% of predicted) was higher (44.2% and 50.4% for GINA groups 4 and 5, respectively) than in the groups with mild/moderate asthma ( 2.6%, 7.2% and 12.6% for GINA groups 1, 2 and 3, respectively) (overall p<0.0001,table 1).
In addition, compared with patients with milder disease, patients with severe asthma had a higher number of hospitalisations and ICU admissions for asthma during their lifetime, and of hospitalisations and emergency department visits for asthma in the past 12 months (table 1). A higher rate of these patients with severe asthma had also experienced severe exacerbations in the past year (78.8% and 85.8% in GINA groups 4 and 5, respectively) compared with patients with mild/moderate asthma (20.0%, 38.4% and 58.6%, in GINA groups 1, 2 and 3, respectively) (overall p<0.0001, table 1). In line with this observation, the number of OCS bursts during the 12 months preceding inclusion in the cohort was higher in patients with severe than in patients with mild/moderate asthma (overall p<0.0001) (table 1).
Finally, 61.3 and 75.1% of the patients with severe asthma in GINA groups 4 and 5, respectively, were considered therapy-uncontrolled, compared with 7.5%, 12.8% and 27.9% of the patients in GINA groups 1, 2 and 3, respectively. Accordingly, the mean ACQ score of the patients with severe asthma was significantly higher (2.58 and 2.66 in GINA groups 4 and 5, respectively) than those of patients with mild/ moderate asthma (values from 0.67 to 1.74 in GINA groups 1 to 3) (overall p<0.0001, table 1).
Lifestyle, environmental exposures and comorbidities
The overall proportion of current smokers was not statistically different across the five groups of patients with asthma (table S1). In contrast, the rate of former smokers was higher in GINA groups 3 and 4 (33.0 and 31.9%, respectively), than in the other groups (between 17.6 and 27.9%, overall p=0.04, table S1). Higher proportions of never smokers were found in GINA groups 1, 2 and 5 (69.1, 70.2 and 53.9%, respectively) than in GINA groups 3 and 4 (60.4 and 65.2%, respectively,overall p=0.02, table S1). In addition, a higher proportion of patients with severe asthma from GINA groups 4 and 5 were exposed to dogs (44.5 and 49.5%, respectively, overall p=0.004) and moulds (27.6 and 41.0%, respectively, overall p=0.0008) compared with patients with mild/moderate asthma (table S1). Other environmental and professional exposures are shown in table S1.
There was a higher incidence of sinusitis, nasal polyps (overall p<0.0001),drug allergy (overall p=0.03) and gastro-oesophageal reflux (overall p<0.0001) in patients with severe asthma compared with patients with mild/ moderate asthma (table S2). Allergic conjunctivitis prevailed in patients from GINA group 2 (42.4%) and, to a lesser extent, GINA group 3 (32.2%) (overall p=0.04) (table S2). Other comorbidities are listed in table S2.
Medications
The large majority of patients with asthma from GINA groups 3–5 were using both LABA and ICS (table S3). Use of antihistamine, anticholinergic and antigastro-oesophageal reflux disease drugs increased as asthma severity progressed (table S3).Other classes of therapy were also used (table S3).
Because GINA step 5 defines continuous OCS intake and higher levels of add-on treatment [7],we found that 34.0% of patients in group 5 were being treated with OCS (mean daily dose of 22±21 mg):40.7% with leukotriene modifiers and 74.2% with omalizumab (table S3).
Finally, the mean proportion of patients with asthma in the whole cohort who declared adherence to treatment was 90.9%, with the highest rate (95.6%) observed in patients with severe asthma in GINA group 5 (table S3).
Correlation analyses at baseline
We then examined cross-sectional associationsbetween respiratory function, exacerbationsand asthma control and the demographic,biological and clinical parameters collected in the 1080 patients with asthma at inclusion (table 2).
The number of peripheral blood eosinophils negatively correlated with female sex ( p=0.04), BMI ( p=0.029) and pre-bronchodilator FEV1 ( p=0.0004),whereas it was positively associated with age and late asthma onset ( p⩽0.01),allergic sinusitis ( p=0.038),and nasal polyps ( p=0.0002) (table 2).
Pre-bronchodilator FEV1 negatively correlated with age,Caucasian origin,asthma duration ( p⩽0.004) and treatment (LABA, ICS, anti-IgE, leukotriene modifiers and number of OCS bursts, p⩽0.003 for all comparisons). FEV1 was also negatively associated with the rate of hospitalisations for asthma during lifetime ( p=0.0002) and with most of the comorbidities,particularly with nasal polyps ( p=0.0004),allergic rhinitis ( p=0.0028),cardiovascular diseases ( p=0.0018) and gastro-oesophageal reflux ( p=0.009) (table 2). The proportion of patients with asthma having experienced severe exacerbations in the past year positively correlated with female sex ( p=0.034),with former smoking ( p=0.026), with treatment (LABA, ICS and
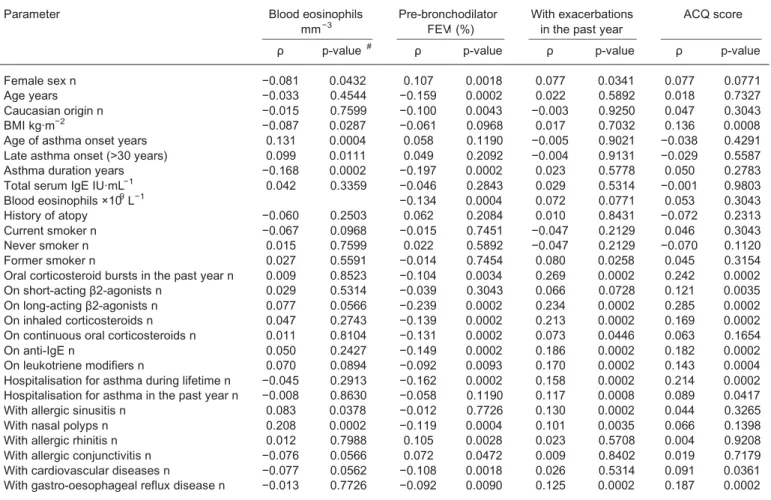
TABLE 2 Main correlation analyses in asthmatics at inclusion
Parameter Blood eosinophils
mm−3 Pre-bronchodilatorFEV1(%) With exacerbationsin the past year ACQ score
ρ p-value # ρ p-value ρ p-value ρ p-value
Female sex n −0.081 0.0432 0.107 0.0018 0.077 0.0341 0.077 0.0771 Age years −0.033 0.4544 −0.159 0.0002 0.022 0.5892 0.018 0.7327 Caucasian origin n −0.015 0.7599 −0.100 0.0043 −0.003 0.9250 0.047 0.3043 BMI kg·m−2 −0.087 0.0287 −0.061 0.0968 0.017 0.7032 0.136 0.0008
Age of asthma onset years 0.131 0.0004 0.058 0.1190 −0.005 0.9021 −0.038 0.4291 Late asthma onset (>30 years) 0.099 0.0111 0.049 0.2092 −0.004 0.9131 −0.029 0.5587 Asthma duration years −0.168 0.0002 −0.197 0.0002 0.023 0.5778 0.050 0.2783 Total serum IgE IU·mL−1 0.042 0.3359 −0.046 0.2843 0.029 0.5314 −0.001 0.9803
Blood eosinophils ×109L−1 −0.134 0.0004 0.072 0.0771 0.053 0.3043
History of atopy −0.060 0.2503 0.062 0.2084 0.010 0.8431 −0.072 0.2313 Current smoker n −0.067 0.0968 −0.015 0.7451 −0.047 0.2129 0.046 0.3043 Never smoker n 0.015 0.7599 0.022 0.5892 −0.047 0.2129 −0.070 0.1120 Former smoker n 0.027 0.5591 −0.014 0.7454 0.080 0.0258 0.045 0.3154 Oral corticosteroid bursts in the past year n 0.009 0.8523 −0.104 0.0034 0.269 0.0002 0.242 0.0002 On short-acting β2-agonists n 0.029 0.5314 −0.039 0.3043 0.066 0.0728 0.121 0.0035 On long-acting β2-agonists n 0.077 0.0566 −0.239 0.0002 0.234 0.0002 0.285 0.0002 On inhaled corticosteroids n 0.047 0.2743 −0.139 0.0002 0.213 0.0002 0.169 0.0002 On continuous oral corticosteroids n 0.011 0.8104 −0.131 0.0002 0.073 0.0446 0.063 0.1654 On anti-IgE n 0.050 0.2427 −0.149 0.0002 0.186 0.0002 0.182 0.0002 On leukotriene modifiers n 0.070 0.0894 −0.092 0.0093 0.170 0.0002 0.143 0.0004 Hospitalisation for asthma during lifetime n −0.045 0.2913 −0.162 0.0002 0.158 0.0002 0.214 0.0002 Hospitalisation for asthma in the past year n −0.008 0.8630 −0.058 0.1190 0.117 0.0008 0.089 0.0417 With allergic sinusitis n 0.083 0.0378 −0.012 0.7726 0.130 0.0002 0.044 0.3265 With nasal polyps n 0.208 0.0002 −0.119 0.0004 0.101 0.0035 0.066 0.1398 With allergic rhinitis n 0.012 0.7988 0.105 0.0028 0.023 0.5708 0.004 0.9208 With allergic conjunctivitis n −0.076 0.0566 0.072 0.0472 0.009 0.8402 0.019 0.7179 With cardiovascular diseases n −0.077 0.0562 −0.108 0.0018 0.026 0.5314 0.091 0.0361 With gastro-oesophageal reflux disease n −0.013 0.7726 −0.092 0.0090 0.125 0.0002 0.187 0.0002
#: Spearman’s rank order method and Benjamini and Hochberg correction for multiple comparisons. FEV1: forced expiratory volume in 1 s;
omalizumab, p=0.0002), with some comorbidities (e.g. sinusitis,nasal polyps and gastro-oesophageal reflux, p⩽0.003) and with hospitalisations for asthma during lifetime and in the past year ( p⩽0.0008) (table 2). Finally, asthma control, as assessed by ACQ score,significantly correlated with BMI ( p=0.0008) and with treatment, including SABA, LABA, ICS, OCS bursts in the past year ( p⩽0.003)and with omalizumab intake ( p=0.0002). ACQ score was also positively associated with hospitalisations for asthma in life ( p=0.0002) and in the past year ( p=0.04), with cardiovascular diseases ( p=0.036) and with gastro-oesophageal reflux disease ( p=0.0002) (table 2).
Cross-sectional and longitudinal analyses on blood eosinophil count
When patients were classified into three groups according to their eosinophil count at baseline, we confirmed that patients with asthma with high eosinophilia (>300 mm −3) belonged mostly to GINA groups 4 and 5 (69.8%). These patients had elevated total IgE levels, late asthma onset, lower asthma duration and FEV 1, higher reversibility to β2 agonists, a higher rate of severe exacerbations and higher incidence of unacceptable asthma control (table 3).
We first looked at the variation in blood eosinophils over time for the 427 patients with asthma who had at least three differential blood cell counts. Overall, no significant change was noted (figure S2).Of note, no significant effect of treatment adjustment (leukotriene receptor antagonist,OCS, omalizumab) on the variation in blood eosinophils over time was found (figure S2).
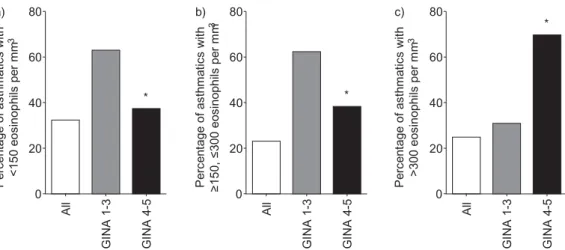
We then analysed the stability of blood eosinophil numbers over time, relative to their count at baseline (figure 2). We found that 32.2%,22.9% and 24.8%,respectively,of patients with low, mild and high blood eosinophilia at inclusion maintained stable numbers of eosinophils during approximately 2 years of follow-up (figure 2).
In parallel, we investigated the influence of variations in the number of blood eosinophils during follow-up and asthma severity,relative to their counts at inclusion. We found that a higher proportion of patients with mild/moderate asthma (GINA groups 1–3) whose eosinophil number at inclusion was <150 mm−3 ( p=0.0004,Fisher exacttest, two-tailed), or 150–300 mm −3( p=0.001) had stable eosinophilia over time, compared with patients with severe asthma (GINA groups 4 and 5). The opposite results were obtained when we analysed patients with eosinophil counts >300 mm−3at entry, as nearly 70% of patients with severe asthma had stable eosinophil numbers during follow-up,compared with 31% of patients with mild/ moderate asthma ( p<0.0001) (figure 2).
We also determined the effect of OCS on blood eosinophil counts. This analysis was performed on 54 patients with severe asthma who were on daily OCS treatment at inclusion and throughout the entire follow-up period. We found a significant correlation ( p=0.04) between decrease in eosinophilnumbers and the dose of OCS (figure S1).
Finally, we examined the impact of an increase in the number of blood eosinophils on the occurrence of exacerbations during follow-up. Overall, 2742 exacerbations were reported in the COBRA cohort (1135 patient-years of follow-up), with an unadjusted rate of 2.41. The number of exacerbations per patient per year amounted to 1.97,2.54 and 2.75 for patients with low (<150 mm−3), mild (150–300 mm−3), and high eosinophilia (>300 mm −3), respectively. During follow-up, both eosinophil count and increase in eosinophil count were associated with the number of exacerbationsthat occurred until the next visit (table 4). We also found that in this longitudinal analysis,both eosinophil count and the increase in eosinophil count were associated with Juniper score (table 4).
When adjusted for tobacco smoking,FEV1, long-term corticosteroid use and anti-IgE use,the increase in the eosinophil count ( per 200 increase) was still associated with the number of exacerbations that occurred until the next visit ( p=0.02) whereas eosinophil count was not ( p=0.77) (table 5).
We did not find any association between eosinophil count or increase in eosinophil count and hospitalisations ( p=0.89 and 0.25, respectively) (table S4).
Finally, we sought to assess the prognostic value of eosinophil count on upcoming exacerbations using the area under the curve (AUC) for receiver operating characteristic (ROC).ROC AUC was 0.54 and 0.59 for eosinophil and delta eosinophil count,respectively.
Discussion
At the time of the current analyses,1080 patients with asthma were enrolled in the multicentre French COBRA cohort. Among these patients,those with severe asthma (GINA groups 4 and 5) represented more than 60% of the total population. These patients were older,had longer asthma duration, elevated blood eosinophilia and lower lung function, and they had greater exposure to dogs and moulds than patients
with milder disease. In addition, patients with severe asthma had lower disease control,higher frequency of severe exacerbations and visits to the emergency department in the past year,and higher frequency of hospitalisations and ICU admissions for asthma during their lifetime. A higher incidence of nasal polyps, rhinosinusitis, gastro-oesophagealreflux and hypertension was also noted in patients with asthma in GINA groups 4–5 relative to GINA groups 1–3.
As expected,patients with severe asthma were treated with higher doses of ICS and they received more antihistamine, anticholinergic, theophylline, leukotriene modifier and anti-gastro-oesophagealreflux medications than patients with milder disease.Omalizumab was prescribed to 74.2% of patients with severe asthma in GINA group 5 (16.1% of the total asthmatic population). In this group, 34% of patients were also on OCS therapy (7.3% of the totalasthmatic population), with a mean daily dose of 22 mg oral
TABLE 3 Characteristics of asthmatic patients according to peripheral blood eosinophils at inclusion
Parameter All subjects Eosinophils
<150 mm−3 150−300 mmEosinophils−3 Eosinophils>300 mm−3 p-value # Patients 855 271 (31.7) 251 (29.4) 333 (38.9) Females 546 (63.9) 187 (69.3) 165 (65.7) 194 (58.3) 0.02 Age years 48.6±15.6 50.4±15.7 47.4±15.2 48.1±15.8 0.08 Caucasian origin 686 (81.8) 210 (79.5) 210 (84.7) 266 (81.3) 0.32 Other origin 153 (18.2) 54 (20.5) 38 (15.3) 61 (18.7) 0.32 BMI kg·m−2all patients 27.1±6.1 26.9±5.9 28.2±6.8 26.5±5.6 0.002
Age of asthma onset years 24.0±18.5 23.7±18.0 20.9±18.0 26.7±18.9 0.0008 Late asthma onset (>30 years) 285 (33.9) 88 (33.2) 73 (29.4) 124 (37.7) 0.12 Asthma duration years 24.7±17.5 27.0±19.2 26.5±16.8 21.4±16.1 <0.0001 Asthma severity
Mild/moderate asthma (GINA 1–3) 320 (38.6) 109 (41.4) 114 (46.3) 97 (30.2) 0.0002 Severe asthma (GINA 4–5) 510 (61.4) 154 (58.6) 132 (53.7) 224 (69.8) 0.0002 Biological characteristics
Total serum IgE IU·mL−1 181 (67–457) 101 (39–314) 175 (66–389) 255 (99–609) <0.0001
With history of atopy 487 (87.6) 147 (85.5) 157 (91.3) 183 (86.3) 0.21 Respiratory function
Pre-bronchodilator FEV1% pred 77.6±23.0 80.9±25.0 78.7±22.3 74.1±21.4 0.002
Post-bronchodilator FEV1% pred 80.7±31.4 83.4±24.1 83.8±45.1 76.6±22.3 0.05
Pre-bronchodilator FEV1L 2.28±0.91 2.31±0.90 2.33±0.91 2.23±0.90 0.34
Post-bronchodilator FEV1L 2.36±0.90 2.35±0.93 2.41±0.90 2.34±0.87 0.70
With post-bronchodilator FEV1<70%
pred 168 (33.9) 40 (28.4) 47 (32.0) 81 (38.9) 0.11 Pre-bronchodilator FEV1/FVC % pred 67.6±14.1 69.6±14.6 67.4±14.3 66.1±13.4 0.01
Reversibility to β2-agonists % 9.3±14.8 7.4±14.4 8.7±13.2 11.2±15.9 0.02 Reversibility to β2-agonists mL 169±263 140±294 154±245 200±249 0.04 With reversibility >12% and >200 mL 165 (25.1) 33 (16.9) 46 (23.7) 86 (32.0) 0.001 Hospitalisations and treatments
Hospitalisations for asthma during
lifetime n 3.74±9.62 3.99±9.41 3.84±10.51 3.47±9.10 0.80 Hospitalisation for asthma in the past
year 196 (23.3) 71 (26.7) 49 (20.0) 76 (23.1) 0.21 Visits to emergency department in the
past year 404 (47.6) 131 (48.9) 106 (42.6) 167 (50.5) 0.16 Hospitalisation in ICU during lifetime 185 (21.9) 64 (23.9) 53 (21.5) 68 (20.5) 0.61 With severe exacerbation in the past
year 569 (67.4) 185 (69.0) 149 (60.1) 235 (71.7) 0.02 OCS bursts in the past year n 4.1±10.6 4.9±14.0 2.7±6.9 4.4±9.6 0.05 On maintenance use of OCS 54 (6.4) 20 (7.5) 9 (3.6) 25 (7.7) 0.10 Dose of OCS mg per day 21.7±17.8 26.0±20.0 22.4±16.8 18.1±16.1 0.34 Asthma control
Optimal asthma control 195 (23.4) 66 (24.9) 72 (29.4) 57 (17.6) 0.002 Suboptimal asthma control 229 (27.5) 85 (32.1) 62 (25.3) 82 (25.4) 0.002 Unacceptable asthma control 409 (49.1) 114 (43.0) 111 (45.3) 184 (57.0) 0.002 ACQ score 1.99±1.52 2.04±1.55 1.81±1.51 2.10±1.49 0.17 Data are presented as n (%), mean±SD, or median (interquartile range). #: ANOVA,or chi-squared test, or Kruskal–Wallis test across patient
groups. BMI: body mass index; GINA: Global Initiative for Asthma; FEV1: forced expiratory volume in 1 s; FVC: forced vital capacity;
prednisone. Together, these observations indicate that the patients with severe asthma included in the COBRA cohort are among the most severe cases currently described in the literature [11–15].
Correlation analyses conducted in the 1080 patients with asthma at baseline demonstrated highly significant associations between airflow obstruction and severaldemographic and clinical characteristics, including female sex, age,BMI, age of asthma onset,duration of asthma, presence of atopy, atopic and non-atopic comorbidities, and treatments. In addition, the incidence of severe exacerbations in the past year and the ACQ score,used as an index of asthma control,correlated significantly with female sex,BMI, steroid and add-on therapy,and nonallergic (but not allergic) comorbidities, including gastro-oesophageal reflux and cardiovascular diseases.
Overall, these findings confirm, to a large extent, previous observations obtained with other cohorts or with large groups of patients [2,13, 14, 19–22], thereby validating the COBRA cohort as a suitable tool for studies on epidemiological,physiopathological and clinical aspects of asthma.
P er ce nt ag e of a st hm at ic s w ith <1 50 e os in op hi ls p er m m 3 80 a) b) c) 60 40 20 0 A ll G IN A 1 -3 G IN A 4 -5 P er ce nt ag e of a st hm at ic s w ith ≥1 50 , ≤ 30 0 eo si no ph ils p er m m 3 P er ce nt ag e of a st hm at ic s w ith >3 00 e os in op hi ls p er m m 3 80 60 40 * * * 20 0 A ll G IN A 1 -3 G IN A 4 -5 80 60 40 20 0 A ll G IN A 1 -3 G IN A 4 -5
FIGURE 2 Changes in the number of peripheral blood eosinophils over time, according to values at inclusion and to asthma severity. a) Patients with asthma with eosinophil counts of <150 mm−3at inclusion; b) patients
with asthma with 150–300 mm−3at inclusion; c) patients with asthma with >300 mm −3at inclusion. *p<0.05,
compared with Global Initiative for Asthma (GINA) groups 1–3 (mild/moderate asthma) (Fisher exact test, two-tailed).
TABLE 4 Influence of eosinophil count evolution on Juniper score
Univariate analysis Multivariate analysis#
Value (SE) p-value Value (SE) p-value
Intercept 11.9 (0.68) <0.0001 16.2 (2.0) <0.0001 Eosinophils count per 200 0.22 (0.10) 0.03 0.03 (0.24) 0.89 Delta eosinophil count per 200 increase 0.22 (0.09) 0.01 0.36 (0.16) 0.03
#: adjusted for tobacco smoking, forced expiratory volume in 1 second, and long-term corticosteroids and
anti-IgE use.
TABLE 5 Influence of eosinophil count evolution on exacerbation rate
Univariate analysis Multivariate analysis#
Rate ratio (95% CI) p-value Rate ratio (95% CI) p-value Eosinophils count per 200 increase 1.21 (1.01–1.47) 0.04 1.03 (0.84–1.26) 0.77 Delta eosinophil count per 200 increase 1.24 (1.10–1.40) 0.001 1.15 (1.02–1.31) 0.02
#: adjusted for tobacco smoking, forced expiratory volume in 1 s, and long-term corticosteroids and
Measurement of peripheral blood eosinophils is an easily obtainable and reliable biomarker, allowing the identification of specific asthma phenotypes [23, 24]. High eosinophilia (usually defined as blood eosinophil counts of ⩾300 mm−3or ⩾400 mm −3) is associated with poor asthma control and elevated incidence of severe exacerbations[25, 26]. In this context, SCHLEICHet al. [27] recently showed that exacerbations were particularly frequent when combining blood and sputum eosinophil counts,underlying the role of both systemic and local eosinophilic inflammation.
Eosinophil count also provides guidance to identify a threshold for characterising clinical responses to biologics, particularly those targeting T helper 2-type responses [6, 27]. To examine the evolution of eosinophils over time, we first separated our 1080 patients into three groups, according to the number of blood eosinophils at inclusion (<150 mm −3(low), 150–300 mm−3(mild) and >300 mm −3(high)). We found that only 32.2%, 22.9% and 24.8%, respectively,of these patients maintained stable numbers of eosinophils during approximately 2 years of follow-up. These results differ from those of the EGEA study [15], which conducted analyses of blood granulocytes in 242 patients with asthma, having two measurements 12 years apart.In that study, in which patients were separated into two groups: (high and low eosinophil patterns), according to an eosinophil count cut-off point of 250/mm 3; the study found that 52% of patients with asthma showed a similar profile 12 years after the first evaluation. The different cut-off level and the different time intervals between measurements of eosinophil count may explain the differences observed between the EGEA and the COBRA cohorts.
The stability of phenotype based on eosinophilic pattern was also explored in the longitudinal cohort, BIOAIR [14], which included 169 patients with asthma, 93 of whom had severe asthma. Among these patients with asthma, only 80 with severe and 58 with mild asthma completed 1 year of the follow-up study. In the BIOAIR cohort, 48.6% of the patients changed allocation, depending on the number of sputum eosinophils [14].
Our current results have an important clinical impact as blood eosinophils have been proposed as a biological biomarker to personalise immunological biotherapies and to target severe asthma with elevated blood eosinophils for treatment with anti-interleukin-5 (anti-IL-5) antibodies [6]. Interestingly, we found that the proportion of patients with stable eosinophilia was markedly influenced by the GINA step at inclusion. Indeed, approximately 60% of the patients in GINA groups 1–3 who had low/mild eosinophil count at inclusion had stable eosinophilia over time, whereas 70% of the patients with high eosinophil count in GINA groups 4–5 remained stable.
This suggests that an eosinophil cut-off of 300 mm−3is a more reliable biomarker than a lower one to guide the prescription of an anti-IL-5 monoclonal antibody in patients with severe asthma (GINA 5). It should be noted that the rate of patients with severe asthma in the COBRA cohort who shifted from GINA 4–5 to GINA 1–3 after 12 months follow-up was low, amounting to 16%.
Finally, we found that the eosinophil count and an increase in the number of eosinophils during follow-up were predictive of the occurrence of exacerbations and loss of asthma control. In the EGEA study [26], changes in eosinophilic profiles between the two evaluation points 12 years apart were unrelated to asthma control. As stated above, these discrepancies may originate from the differences in the eosinophil thresholds,duration of follow-up and frequency of eosinophil measurement used in the two studies. Several confounding factors, particularly changes in medications, may have a potential influence on phenotype stability and on blood eosinophil count. In the BIOAIR cohort [14], the rate of sputum eosinophils was not influenced by changes in the dose of ICS. The same observation was reported in our cohort for the 26 patients with severe asthma who were on OCS during the follow-up period [14]. However,the relationship between blood and sputum eosinophils is not clearly established,and in a recent study, blood eosinophil counts were poor predictors of sputum eosinophil percentages[28]. This was confirmed by a recent systematic review and meta-analysis [29], in which the sensitivity of blood eosinophils for detecting sputum eosinophils of 3% or more and 2% or more was low, ranging from 0.52 to 0.77.
In a sub-analysis conducted in a small group of patients with severe asthma on maintenance use of OCS, we also demonstrated that the decrease in blood eosinophil count significantly correlated with the daily dose of OCS. This finding underlines the importance of considering a treatment and the dose of OCS when using blood eosinophil count as a biomarker to prescribe a biotherapy,such as an anti-IL-5. In conclusion, deciphering severe asthma phenotypes based on clinical, physiological and biological variables remains an important challenge, especially in view of the availability of novel targeted biotherapies [30]. The COBRA cohort has been successful in recruiting a large number of patients, particularly patients with severe asthma with similar characteristics as those previously reported in other cohorts. COBRA, which to our knowledge is one of the largest longitudinal cohorts identified, will be a
useful tool to better characterise different asthma phenotypes and to identify associated biomarkers, as well as their stability over time.
Acknowledgements
We thank the patients who made this study possible and the Investissement d’Avenir - Program ANR-11-IDEX-0005-02,
Laboratoire d’Excellence, INFLAMEX.
The investigators and contributors of the COBRA cohort Study Group are as follows: M. Aubier (coordinator), B. Crestani, C. Taillé, M.C. Dombret and M. Pretolani (all from Inserm UMR1152 and Bichat-Claude Bernard University Hospital, Paris); P. Berger (Inserm UMR 1045, University Hospital, Bordeaux), A. Bourdin, I. Vachier and N. Molinari (University Hospital, Montpellier); P. Chanez (St.Marguerite University Hospital, Marseille); T. Similowski (Inserm UMR1158, La Pitié Salpétriêtre University Hospital, Paris); A. Didier (University Hospital, Toulouse); F. De Blay (University Hospital, Strasbourg); M. Humbert and G. Garcia (Inserm UMR999, University Hospital Bicêtre, Clamart), A. Magnan (Inserm UMR915, University Hospital, Institut du Thorax, Nantes);B. Maitre (Inserm UMR 955, University Hospital, Mondor-Créteil); N. Roche (University Hospital Cochin-Broca-Hôtel Dieu, Paris); A. Tsicopoulos and C. Chenivesse (Inserm UMR1019, University Hospital, Lille), G. Deslée (Maison Blanche University Hospital, Reims;CH Marquette (Pasteur University Hospital,Nice); G Devouassoux (Croix Rousse University Hospital,Lyon).
Third parties contributing to the study include Clinical Investigation Centre (CIC), and Biological Resource Centre (CRB), both at the Bichat hospital,Paris,and LaSer Analytica,Paris,France.
References
1 BousquetJ, Mantzouranis E,Cruz AA, et al. Uniform definition ofasthma severity,control, and exacerbations:
document presented for the World Health Organization Consultation on Severe Asthma.J Allergy Clin Immunol 2010;126: 926–938.
2 Haldar P, Pavord ID, Shaw DE,et al. Cluster analysis and clinical asthma phenotypes. Am J Respir Crit Care Med 2008;178: 218–224.
3 Levine SJ,Wenzel SE.Narrative review:the role of Th2 immune pathway modulation in the treatment of severe asthma and its phenotypes.Ann Intern Med 2010; 152:232–237.
4 Wenzel SE.Asthma phenotypes:the evolution from clinical to molecular approaches.Nat Med 2012;18: 716–725. 5 Gauthier M, Ray A, Wenzel SE.Evolving concepts of asthma. Am J Respir Crit Care Med 2015;192: 660–668. 6 Fahy J. Identifying clinical phenotypes of asthma:steps in the right direction. Am J Respir Crit Care Med 2010;
181: 296–297.
7 Hanania NA, Wenzel S, Rosén K, et al. Exploring the effects of omalizumab in allergic asthma: an analysis of biomarkers in the EXTRA study.Am J Respir Crit Care Med 2013;187: 804–811.
8 Nair P, Pizzichini MM, Kjarsgaard M. Mepolizumab for prednisone-dependent asthma with sputum eosinophilia. N Engl J Med 2009;360:985–993.
9 Pavord ID, Korn S, Howarth P, et al. Mepolizumab for severe eosinophilic asthma (DREAM): a multicentre, double-blind, placebo-controlled trial.Lancet 2012;380:651–659.
10 Castro M, Mathur S, Hargreave F,et al. Reslizumab for poorly controlled, eosinophilic asthma: a randomized, placebo-controlled study.Am J Respir Crit Care Med 2011;184: 1125–1132.
11 Kupczyk M, Wenzel S. U.S. and European severe asthma cohorts: what can they teach us about severe asthma? J Intern Med 2012;272:121–132.
12 Jarjour NN, Erzurum SC, Bleecker ER,et al. NHLBI Severe Asthma Research Program (SARP).Severe asthma: lessons learned from the National Heart,Lung, and Blood Institute Severe Asthma Research Program. Am J Respir Crit Care Med 2012;185:356–362.
13 Kupczyk M, Haque S,Sterk PJ,et al. Detection of exacerbations in asthma based on electronic diary data:results from the 1-year prospective BIOAIR study.Thorax 2013;68: 611–618.
14 Kupczyk M, Dahlén B, Sterk PJ,et al. Stability of phenotypes defined by physiological variables and biomarkers in adults with asthma.Allergy 2014;69: 1198–1204.
15 Nadif R, Siroux V, Boudier A, et al. Blood granulocyte patterns as predictors of asthma phenotypes in adults from the EGEA study.Eur Respir J 2016;48: 1040–1051.
16 Shaw DE, Sousa AR, Fowler SJ, et al. Clinical and inflammatory characteristics of the European U-BIOPRED adult severe asthma cohort. Eur Respir J 2015; 46: 1308–1321.
17 Global Initiative for Asthma (GINA). GINA report, global strategy for asthma management and prevention. Updated 2014 and 2015.
18 Juniper EF, O’Byrne PM, Guyatt GH, et al. Development and validation of a questionnaire to measure asthma control. Eur Respir J 1999;14: 902–907.
19 The ENFUMOSA cross-sectionalEuropean multicentre study of the clinical phenotype of chronic severe asthma. Eur Respir J 2003;22: 470–477.
20 Moore WC, Bleecker ER, Curran-Everett D, et al. Characterization of the severeasthma phenotype by the National Heart, Lung, and Blood Institute’s Severe Asthma Research Program.J Allergy Clin Immunol 2007; 119: 405–413.
21 Ronmark E, Andersson C, Nystrom L, et al. Obesity increases the risk of incident asthma among adults. Eur Respir J 2005; 25: 282–288.
22 Kauppi P, Linna M, Jantunen J, et al. Chronic comorbidities contribute to the burden and costs of persistent asthma.Mediators Inflamm 2015;2015:1–7.
23 Fulkerson PC,Rothenberg ME. Targeting eosinophils in allergy,inflammation and beyond. Nat Rev Drug Discov 2013;12: 117–129.
24 Katz LE, Gleich GJ,Hartley BF, et al. Blood eosinophil count is a useful biomarker to identify patients with severe eosinophilic asthma.Ann Am Thorac Soc 2014;11: 531–536.
25 Tran TN, Khatry DB, Ke X, et al. High blood eosinophil count is associated with more frequent asthma attacks in
26 Price DB, Rigazio A, Campbell JD,et al. Blood eosinophil count and prospective annual asthma disease burden: a UK cohort study. Lancet Respir Med 2015; 3: 849–858.
27 Schleich FN, Chevrempnt A, Paulus V, et al. Importance of concomitant and systemic eosinophilia in uncontrolled asthma.Eur Respir J 2014;44: 97–108.
28 Hastie AT, Moore WC, Li H, et al. Biomarker surrogatesdo not accurately predict sputum eosinophil and neutrophil percentages in asthmatic subjects. J Allergy Clin Immunol 2013;132:72–80.
29 Korevaar DA, Westerhof GA, Wang J, et al. Diagnostic accuracy ofminimally invasive markers for detection of airway eosinophilia in asthma:a systematic review and meta-analysis.Lancet Respir Med 2015; 3: 290–300. 30 Chung KF. Asthma phenotyping: a necessity for improved therapeutic precision and new targeted therapies.