HAL Id: hal-02271506
https://hal.archives-ouvertes.fr/hal-02271506
Submitted on 26 Aug 2019
HAL is a multi-disciplinary open access
archive for the deposit and dissemination of
sci-entific research documents, whether they are
pub-lished or not. The documents may come from
teaching and research institutions in France or
abroad, or from public or private research centers.
L’archive ouverte pluridisciplinaire HAL, est
destinée au dépôt et à la diffusion de documents
scientifiques de niveau recherche, publiés ou non,
émanant des établissements d’enseignement et de
recherche français ou étrangers, des laboratoires
publics ou privés.
Probing Polarity and Heterogeneity of Lipid Droplets in
Live Cells Using a Push–Pull Fluorophore
Mayeul Collot, Sophie Bou, Tkhe Kyong Fam, Ludovic Richert, Yves Mely,
Lydia Danglot, Andrey Klymchenko
To cite this version:
Mayeul Collot, Sophie Bou, Tkhe Kyong Fam, Ludovic Richert, Yves Mely, et al.. Probing
Polar-ity and HeterogenePolar-ity of Lipid Droplets in Live Cells Using a Push–Pull Fluorophore. Analytical
Chemistry, American Chemical Society, 2019, 91 (3), pp.1928-1935. �10.1021/acs.analchem.8b04218�.
�hal-02271506�
Probing Polarity and Heterogeneity of Lipid Droplets in Live Cells
Using a Push-Pull Fluorophore
Mayeul Collot,
a* Sophie Bou,
aTkhe Kyong Fam,
aLudovic Richert,
aYves Mély,
aLydia Danglot,
b cAn-drey S. Klymchenko
aa. Laboratoire de Biophotonique et Pathologies, UMR 7021 CNRS, Université de Strasbourg, Faculté de Pharmacie, 74, Route du Rhin, 67401 ILLKIRCH Cedex, France.
b. University Paris Diderot, Sorbonne Paris Cité, Institut Jacques Monod, CNRS UMR 7592, 75013 Paris, France
c. INSERM U894, Institute of Psychiatry and Neuroscience of Paris, Membrane Traffic in Healthy and Diseased Brain, 102 rue de la Santé, 75 014 PARIS.
ABSTRACT: Lipid droplets (LDs) are organelles composed of a lipid core surrounded by a phospholipid monolayer. Lately, LDs attracted a considerable attention due to recent studies demonstrating their role in a variety of physiological processes as well as diseases. Herein we synthesized a push-pull molecule named DAF (Dimethyl Aniline Furaldehyde) that possesses a strong positive solvatochromism in emission of 119 nm from toluene to methanol. Its impressive fluorogenic properties from water to oil (2000-fold) as well as its high quantum yields (up to 0.97) led us to investigate its ability to sense the distribution of polarity in live cells by fluorescence ratiometric imaging. When added to live cells and excited at 405 nm, DAF immediately and brightly stain lipid droplets using a blue channel (410-500 nm) and cytoplasm in a red channel (500-600 nm). DAF also proved to be compatible with fixation thus allowing 3D imaging of LDs in their cytoplasm environment. Taking advantage of DAF emission in two distinct channels, ratiometric imaging was successfully performed and led to the polarity mapping of the cell unraveling some heterogeneity in polarity within LDs of the same cell.
KEYWORDS. Lipid Droplets, Environment Sensitive Fluorescent Probe, Multicolor Fluorescent imaging, Ratiometric Imag-ing.
Lipid droplets (LDs) are organelles found in almost all organ-isms from prokaryotes to humans.1, 2 They are composed of an
oily core containing metabolic lipids, mainly triglycerides and cholesterol esters, coated with a phospholipid monolayer membrane in which proteins are anchored.3, 4 Much more than
simple lipid storages playing a role in metabolism,5,6, 7 LDs
were recently found to be involved in various physiological processes including membrane trafficking,8, 9 protein storage10
and inflammation.11 Additionally, LDs have been shown to
play important role in diseases12 such as neurodegeneration,13
obesity, diabetes and atherosclerosis,14 viral replication15 and
cancer.16, 17, 18 Although several conserved functions have been
reported in the literature,19 recent studies tend to show that
LDs’ number, size and composition can greatly vary.202122
Therefore, imaging of LDs and studying their dynamic com-position is of prior importance to understand their involvement in biological mechanisms. Recently, considerable efforts have been done to develop efficient molecular fluorescent probes for bioimaging.23 24 Among them, fluorogenic probes offers
background free images due to the fact that they only emit once they reached their target.25, 26, 27, 28
Although efficient probes are available in multiple colors for different organelles,29 LDs probes must be improved as the
most commonly used ones, namely BODIPY 493/50329 and
Nile Red30 showed some limitations in long-term multicolor
imaging due their limited photostability and broad emission peak respectively.31
To address this issue continuous effort are being made to de-velop new efficient LDs probes32 based on push-pull33 or
ag-gregation induced emission (AIE) fluorophores.34, 35, 36 We also
recently introduced a family of efficient fluorogenic LD mark-ers emitting from yellow to near infrared called StatoMerocy-anines (SMCy) that successfully served in cell and tissue im-aging using mono- or two-photon excitation imim-aging.31 In
order to complete the available palette of color, blue emitting LDs markers have recently been reported.37,38,39,40 Although
they showed good selectivity and despite an example where two-photon excitation was used,35 their brightness in imaging
are quite limited due to their UV shifted excitation spectra and quite low molar absorption coefficients, thus leading to low excitation efficiency using the common 405 nm laser. Except one example where a near infrared fluorophores served to visualize the most viscous LDs,41 LDs probes being able to
report their environment such as composition or polarity using fluorescence imaging have not yet been reported. Solvato-chromic dyes display different emission wavelengths depend-ing on their environment’s polarity.42 By means of chemical
pyrene,44 and fluorene45 were successfully used to selectively
probe polarity of the plasma membrane and/or intracellular membranes respectively, using ratiometric imaging.
Herein we developed a push-pull fluorophore, Dimethyl Ani-line Furaldehyde (DAF) that displayed positive solvato-chromic properties in emission. In live or fixed cells imaging, DAF is efficiently excited with the widely used 405 nm laser and stained LDs leading to background free images due to its impressive fluorogenic effect from water to oil. Although DAF showed a lower photostability compared to BODIPY 493/503 and thus was not suitable for long-term live imaging, it was successfully used in multicolor imaging with no cross-talk as it is only excited by the 405 nm laser. Taking ad-vantage of its solvatochromism, ratiometric imaging has been performed unraveling differences of polarity in the LDs popu-lation.
Experimental section
Synthesis. All starting materials for synthesis were purchased from Alfa Aesar, Sigma Aldrich or TCI Europe and used as received unless stated otherwise. NMR spectra were recorded on a Bruker Avance III 400 MHz spectrometer. Mass spectra were obtained using an Agilent Q-TOF 6520 mass spectrome-ter. Synthesis and characterization of DAF is described in sup-porting information.
Spectroscopy. The water used for spectroscopy was Milli-Q water (Millipore), all the solvents were spectroscopic grade. Labrafac® (Labrafac Lipophile WL 1349) is composed of medium chains tiglycerides, caprylic/capric triglyceride and was obtained from Gattefossé (Saint Priest, France). Absorp-tion and emission spectra were recorded on a Cary 400 Scan ultraviolet–visible spectrophotometer (Varian) and a Fluoro-Max-4 spectrofluorometer (Horiba Jobin Yvon) equipped with a thermostated cell compartment, respectively. For standard recording of fluorescence spectra, the emission was collected 10 nm after the excitation wavelength. All the spectra were corrected from wavelength-dependent response of the detec-tor. Quantum yields were determined by comparison with coumarine 7-(diethylamino) 3-carboxylic acid in water (= 0.03) as a reference.46 Time-resolved fluorescence
measure-ments were performed with the time-correlated, single-photon counting technique using the excitation pulses at 405 nm pro-vided by a pulse-picked supercontinuum laser (EXR-20, NKT Photonics) equipped with an UV extension (SuperK EXTEND-UV). The emission was collected through a polariz-er set at the magic angle and an 8 nm band-pass monochroma-tor (H10, Jobin-Yvon) at the maximum of fluorophore emis-sion. The instrumental response function was recorded with a polished aluminium reflector, and its full-width at half-maximum was 50 ps. Time-resolved intensity data were treat-ed with an analysis using a Matlab home-made software bastreat-ed of Tcspcfit47 and the Maximum Entropy Method (MEM).48 In
all cases, the χ² values were close to 1, and the weighted resid-uals as well as the autocorrelation of the residresid-uals were dis-tributed randomly around 0, indicating an optimal fit.
Cytotoxicity. Cytotoxicity of the DAF was evaluated by MTT assay (3-(4,5-dimethylthiazol-2-yl)-2,5-diphenyltetrazolium bromide). A total of 1x104 KB cells/well were seeded in a 96-well plate 18 h prior to the experiment in Dulbecco’s Modified Eagle Medium (Gibco Lifetechnologies -DMEM) comple-mented with 10% fetal bovine serum, Gentamicin (100 µg/mL), L-Glutamine (2 mM), non-essential amino acids (1
mM), MEM vitamin solution (1%) and were incubated in a 5% CO2 incubator at 37°C. After medium removal, an amount of 100 µL DMEM containing 20 µM, 5 µM, 1 µM or 0.2 µM of DAF was added to the KB cells and incubated for 1 h at 37°C (5% CO2). As control, the cells were incubated with
DMEM containing the same percentage of DMSO (0.5% v/v) as the solution of DAF or with triton 0.1% as a positive con-trol of cytotoxicity. After 1h of dye incubation, the medium was replaced by 100 µL of MTT solution in DMEM and the cells were incubated for 3 h at 37°C. Then, 75 µL of the solu-tion was replaced by 50 µL of DMSO (100%) and gently shaken for 15 min at room temperature. The absorbance at 540 nm was measured. Each concentration of dye was tested in sextuplicate in 3 independent assays. For each concentration, we calculated the percentage of cell viability in reference of the control DMEM+ 0.5% DMSO as 0 µM of DAF.
Confocal imaging. KB cells (ATCC® CCL-17) were grown in minimum essential medium (MEM, Gibco-Invitrogen) with 10% fetal bovine serum (FBS, Lonza), 1% non-essential ami-no acids (Gibco-Invitrogen), 1% MEM vitamin solution (Gib-co-Invitrogen), 1% L-Glutamine (Sigma Aldrich) and 0.1% antibiotic solution (gentamicin, Sigma-Aldrich) at 37 C in humidified atmosphere containing 5% CO2. Cells were seeded
onto a chambered coverglass (IBiDi®) at a density of 5104
cells/well 24 h before the microscopy measurement. For imag-ing, the culture medium was removed and the attached cells were washed with Opti-MEM (Gibco–Invitrogen). The live cells were stained with DAF (2 m) prior to imaging and were imaged without any washing steps. Fixed cells were fixed with PFA (4%) and were washed three times with HBSS and visu-alized in HBSS. The images were processed with Icy soft-ware.49 The plasma membrane was stained with dSQ12S (200
nM) prior to imaging.50 Mitotracker Green FM was purchased
from ThermoFisher scientific.29 The correlation studies were
performed on several cells from different acquisitions. Lipid droplet were segmented with spot detector plugin (scale 2, sensitivity 40). Colocalization analysis was performed using Icy SODA plugin (Standard Object Distance Analysis)51 that
gives both coupling proportion, colocalization map and LD size. Ratiometric images were obtained using Intensity Color Version 2.5 plugin in ImageJ software.
Results and discussion
Synthesis
Scheme 1. Synthesis of DAF
As a push-pull molecule, DAF was designed as a donor- -acceptor system where the aniline’s nitrogen is the electron donor moiety, the aniline and furan constitute the -conjugated system and the aldehyde acts as an electron acceptor (Scheme 1). DAF was synthesized in one step by Suzuki coupling be-tween 4-bromo-diethylaniline and furaldehyde boronic acid and was fully characterized by 1H and 13C NMR as well as
high-resolution mass spectroscopy (Supplementary Infor-mation).
Spectroscopic studies
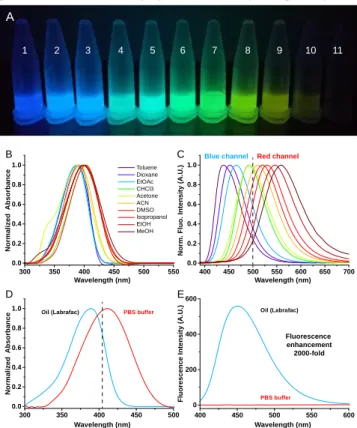
The photo-physical properties of DAF were then studied in various organic solvents with increasing polarity. When excit-ed by a UV lamp (365 nm) the solutions of DAF emittexcit-ed light in the visible range from deep blue to yellow (Figure 1A). Although absorption spectra showed only a slight batho-chromic shift (Figure 1B), emission spectra displayed an strong positive solvatochromism from toluene (439 nm) to methanol (558 nm) representing a 119 nm bathochromic shift (Figure 1C) which is in accordance with structurally close reported fluorophores.52, 53Additionally, DAF showed a linear
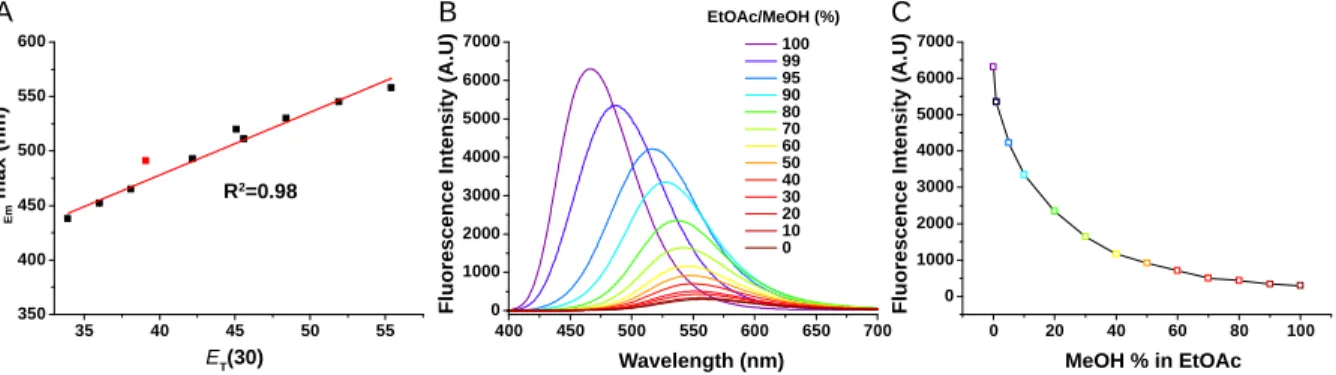
relationship between its maximum emission wavelength and the solvent polarity with a slope of 5.7 nm per ET(30) unit
(Figure 2A). Interestingly, whereas DAF is efficiently excited by the commonly used 405 nm laser (lowest: 70% efficiency), it is virtually non-excitable by common light sources dedicated to the green channels, typically 488 nm. These features are important as regardless its environment, DAF will only emit when excited with a short wavelength laser thus avoiding cross talk phenomenon in multicolor imaging. Importantly, DAF possesses quite high molar absorption coefficients (~40,000 M-1.cm-1) and can reach impressive quantum yields
up to 0.97 (Table 1), making it a relatively bright blue LDs probe.32 When solubilized in PBS, DAF displays a broader
spectrum than in organic solvents (Figure 1D) with a signifi-cantly reduced molar absorption coefficient (See table 1). Table 1. Photo-physical properties of DAF (1 μM) in vari-ous solvents.
a E
T(30) is the molar transition energy expressed in kcal.mol-1
and is a solvent polarity parameter.42
b Quantum yields were measured using coumarin
7-(diethylamino)-3-carboxylic Acid in water (= 0.03) as a refer-ence.46
c Full width at half maximum emission spectrum
d Labrafac™ was used (medium chain triglycerides)
Consequently DAF was found to be non-emissive in water (Figure 1A and E). As lipid droplets are mainly composed of triglyceride we studied the behavior of DAF in labrafac™, oil composed of medium chain triglycerides. In this oil DAF effi-ciently absorbs light at 390 nm (= 43,000 M-1.cm-1) and emits
in the blue region at 450 nm with a good quantum yield (0.74), thus representing a 2000-fold fluorescence enhancement from PBS to oil. In order to illustrate the environment sensitivity of DAF, it was placed in various EtOAc/MeOH ratios. From
EtOAc to MeOH, emission spectra quickly shift to the red (Figure 2B) with an exponential decay of fluorescence intensi-ty (Figure 2C). It is noteworthy that only 10% of MeOH was sufficient to decrease its maximum fluorescence intensity by half (Figure 2C). As lipid media contained in the LDs can be highly viscous,41 the influence of this parameter on DAF was
assessed using methanol-glycerol mixtures with increasing viscosity (Figure S1). From low viscosity value (0.6 mPa.s) to high one (1317 mPa.s), the fluorescence enhancement was only 1.6-fold showing a rather low sensitivity of DAF towards the viscosity. Altogether these results show that, in addition to typical twisted intramolecular charge transfer (TICT) observed for push pull fluorophores,54 DAF could be quenched in polar
protic media by other mechanisms, such as electron transfer and H-bonding with the solvent.55 Lifetime measurements
were in line with these hypotheses as the obtained values ranged from 1.71 ns to 3.02 ns in aprotic solvents with in-creasing polarity whereas in ethanol a lower value of 1.29 ns was obtained (Figure S2). Overall, efficient fluorogenic prop-erties displaying an impressive fluorescence enhancement from PBS to oil combined with a high environment sensitivity, makes DAF a promising candidate as blue fluorescent LDs probe for multicolor imaging and for sensing LDs polarity.
Figure 1. (A) Picture of DAF solutions in various solvents under UV lamp excitation (365 nm): Toluene (1), dioxane (2), EtOAc (3), CHCl3 (4), acetone (5), ACN (6), DMSO (7), isopropanol (8),
EtOH (9), MeOH (10) and PBS (11). Normalized absorbance (B) and emission spectra (C) of DAF in various organic solvents with increasing polarity. Normalized absorption (D) and emission spectra (E) of DAF in PBS buffer and in oil (labrafac) showing the impressive fluorogenic effect. Dashed Concentration of DAF was 1 μM. Excitation wavelength was 380 nm.
Solvent ET(30)a λAbs max (nm) λEm max (nm) ε (M-1.cm-1) f b FWHMc (nm) Toluene 33.9 392 439 36,000 0.79 62 oild N/A 390 450 43,000 0.74 72 Dioxane 36 388 452 40,000 0.19 71 EtOAc 38.1 386 465 44,000 0.17 67 CHCl3 39.1 403 491 40,500 0.85 66 Acetone 42.2 389 493 40,000 0.64 75 ACN 45.6 392 511 39,500 0.75 79 DMSO 45.1 403 520 34,500 0.97 79 Isopropanol 48.4 398 530 37,500 0.57 80 EtOH 51.9 398 545 39,000 0.26 87 MeOH 55.4 400 558 37,500 0.06 94 PBS 63.1 411 N/A 19,500 N/A N/A
300 350 400 450 500 0.0 0.2 0.4 0.6 0.8 1.0 300 350 400 450 500 550 0.0 0.2 0.4 0.6 0.8 1.0 400 450 500 550 600 650 700 0.0 0.2 0.4 0.6 0.8 1.0 400 450 500 550 600 0 200 400 600 Toluene Dioxane EtOAc CHCl3 Acetone ACN DMSO Isopropanol EtOH MeOH N o rm a li z e d A b s o rb a n c e N o rm a li z e d A b s o rb a n c e N o rm . F lu o . In te n s it y ( A .U .) F lu o re s c e n c e I n te n s it y ( A .U .)
Oil (Labrafac) PBS buffer Oil (Labrafac)
PBS buffer Fluorescence enhancement 2000-fold B C D E
Blue channel Red channel
Wavelength (nm) Wavelength (nm)
Wavelength (nm) Wavelength (nm)
A
Figure 2. Solvatochromic and fluorogenic properties of DAF. Linear relationship between the maximum emission wavelength and the
solvent’s polarity (A). Chloroform was excluded from the fit as other parameters might interfere.56
Emission spectra of DAF in various EtOAc/MeOH ratios (B) and its exponential decay of fluorescence intensity denoting fluorogenic properties (C). Concentration of DAF was 1 μM. Excitation wavelength was 380 nm.
Cellular imaging
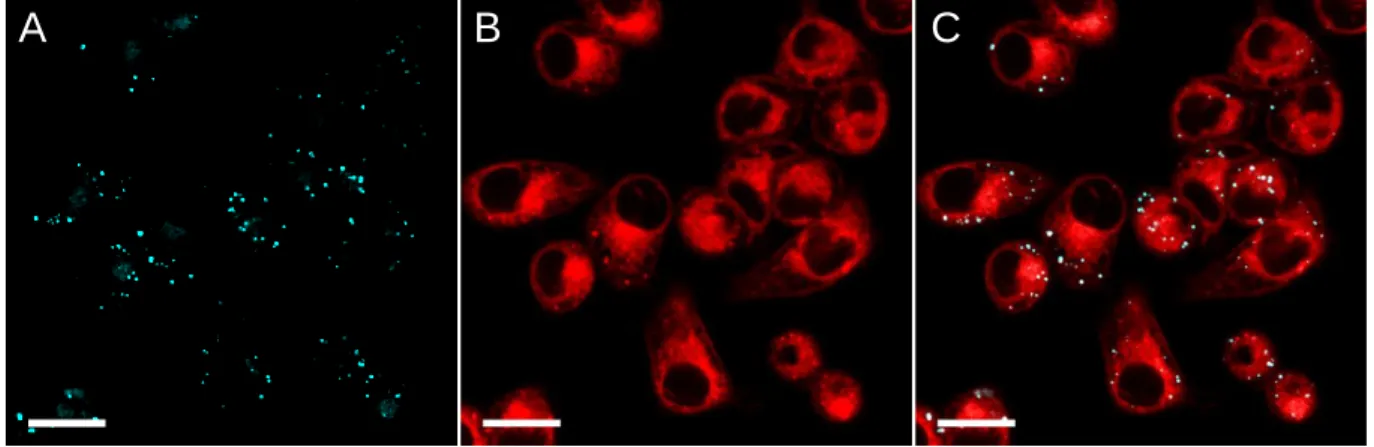
As a first experiment we checked the cytotoxicity of DAF and showed that it did not affect the cell viability after 1h incuba-tion at concentraincuba-tions up to 20 M (Figure S3). DAF was then added to live KB cells (HeLa cells derivatives) at a concentra-tion of 2 M. Laser scanning confocal imaging revealed that DAF immediately and brightly stained LDs (Figure 3A) using a 405 nm laser source and collecting the emission in a “blue channel” (415-480 nm). Additionally, using the same excita-tion source and collecting the emitted light in a second “red channel” (500-600 nm), DAF stained the cytoplasm (Figure 3B). These experiments showed that DAF possesses both ad-vantages of BODIPY 493/503 and Nile Red without their drawbacks. Indeed similarly to BODIPY 493/503, DAF im-mediately penetrates the cells and stains LDs. However we recently showed that BODIPY 493/503 has a quantitative quantum yield in water31 whereas DAF is non-emissive
(Fig-ure 1E) thus leading to images with significantly reduced background noise compared to BODIPY 493/503. As solvato-chromic dyes DAF and Nile Red can both report LDs and cytoplasmic membranes using two emission channels (Figure 3C). However, due to its blue shifted excitation, DAF is only excitable with the 405 nm laser whereas Nile Red, due to its red shifted and broad absorption and emission spectra is prone to cross-talk.31 In situ emission spectra of DAF in various
re-gion of the cells were then performed and showed that two main peaks could be observed (Figure S4). In LDs, DAF emits at 440 nm with a quite sharp band (FWHM = 56 nm), showing that it is in very low polar environment (polarity similar to toluene, see table 1). In the cytoplasm, DAF emit in a broader manner with a peak at 510 nm. In order to assign this peak more precisely, we placed DAF in an aqueous solution of a protein (BSA). The results showed that DAF interacts with BSA and emits at 518 nm, a value close to the one measured in situ in the cytoplasm (Figure S5). This similarity led us to
think that DAF might interact with the hydrophobic sites of proteins of the cytoplasm. Interestingly, when cells were im-aged at different times of incubation, it was noteworthy that whereas the LDs could be detected with no apparent lost of signal, the staining of the cytoplasm in the red channel de-creased over the time probably denoting a slow accumulation of the dye from the cytoplasm to the LDs (Figure S6).
At this point, after verifying that cross-talk did not occurred (Figure S7), we checked whether DAF colocalized with BODIPY 493/503 (Figure 4). First, it was noteworthy that DAF and BODIPY 493/503 displayed significant difference in their intensity within the LDs (Figure 4C). Conventional Pear-son coefficient analysis gave a value of 0.6995 ± 0.0154 indi-cating rather good, though not complete correlation between DAF and BDP intensity (Figure S8). In order to further study this observation, we used a recently developed colocalization technique based on mass center colocalization (see details in the SI).51 59% of DAF positive LDs (n= 755) were found to be
associated with BODIPY 493/503, and conversely 62% of BODIPY 493/503 positive LD (n=729) were associated to DAF. This association was statistically highly significant (p value 10-216) and is depicted as yellow spots on figure 4D.
Very interestingly, this study showed that DAF stained LDs that BODIPY 493/503 could not detect and vice versa (Figure 4D, green and red spots). These data tend to show that DAF and BODIPY 493/503 are complementary LDs markers and might be used in combination in order to unravel a larger pop-ulation of LDs. Moreover we showed that LDs only positive for DAF or BODIPY have the same pixel size distribution (Figure S9), whereas LDs positive for both markers (DAF and BODIPY) are bigger (p<0,0001) than those labeled with only one marker (See figure S9). These results question the univer-sality of BODIPY 493/503 as a LDs marker and provides new evidences of LDs’ heterogeneity.57, 58 35 40 45 50 55 350 400 450 500 550 600 0 1000 2000 3000 4000 5000 6000 7000 0 20 40 60 80 100 B C
Linear Fit of Sheet1 B"Lambda Em"
Eq ua tio n y = a + b*x Plo t L a mb d a Em W e igh t N o W e ig h tin g Inte r c e pt 2 4 7.4 7 10 1± 14.0 Slo p e 5 .7 6 0 8 7± 0.3159 R e s idu a l Su m o f Squ 29 3 .13 0 4 3 Pe ar s o n 's r 0.9 8 96 4 R - Sq u a r e ( C O D ) 0.9 7 93 8 Ad j. R - Sq ua r e 0.9 7 64 3 400 450 500 550 600 650 700 0 1000 2000 3000 4000 5000 6000 7000 100 99 95 90 80 70 60 50 40 30 20 10 0 EtOAc/MeOH (%) F lu o re s c e n c e I n te n s it y ( A .U ) F lu o re s c e n c e I n te n s it y ( A .U ) lEm m a x ( n m )
ET(30) Wavelength (nm) MeOH % in EtOAc
R2=0.98
Figure 3. Laser scanning confocal images of live KB cells stained with DAF (2 μM). (A) Blue channel: λEx= 405 nm, Em: 415-480 nm. (B) Red channel: λEx= 405 nm, Em: 500-600 nm. (C) is the merge of the blue and red channels. DAF was added prior to imaging. No washing steps were performed. Scale bar is 20 μm.
Figure 4. Colocalization experiments. KB cells were stained with DAF (2 M) Ex= 405 nm, Em: 415-480 nm (A) and BODIPY
493/503 (200 nM) Ex= 488 nm, Em: 495-550 nm (B). (C) is the
merge of A and B. (D) is the composite picture of the segmented fluorescent spots identified with Icy SODA colocalization analy-sis plugin. Localization of DAF spots was analyzed in respect with BODIPY staining. Green spots are the DAF isolated spots found without BODIPY, yellow spots are the DAF spots associat-ed with BODIPY staining, rassociat-ed ones are the BODIPY spots found alone. Scale bar is 10 µm.
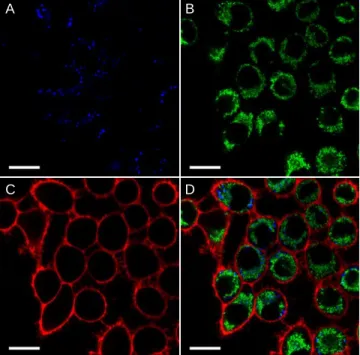
Taking advantage of these features, DAF was first involved in multicolor cellular imaging (Figure 5). LDs were stained with DAF, excited at 405 nm and the emission was only collected in the blue channel. Mitochondria were stained with Mito-tracker green FM using 488-nm excitation and displayed no cross-talk with DAF as the latter is not excitable at this wave-length (see figure 1B). Finally, the plasma membrane was stained with dSQ12S50 using 635 nm excitation. While these
imaging experiments were performed without any washing step, the different organelles were distinctly revealed by its
corresponding color with virtually no background signal (Fig-ure 5D).
DAF was then challenged in fixed cells. KB cells were stained with DAF and subsequently fixed. The cells were then imaged by laser scanning confocal microscopy and images were ac-quired at increasing heights (Z-Stack experiment) using 405 nm laser as single excitation source and collecting the fluores-cence signals in the two distinct channels (blue: 415-480 nm and red: 500-600 nm). Although the photostability of DAF was found to be lower compared to BODPY 493/503 (Figure S10) and fixation seemed to lower the brightness of DAF compared to live cell imaging, it was shown to be sufficiently bright and photostable over the required 67 successive acquisi-tions to provide good quality images (Figure S11). Conse-quently, maximum projection of the obtained images as well a 3D reconstruction unraveled LDs in their cytoplasmic envi-ronment (Figure S12). These results showed that, owing to its solvatochromism, DAF enables imaging LDs and the cyto-plasm with only one excitation source without blocking the remaining channels that use other excitation sources such as 488 nm, 530, 560 and 630 nm.
Figure 5. Multicolor imaging of live KB cells using DAF as a blue emitting LDs marker. A is blue channel: DAF (2 μM), λEx= 405 nm, Em: 415-480 nm. B is green channel: Mito tracker Green FM (200 nM), λEx= 488 nm, Em: 495-550 nm. C is red channel dSQ12S (200 nM), λEx= 635 nm Em: 645-750 nm. D is the merge of the 3 channels. Unlike Mito tracker, which was incubat-ed for 1 h, DAF and dSQ12S were addincubat-ed just before imaging. No washing steps were performed. Scale bar is 20 μm.
Finally, taking advantage of the solvatochromism properties of DAF, we investigated its ability to probe the difference in
polarity within the LDs using ratiometric imaging. To do so, the signal of the red channel (Figure 6B) was divided by the signal of the blue channel (Figure 6A) thus providing rati-ometric image that maps the polarity of the cytoplasm and the LDs (Figure 6C). These images indicated that the cytoplasm displayed the highest polarity (ratio value 3.0) with a high homogeneity. As a comparison a solution of DAF in pure eth-anol was imaged using the same parameters and provided a similar ratio color indicating that the labeled cytoplasm exhib-its rather high polarity that could be assigned to water exposed binding sites of intracellular proteins (Figure 6D). Conversely, LDs displayed significantly lower polarities with an increasing gradient from their core to the surface. Remarkably, the core composed of triglycerides and cholesterol esters displayed the lowest polarity (ratio value between 0.6 and 1) comparable to the one obtained when DAF in pure oil was imaged (Figure 6F). The difference between the core and the surface of LDs could be explained, on one hand, by polarity gradient within the LDs, where the water exposed membrane should be much more polar than the lipid core. On the hand, the size of drop-lets is close to the diffraction-limited resolution of the confo-cal microscope. Therefore, we could also explain higher val-ues of the red/blue ratio at the edges of LDs as a superposition of signal coming from the lipid core (low ratio values) and the cytoplasm (high ratio values). Dedicated super resolution mi-croscopy studies using stimulated emission depletion STED, structured illumination microscopy SIM59 or dSTORM60 will
be needed in order to better understand the distribution of po-larity within the same LD. Moreover, figure 6E revealed a heterogeneity in polarity observed in the center of LDs as one displays the ratio value close to the oil of medium-chain tri-glycerides (Labrafac™, Figure 6F) and for the second one it is even lower (0.6), probably denoting a difference in the lipid composition in the core of these LDs.
Figure 6. Laser scanning confocal images of KB cells in the presence of DAF (2 μM). (A) Image obtained in the blue channel: λEx= 405 nm, Em: 415-480 nm. (B) Image obtained in the red channel: λEx= 405 nm, Em: 500-600 nm. (C) Ratiometric image obtained from the ratio between the red and the blue channels, mapping the polarity distribution in live cells. The inset in C was zoomed in E showing two LDs with heterogeneous polarity, D and F are ratiometric images using the same parameters performed with DAF (10 μM) in pure ethanol and pure oil (Labrafac™) respectively. Scale bar is 20 μm.
A B C D
A
B
C
Oil
Ethanol
D
1 µmBlue Channel
Red Channel
Ratiometric Image
P o l a r i t yE
F
Conclusion
We herein synthesized and characterized a push-pull fluoro-phore, DAF that displays a 119 nm positive solvatochromism in emission. Using a single excitation source, DAF was shown to immediately stain the LDs in live cells using a blue emis-sion channel and the cytoplasm using a red emisemis-sion channel. Colocalization experiments showed that DAF unraveled LDs that could not be detected by BODIPY 493/503 and vice ver-sa, thus showing that DAF is complementary to BODIPY 493/503. Due to its blue shifted excitation spectra, DAF proved to be compatible with multicolor fluorescence imaging using green and red fluorescent markers. Additionally, due to its fluorogenic properties DAF does not require any washing steps and provided images displaying virtually no background signal. Taking advantage of its solvatochromism and using a red-shifted fluorescent channel, DAF provided ratiometric images leading to the polarity mapping of the cytoplasm and LDs. DAF also showed some variation in polarity between the core and the surface of LDs, however a more dedicated study using super-resolution imaging will be needed to confirm this observation. This feature might be of importance to study the variation LDs membrane composition especially during inter-action with other organelles and fusion. Interestingly, we demonstrated that, within the LDs population, their lipid core displayed various polarities probably denoting heterogeneity in their composition. Studying the composition of metabolic lipids by imaging might accelerate LDs studies and open the way to a better comprehension of metabolic disorders associ-ated diseases such as atherosclerosis,14 but also Alzheimer
disease and epilepsy.61 In conclusion, DAF is a blue emitting
LDs marker suitable for multicolor live and fixed cells fluo-rescence imaging and that can also efficiently probe the heter-ogeneity in polarity of LDs. This work contributes to a new field of research namely fluorescent and environment-sensitive LDs probes that not only consist in staining LDs but in sensing their environment like their polarity, their composition or their viscosity.41 Further works are ongoing in our laboratory to find
a correlation between the polarity of LDs and their metabolic lipid composition.
AUTHOR INFORMATION Corresponding Author
E-mail: mayeul.collot@unistra.fr
Author Contributions
The manuscript was written through contributions of all authors. / All authors have given approval to the final version of the manu-script.
Funding Sources
This work was supported by ERC Consolidator grant BrightSens 648528, ANR BrightRiboProbes (ANR-16-CE11-0010).
ACKNOWLEDGMENT
We thank Romain Vauchelles for his assistance at the PIQ imag-ing platform and for the Ratio Intensity Color Version 2.5 plugin. We acknowledge the Service de Chimie Analytique (SCA) for LC-MS and RMN analyses.
ASSOCIATED CONTENT Supporting Information
The Supporting Information is available free of charge on the ACS Publications website.Synthesis of DAF, protocols, character-izations including NMR and mass spectra are available in the SI as well as cytotoxicity assay, additional spectroscopic data and imaging experiments and controls.
REFERENCES
(1) Murphy, D. J. The Dynamic Roles of Intracellular Lipid Droplets: From Archaea to Mammals. Protoplasma 2012, 249 (3), 541–585. https://doi.org/10.1007/s00709-011-0329-7.
(2) Waltermann, M.; Steinbuchel, A. Neutral Lipid Bodies in Prokaryotes: Recent Insights into Structure, Formation, and Relation-ship to Eukaryotic Lipid Depots. J. Bacteriol. 2005, 187 (11), 3607– 3619. https://doi.org/10.1128/JB.187.11.3607-3619.2005.
(3) Farese, R. V.; Walther, T. C. Lipid Droplets Finally Get a Little R-E-S-P-E-C-T. Cell 2009, 139 (5), 855–860. https://doi.org/10.1016/j.cell.2009.11.005.
(4) Martin, S.; Parton, R. G. Lipid Droplets: A Unified View of a Dynamic Organelle. Nat. Rev. Mol. Cell Biol. 2006, 7 (5), 373–378. https://doi.org/10.1038/nrm1912.
(5) Walther, T. C.; Jr, R. V. F. Lipid Droplets and Cellular Lipid Metabolism. Annu. Rev. Biochem. 2012, 81 (1), 687–714. https://doi.org/10.1146/annurev-biochem-061009-102430.
(6) Thiam, A. R.; Farese Jr, R. V.; Walther, T. C. The Bio-physics and Cell Biology of Lipid Droplets. Nat. Rev. Mol. Cell Biol. 2013, 14 (12), 775–786. https://doi.org/10.1038/nrm3699.
(7) Cao, H.; Gerhold, K.; Mayers, J. R.; Wiest, M. M.; Wat-kins, S. M.; Hotamisligil, G. S. Identification of a Lipokine, a Lipid Hormone Linking Adipose Tissue to Systemic Metabolism. Cell 2008, 134 (6), 933–944. https://doi.org/10.1016/j.cell.2008.07.048. (8) Zehmer, J. K.; Huang, Y.; Peng, G.; Pu, J.; Anderson, R. G. W.; Liu, P. A Role for Lipid Droplets in Inter-Membrane Lipid Traf-fic. Proteomics 2009, 9 (4), 914–921. https://doi.org/10.1002/pmic.200800584.
(9) Blom, T.; Somerharju, P.; Ikonen, E. Synthesis and Biosyn-thetic Trafficking of Membrane Lipids. Cold Spring Harb. Perspect.
Biol. 2011, 3 (8). https://doi.org/10.1101/cshperspect.a004713.
(10) Li, Z.; Thiel, K.; Thul, P. J.; Beller, M.; Kühnlein, R. P.; Welte, M. A. Lipid Droplets Control the Maternal Histone Supply of Drosophila Embryos. Curr. Biol. CB 2012, 22 (22), 2104–2113. https://doi.org/10.1016/j.cub.2012.09.018.
(11) Bozza, P. T.; Viola, J. P. B. Lipid Droplets in Inflammation and Cancer. Prostaglandins Leukot. Essent. Fat. Acids PLEFA 2010,
82 (4–6), 243–250. https://doi.org/10.1016/j.plefa.2010.02.005.
(12) Welte, M. A. Expanding Roles for Lipid Droplets. Curr.
Biol. CB 2015, 25 (11), R470-481. https://doi.org/10.1016/j.cub.2015.04.004.
(13) Liu, L.; Zhang, K.; Sandoval, H.; Yamamoto, S.; Jaiswal, M.; Sanz, E.; Li, Z.; Hui, J.; Graham, B. H.; Quintana, A.; et al. Glial Lipid Droplets and ROS Induced by Mitochondrial Defects Promote Neurodegeneration. Cell 2015, 160 (1–2), 177–190. https://doi.org/10.1016/j.cell.2014.12.019.
(14) Krahmer, N.; Farese, R. V.; Walther, T. C. Balancing the Fat: Lipid Droplets and Human Disease. EMBO Mol. Med. 2013, 5 (7), 973–983. https://doi.org/10.1002/emmm.201100671.
(15) Herker, E.; Harris, C.; Hernandez, C.; Carpentier, A.; Kaehlcke, K.; Rosenberg, A. R.; Farese, R. V.; Ott, M. Efficient Hep-atitis C Virus Particle Formation Requires Diacylglycerol Acyltrans-ferase-1. Nat. Med. 2010, 16 (11), 1295–1298. https://doi.org/10.1038/nm.2238.
(16) Tirinato, L.; Pagliari, F.; Limongi, T.; Marini, M.; Falqui, A.; Seco, J.; Candeloro, P.; Liberale, C.; Di Fabrizio, E. An Overview of Lipid Droplets in Cancer and Cancer Stem Cells https://www.hindawi.com/journals/sci/2017/1656053/ (accessed Nov 27, 2017). https://doi.org/10.1155/2017/1656053.
(17) Liu, Q.; Luo, Q.; Halim, A.; Song, G. Targeting Lipid Me-tabolism of Cancer Cells: A Promising Therapeutic Strategy for
Can-cer. Cancer Lett. 2017, 401 (Supplement C), 39–45. https://doi.org/10.1016/j.canlet.2017.05.002.
(18) Abramczyk, H.; Surmacki, J.; Kopeć, M.; Olejnik, A. K.; Lubecka-Pietruszewska, K.; Fabianowska-Majewska, K. The Role of Lipid Droplets and Adipocytes in Cancer. Raman Imaging of Cell Cultures: MCF10A, MCF7, and MDA-MB-231 Compared to Adipo-cytes in Cancerous Human Breast Tissue. Analyst 2015, 140 (7), 2224–2235. https://doi.org/10.1039/C4AN01875C.
(19) Zhang, C.; Liu, P. The Lipid Droplet: A Conserved Cellular Organelle. Protein Cell 2017, 8 (11), 796–800. https://doi.org/10.1007/s13238-017-0467-6.
(20) Thiam, A. R.; Beller, M. The Why, When and How of Lipid Droplet Diversity. J Cell Sci 2017, 130 (2), 315–324. https://doi.org/10.1242/jcs.192021.
(21) Bader, C. A.; Shandala, T.; Carter, E. A.; Ivask, A.; Guinan, T.; Hickey, S. M.; Werrett, M. V.; Wright, P. J.; Simpson, P. V.; Stagni, S.; et al. A Molecular Probe for the Detection of Polar Lipids in Live Cells. PLOS ONE 2016, 11 (8), e0161557. https://doi.org/10.1371/journal.pone.0161557.
(22) Ghosh, C.; Nandi, S.; Bhattacharyya, K. Probing Micro-Environment of Lipid Droplets in a Live Breast Cell: MCF7 and MCF10A. Chem. Phys. Lett. 2017, 670, 27–31. https://doi.org/10.1016/j.cplett.2016.12.068.
(23) Lavis, L. D. Teaching Old Dyes New Tricks: Biological Probes Built from Fluoresceins and Rhodamines. Annu. Rev.
Bio-chem. 2017, 86 (1), 825–843.
https://doi.org/10.1146/annurev-biochem-061516-044839.
(24) Yang, Z.; Cao, J.; He, Y.; Yang, J. H.; Kim, T.; Peng, X.; Kim, J. S. Macro-/Micro-Environment-Sensitive Chemosensing and Biological Imaging. Chem. Soc. Rev. 2014, 43 (13), 4563–4601. https://doi.org/10.1039/C4CS00051J.
(25) Nadler, A.; Schultz, C. The Power of Fluorogenic Probes.
Angew. Chem. Int. Ed. 2013, 52 (9), 2408–2410. https://doi.org/10.1002/anie.201209733.
(26) Li, X.; Gao, X.; Shi, W.; Ma, H. Design Strategies for Water-Soluble Small Molecular Chromogenic and Fluorogenic Probes. Chem. Rev. 2014, 114 (1), 590–659. https://doi.org/10.1021/cr300508p.
(27) Su, D.; Teoh, C. L.; Wang, L.; Liu, X.; Chang, Y.-T. Mo-tion-Induced Change in Emission (MICE) for Developing Fluorescent Probes. Chem. Soc. Rev. 2017, 46 (16), 4833–4844. https://doi.org/10.1039/C7CS00018A.
(28) Klymchenko, A. S. Solvatochromic and Fluorogenic Dyes as Environment-Sensitive Probes: Design and Biological Applica-tions. Acc. Chem. Res. 2017, 50 (2), 366–375. https://doi.org/10.1021/acs.accounts.6b00517.
(29) Life Technologies https://www.thermofisher.com/. (30) Greenspan, P.; Mayer, E. P.; Fowler, S. D. Nile Red: A Selective Fluorescent Stain for Intracellular Lipid Droplets. J. Cell
Biol. 1985, 100 (3), 965–973. https://doi.org/10.1083/jcb.100.3.965.
(31) Collot, M.; Fam, T. K.; Ashokkumar, P.; Faklaris, O.; Gal-li, T.; Danglot, L.; Klymchenko, A. S. Ultrabright and Fluorogenic Probes for Multicolor Imaging and Tracking of Lipid Droplets in Cells and Tissues. J. Am. Chem. Soc. 2018, 140 (16), 5401–5411. https://doi.org/10.1021/jacs.7b12817.
(32) Fam, T.; Klymchenko, A.; Collot, M. Recent Advances in Fluorescent Probes for Lipid Droplets. Materials 2018, 11 (9), 1768. https://doi.org/10.3390/ma11091768.
(33) Appelqvist, H.; Stranius, K.; Börjesson, K.; Nilsson, K. P. R.; Dyrager, C. Specific Imaging of Intracellular Lipid Droplets Us-ing a Benzothiadiazole Derivative with Solvatochromic Properties.
Bioconjug. Chem. 2017, 28 (5), 1363–1370. https://doi.org/10.1021/acs.bioconjchem.7b00048.
(34) Zheng, Z.; Zhang, T.; Liu, H.; Chen, Y.; Kwok, R. T. K.; Ma, C.; Zhang, P.; Sung, H. H. Y.; Williams, I. D.; Lam, J. W. Y.; et al. Bright Near-Infrared Aggregation-Induced Emission Luminogens with Strong Two-Photon Absorption, Excellent Organelle Specificity, and Efficient Photodynamic Therapy Potential. ACS Nano 2018, 12 (8), 8145–8159. https://doi.org/10.1021/acsnano.8b03138.
(35) Jiang, M.; Gu, X.; Lam, J. W. Y.; Zhang, Y.; Kwok, R. T. K.; Wong, K. S.; Tang, B. Z. Two-Photon AIE Bio-Probe with Large
Stokes Shift for Specific Imaging of Lipid Droplets. Chem. Sci. 2017,
8 (8), 5440–5446. https://doi.org/10.1039/C7SC01400G.
(36) Wang, Z.; Gui, C.; Zhao, E.; Wang, J.; Li, X.; Qin, A.; Zhao, Z.; Yu, Z.; Tang, B. Z. Specific Fluorescence Probes for Lipid Droplets Based on Simple AIEgens. ACS Appl. Mater. Interfaces 2016, 8 (16), 10193–10200. https://doi.org/10.1021/acsami.6b01282. (37) Kuntam, S.; Puskás, L. G.; Ayaydin, F. Characterization of a New Class of Blue-Fluorescent Lipid Droplet Markers for Live-Cell Imaging in Plants. Plant Cell Rep. 2015, 34 (4), 655–665. https://doi.org/10.1007/s00299-015-1738-4.
(38) Becerra-Ruiz Martín; Vargas Victor; Jara Patricio; Tirape-gui Cristian; Carrasco Carlos; Nuñez Marco; Lezana Nicolás; Galdámez Antonio; Vilches-Herrera Marcelo. Blue-Fluorescent Probes for Lipid Droplets Based on Dihydrochromeno-Fused Pyrazo-lo- and Pyrrolopyridines. Eur. J. Org. Chem. 2018, 0 (0). https://doi.org/10.1002/ejoc.201701633.
(39) Yang, H.-J.; Hsu, C.-L.; Yang, J.-Y.; Yang, W. Y. Mono-dansylpentane as a Blue-Fluorescent Lipid-Droplet Marker for Multi-Color Live-Cell Imaging. PLOS ONE 2012, 7 (3), e32693. https://doi.org/10.1371/journal.pone.0032693.
(40) Sk Bahadur; Thakre Pilendra Kumar; Tomar Raghuvir Singh; Patra Abhijit. A Pyridoindole-Based Multifunctional Bioprobe: PH-Induced Fluorescence Switching and Specific Targeting of Lipid Droplets. Chem. – Asian J. 2017, 12 (18), 2501–2509. https://doi.org/10.1002/asia.201700898.
(41) Guo, R.; Yin, J.; Ma, Y.; Li, G.; Wang, Q.; Lin, W. A Nov-el NIR Probe for Detection of Viscosity in CNov-ellular Lipid Droplets, Zebra Fishes and Living Mice. Sens. Actuators B Chem. 2018, 271, 321–328. https://doi.org/10.1016/j.snb.2018.05.055.
(42) Reichardt, C. Solvatochromic Dyes as Solvent Polarity Indicators. Chem. Rev. 1994, 94 (8), 2319–2358. https://doi.org/10.1021/cr00032a005.
(43) Kucherak, O. A.; Oncul, S.; Darwich, Z.; Yushchenko, D. A.; Arntz, Y.; Didier, P.; Mély, Y.; Klymchenko, A. S. Switchable Nile Red-Based Probe for Cholesterol and Lipid Order at the Outer Leaflet of Biomembranes. J. Am. Chem. Soc. 2010, 132 (13), 4907– 4916. https://doi.org/10.1021/ja100351w.
(44) Niko, Y.; Didier, P.; Mely, Y.; Konishi, G.; Klymchenko, A. S. Bright and Photostable Push-Pull Pyrene Dye Visualizes Lipid Order Variation between Plasma and Intracellular Membranes. Sci.
Rep. 2016, 6, 18870. https://doi.org/10.1038/srep18870.
(45) Shaya, J.; Collot, M.; Benailly, F.; Mahmoud, N.; Mély, Y.; Michel, B. Y.; Klymchenko, A. S.; Burger, A. Turn-On Fluorene Push-Pull Probes with High Brightness and Photostability for Visual-izing Lipid Order in Biomembranes. ACS Chem. Biol. 2017. https://doi.org/10.1021/acschembio.7b00658.
(46) Chatterjee Aninda; Seth Debabrata. Photophysical Proper-ties of 7-(Diethylamino)Coumarin-3-Carboxylic Acid in the Nanocage of Cyclodextrins and in Different Solvents and Solvent Mixtures. Photochem. Photobiol. 2012, 89 (2), 280–293. https://doi.org/10.1111/php.12000.
(47) Enderlein, J.; Erdmann, R. Fast Fitting of Multi-Exponential Decay Curves. Opt. Commun. 1997, 134 (1), 371–378. https://doi.org/10.1016/S0030-4018(96)00384-7.
(48) Smith, D. A.; McKenzie, G.; Jones, A. C.; Smith, T. A. Analysis of Time-Correlated Single Photon Counting Data: A Com-parative Evaluation of Deterministic and Probabilistic Approaches.
Methods Appl. Fluoresc. 2017, 5 (4), 042001. https://doi.org/10.1088/2050-6120/aa8055.
(49) Chaumont, F. de; Dallongeville, S.; Chenouard, N.; Hervé, N.; Pop, S.; Provoost, T.; Meas-Yedid, V.; Pankajakshan, P.; Lecomte, T.; Montagner, Y. L.; et al. Icy: An Open Bioimage Infor-matics Platform for Extended Reproducible Research. Nat. Methods 2012, 9 (7), nmeth.2075. https://doi.org/10.1038/nmeth.2075. (50) Collot, M.; Kreder, R.; Tatarets, A. L.; Patsenker, L. D.; Mely, Y.; Klymchenko, A. S. Bright Fluorogenic Squaraines with Tuned Cell Entry for Selective Imaging of Plasma Membrane vs. Endoplasmic Reticulum. Chem. Commun. 2015, 51 (96), 17136– 17139. https://doi.org/10.1039/C5CC06094J.
(51) Lagache, T.; Grassart, A.; Dallongeville, S.; Faklaris, O.; Sauvonnet, N.; Dufour, A.; Danglot, L.; Olivo-Marin, J.-C. Mapping
Molecular Assemblies with Fluorescence Microscopy and Object-Based Spatial Statistics. Nat. Commun. 2018, 9 (1), 698. https://doi.org/10.1038/s41467-018-03053-x.
(52) Ando, Y.; Homma, Y.; Hiruta, Y.; Citterio, D.; Suzuki, K. Structural Characteristics and Optical Properties of a Series of Solva-tochromic Fluorescent Dyes Displaying Long-Wavelength Emission.
Dyes Pigments 2009, 83 (2), 198–206. https://doi.org/10.1016/j.dyepig.2009.04.008.
(53) Kucherak, O. A.; Didier, P.; Mély, Y.; Klymchenko, A. S. Fluorene Analogues of Prodan with Superior Fluorescence Brightness and Solvatochromism. J. Phys. Chem. Lett. 2010, 1 (3), 616–620. https://doi.org/10.1021/jz9003685.
(54) Sasaki, S.; Drummen, G. P. C.; Konishi, G. Recent Ad-vances in Twisted Intramolecular Charge Transfer (TICT) Fluores-cence and Related Phenomena in Materials Chemistry. J. Mater.
Chem. C 2016, 4 (14), 2731–2743.
https://doi.org/10.1039/C5TC03933A.
(55) Kucherak, O. A.; Richert, L.; Mély, Y.; Klymchenko, A. S. Dipolar 3-Methoxychromones as Bright and Highly Solvatochromic Fluorescent Dyes. Phys. Chem. Chem. Phys. 2012, 14 (7), 2292–2300. https://doi.org/10.1039/C2CP23037B.
(56) Ooyama, Y.; Asada, R.; Inoue, S.; Komaguchi, K.; Imae, I.; Harima, Y. Solvatochromism of Novel Donor–π–acceptor Type Pyri-dinium Dyes in Halogenated and Non-Halogenated Solvents. New J.
Chem. 2009, 33 (11), 2311–2316.
https://doi.org/10.1039/B9NJ00332K.
(57) Herms, A.; Bosch, M.; Ariotti, N.; Reddy, B. J. N.; Fajar-do, A.; Fernández-Vidal, A.; Alvarez-Guaita, A.; Fernández-Rojo, M. A.; Rentero, C.; Tebar, F.; et al. Cell-to-Cell Heterogeneity in Lipid Droplets Suggests a Mechanism to Reduce Lipotoxicity. Curr. Biol.
CB 2013, 23 (15), 1489–1496.
https://doi.org/10.1016/j.cub.2013.06.032.
(58) Zhang, S.; Wang, Y.; Cui, L.; Deng, Y.; Xu, S.; Yu, J.; Cichello, S.; Serrero, G.; Ying, Y.; Liu, P. Morphologically and Func-tionally Distinct Lipid Droplet Subpopulations. Sci. Rep. 2016, 6, 29539. https://doi.org/10.1038/srep29539.
(59) Zheng, X.; Zhu, W.; Ni, F.; Ai, H.; Yang, C. A Specific Bioprobe for Super-Resolution Fluorescence Imaging of Lipid Drop-lets. Sens. Actuators B Chem. 2018, 255, 3148–3154. https://doi.org/10.1016/j.snb.2017.09.139.
(60) Eggert, D.; Rösch, K.; Reimer, R.; Herker, E. Visualization and Analysis of Hepatitis C Virus Structural Proteins at Lipid Drop-lets by Super-Resolution Microscopy. PLOS ONE 2014, 9 (7), e102511. https://doi.org/10.1371/journal.pone.0102511.
(61) Welte, M. A. Expanding Roles for Lipid Droplets. Curr.
Biol. CB 2015, 25 (11), R470-481. https://doi.org/10.1016/j.cub.2015.04.004.