HAL Id: hal-02399590
https://hal.archives-ouvertes.fr/hal-02399590
Submitted on 14 Dec 2020
HAL is a multi-disciplinary open access archive for the deposit and dissemination of sci-entific research documents, whether they are pub-lished or not. The documents may come from teaching and research institutions in France or abroad, or from public or private research centers.
L’archive ouverte pluridisciplinaire HAL, est destinée au dépôt et à la diffusion de documents scientifiques de niveau recherche, publiés ou non, émanant des établissements d’enseignement et de recherche français ou étrangers, des laboratoires publics ou privés.
primary production of native macroalgae and alter
carbon flow in intertidal rock pools
Francesca Rossi, Rosa Viejo, Linney Duarte, Fatima Vaz-Pinto, Ignacio
Gestoso, Celia Olabarria
To cite this version:
Francesca Rossi, Rosa Viejo, Linney Duarte, Fatima Vaz-Pinto, Ignacio Gestoso, et al.. Removal of an established invader can change gross primary production of native macroalgae and alter carbon flow in intertidal rock pools. PLoS ONE, Public Library of Science, 2019, 14 (12), pp.e0217121. �10.1371/journal.pone.0217121�. �hal-02399590�
Removal of an established invader can change
gross primary production of native
macroalgae and alter carbon flow in intertidal
rock pools
Francesca RossiID1*, Rosa M. Viejo2, Linney Duarte2, Fatima Vaz-Pinto3,
Ignacio GestosoID4, Celia OlabarriaID5
1 Universite´ Coˆte d’Azur, CNRS, UMR7035 ECOSEAS, Nice, France, 2 A´ rea de Biodiversidad y
Conservacio´n, Universidad Rey Juan Carlos, Madrid, Spain, 3 MARE–Marine and Environmental Sciences Centre, Canic¸al, Madeira Island, Portugal, 4 IIMAR/CIMAR,Centro Interdisciplinar de Investigac¸ão Marinha e Ambiental, Matosinhos, Portugal, 5 Departamento de Ecoloxı´a e Bioloxı´a Animal, Facultade de Ciencias del Mar, Universidade de Vigo, Vigo, Spain
*francesca.rossi@cnrs.fr
Abstract
The impact of invasive species on recipient communities can vary with environmental con-text and across levels of biological complexity. We investigated how an established invasive seaweed species affected the biomass, eco-physiology, carbon and nitrogen storage capacity of native seaweeds at sites with a different environmental setting due to a persis-tent upwelling in northern Spain. We removed the invasive Japanese wireweed Sargassum
muticum from intertidal rock pools once every month during a one-year period and used an in-situ stable isotope pulse-chase labeling to estimate gross primary production (GPP),
nitrogen uptake rate,13C-carbon and15N-nitrogen storage capacities. Following the addition of13C-enriched bicarbonate and15N-enriched nitrate to the seawater in the rock pools dur-ing the period of the low tide, we sampled macroalgal thalli at incomdur-ing tide to determine label uptake rate. After four days, we sampled macroalgal assemblages to determine both label storage capacity and biomass. After one year of removal there was no change in the macroalgal assemblage. However, both the GPP and13C-carbon storage capacity were higher in the turf-forming Corallina spp. and, sometimes, in the canopy-forming Bifurcaria
bifurcata. Nitrogen uptake rate followed similar, but more variable results. Although S. muti-cum inhibited carbon storage capacity of native species, the assemblage-level13C-carbon storage was similar in the S. muticum—removed and control rock pools because the pres-ence of the invasive species compensated for the functional loss of native species, particu-larly at sites where it was most abundant. No obvious effects were observed in relation to the environmental setting. Overall, the effect of the invasive S. muticum on carbon flow appeared to be mediated both by the effects on resource-use efficiency of native species and by its own biomass. Integrating physiological and assemblage-level responses can pro-vide a broad understanding of how invasive species affect recipient communities and eco-system functioning. a1111111111 a1111111111 a1111111111 a1111111111 a1111111111 OPEN ACCESS
Citation: Rossi F, Viejo RM, Duarte L, Vaz-Pinto F,
Gestoso I, Olabarria C (2019) Removal of an established invader can change gross primary production of native macroalgae and alter carbon flow in intertidal rock pools. PLoS ONE 14(12): e0217121.https://doi.org/10.1371/journal. pone.0217121
Editor: Agnese Marchini, University of Pavia, ITALY Received: May 3, 2019
Accepted: November 12, 2019 Published: December 3, 2019
Copyright:© 2019 Rossi et al. This is an open access article distributed under the terms of the
Creative Commons Attribution License, which permits unrestricted use, distribution, and reproduction in any medium, provided the original author and source are credited.
Data Availability Statement: Data are available
from the Open Science Framework:10.17605/OSF. IO/7TE4X.
Funding: This research was supported by the
Spanish Government through the Ministry of Science and Innovation-FEDER (project CGL2009-07205) and Xunta-FEDER de Galicia (ED431C 2017/46).
Competing interests: The authors have declared
Introduction
Biological invasion is an important component of global change, with a pervasive ecological impact on population, community and ecosystem functioning [1,2]. Invasive species impacts are context-dependent and variable in magnitude and direction, making their evaluation and prediction a difficult task [3,4].
When a non-indigenous species invades a community, native organism’s survival, physio-logical and ecophysio-logical adaptations propagate to community and ecosystem processes through complex interactions among native and invasive organisms and with the environment [5–10]. Other components of global change such as warming and nutrient enrichment can also inter-act with the invasion, facilitate their success and change the impinter-act on native species and eco-system functioning [11–14]. Invasive species management should take into account the patterns of response over different biological scales and the interactions with other stressors in order to take adequate measures for controlling the impact at community and ecosystem levels [3]. Yet, very few studies on bioinvasions have considered the response at different levels of biological complexity simultaneously [3,5,15,16].
Carbon (C) and nitrogen (N) cycles are fundamental elements of ecosystem functioning and services. Eco-physiological and demographic traits such as photosynthetic rate, growth and biomass of both invasive and native primary producers are among the elements that can drive changes in ecosystem-based processes governing C and N cycles, such as productivity, C and N fixation, storage and mineralization [17,18]. A comparative approach linking changes in species traits to ecosystem processes, especially those related to C and N cycles could greatly contribute to improve management and control of invasions [3,5]. This can be worthy espe-cially in the context of invasive ecosystem engineer species that can show strong ecological impacts of opposing directions on native populations, communities and ecosystem functions [4,13,14].
Marine coastal areas are particularly vulnerable to invasions due to numerous introduction vectors and activities that facilitate the spread of non-indigenous species [19]. In the last few decades, a large number of potentially highly invasive seaweeds have colonized marine coastal areas outside their range of distribution [20–23]. Invasion by the brown algaSargassum muti-cum (Yendo) Fendsholdt is of particular concern, especially in Europe, where this species is
classified as highly invasive [21]. The species has spread quickly across the European Atlantic coasts since its first appearance in the early 1970s. In the Iberian Peninsula,S. muticum became
established as an invasive species in the 1980s [24,25].Sargassum muticum is a canopy
-form-ing macroalgal species that can efficiently compete for light and substrate availability and thus affect other macroalgae [26]. However, its ecological impact is very variable in magnitude and direction and there is still no consensus about the effects on recipient communities and ecosys-tem functions (see [27] for a review).
In this study we investigated if established populations of the invasive wireweedS. muticum
affect biomass, eco-physiological traits associated with carbon (C) and nitrogen (N) flows and assemblage-level C and N storage of macroalgal assemblages. We also asked if the impacts are modified by the environmental setting. We removed the invader from selected intertidal rock pools once a month for more than one year in northern Spain (north of Galicia and eastern Asturias), within the broad transitional zones between cold- and warm-water [28]. Upwelling events occur in the northwest Spain and contribute increasing the differences in temperature and nutrient availability between eastern Asturias and northern Galicia [26,29,30].
In response to the complete removal ofS. muticum from the rock pools, we expected to find
an increase in the biomass of native species, in their capacity to fix and store C and N and also a change in the assemblage-level C and N pools. We also expected that the magnitude of the response would vary according to the cold-warm water transition zone and upwelling events.
We used anin situ stable isotope pulse-chase labeling experiment, involving the addition of
13
C- and15N- enriched inorganic compounds to the rock pools to measure any variations in the capacity of native species to fix and store nitrogen and carbon. Stable isotopes (SI) can be used at naturally occurring levels or can be used at levels outside the natural range by the addi-tion of SI as tracers [31–33].13C-tracing can be used to estimate gross primary production, as an alternative to radioactive tracers (14C), the use of which is restricted in experimental studies [34,35]. Similarly,15N tracing can be used to estimate the rate of nitrate or ammonium uptake [36,37]. The SI approach has been proposed as a tool to investigate plant physiology and the impacts that invasions can have on the food web of the recipient ecosystem [38,39]. However, to date studies on the use of SI as tracers in plant physiology have generally been conducted in the laboratory and application to field studies is at its infancy [31,40].
Material and methods
Study sites
Four sites were selected along the north Iberian Peninsula between the Atlantic and the inner part of the Biscay Bay (from 4˚ 39’ to 7˚ 15’ W). The sites had rocky platforms, which were semi-exposed to wave action, known to be invaded byS. muticum. Rocas Blancas (RB; 43˚ 33’
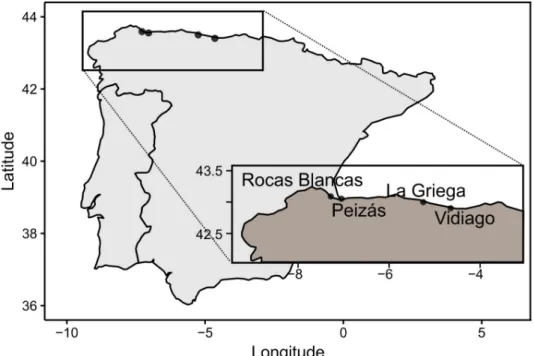
21.91”N, 7˚ 2’ 31.42”W) and Peizas (P; 43˚ 35’ 23.95”N; 7˚, 16’ 50.76”W) sites, situated in north of Galicia, receive cold, nutrient-rich upwelling water, whereas the sites at La Griega (LG; 43˚ 30’ 3.78”N, 5˚ 15’ 4.36”W) and Vidiago (V; 43˚ 24’ 8.17”N, 4˚ 38’ 58.14”W) in eastern Asturias are reached by warm waters from the Gulf current ([30];Fig 1). We did not need per-mission or approval to access these sites because they are not under special protection.
The temperature of the oceanic water reaching the tidal rock pools was measured with field temperature data loggers (TidbitT1 v2 Temp) placed in 2 rock pools at each site between November 2010 and September 2011. We recorded the temperature every 30 min and used two readings per day coinciding with incoming high tide to measure oceanic water tempera-ture in the tide pools, without the effect of solar irradiation (minimal daily temperatempera-ture in the pools). The concentration of inorganic nitrogen (NO2-and NO3-) was measured by collecting 4 water samples at high tide on 6 dates between autumn 2010 and spring 2012 (November 2010, April-May 2011, June-July 2011, September 2011, April-May 2012, October 2012), except in Vidiago where sampling was not done in October 2011. The samples were frozen until analysis with a continuous flux autoanalyser.
Experimental design and sampling
In November 2010, at each site we randomly selected 6 rock pools in the low intertidal area among those that were invaded by S.muticum and were of relatively similar size. The area and
volume of the selected rock pools were determined by measuring the length, width and depth of each pool. Overall, the rock pools differed in area and volume among sites (ANOVA: F3,16= 4.02, p = 0.03; F3,16= 4.33, p = 0.02 for area and volume, respectively). The rock pools at Peizas and La Griega were on average the largest (P: area = 2.74± 1.24 m2and volume = 0.75± 0.16 m3; LG: area: 2.31± 1.16 m2and volume: 0.41± 0.11 m3). The Rocas Blancas and Vidiago rock pools were the smallest (RB: area = 1.33± 0.62 m2and volume = 0.22± 0.04 m3; V:
area = 1.05± 0.29 m2and volume = 0.26± 0.07 m3). However,a posteriori test SNK (p = 0.05)
Between November 2010 and February 2012, we removedS. muticum every month by hand
from half of these rock pools (hereafterS. muticum—removed, -S) at each site. The remaining
rock pools were left undisturbed (hereafter control pools, +S). There were no differences in size among theS muticum—removed and the control rock pools (ANOVA, F1,16= 0.74 p = 0.40 and 0.48, p = 0.50 for area and volume, respectively).
At the beginning of the spring tide (10thMarch 2012), we added K15NO3(99% of15N atoms, SIGMA) and NaH13CO3(99%
13
C atoms, SIGMA) to the water remaining in the tide pools (Fig 1for the timeline of the experiment). We added 0.006 mg of15N L-1and 0.52 mg of 13
C L-1to each rock pool, varying the amount of label according to the volume of the pool. These concentrations were expected to increase the heavy isotope atoms in the water by up to
Fig 1. Study sites and sampling design. Map of the sites on the Spanish coast: Rocas Blancas (RB), Peizas (P), La Griega (LG), Vidiago (V) and timeline of the
experiment.
2% of the total C or N, assuming a concentration of dissolved inorganic carbon (DIC) of 2 mmol L-1and that of total nitrogen (NO2-, NO3-and NH4+) of 0.02 mmol L-1. The amounts were calculated before the analytical data on nitrogen concentration in seawater were available. These data were incorporated in the estimates of C and N fixation and storage, as shown in the next section. We used low isotope-addition levels to prevent altering the natural biogeochem-istry of the seawater (nitrogen enrichment or acidification of the seawater). During the incom-ing tide (day 1; 2–3 h after addition of label), we sampled small amounts of the dominant seaweeds to assess the amount of label they could fix during exposure. The tidal rock pools position (low intertidal and semi-exposed sites) allowed seawater renewal every tidal cycle. Therefore, the label not fixed during low tide would be washed away by incoming tide, as pre-viously observed in other systems [41,42]. The fixed label would be instead partly stored in the thalli and partly released by seaweed metabolism (respiration, ammonium release). Four days after adding the label, we sampled seaweed biomass and isotope incorporation. At the sites in Galicia (Peizas and Rocas Blancas), we also took samples at intermediate times (24 and 48 hours; day 2 and 3, respectively). On day 2, only the Peizas site was sampled as a local storm prevented sampling at Rocas Blancas. During the final sampling, 20× 20 cm quadrats were randomly selected in each rock pool. The number of quadrats per pool varied from 2 to 5, according to the pool size. The total number of quadrats necessary to cover the pool surface was visually estimated in the field. The seaweeds within the quadrats were removed and trans-ported to the laboratory, identified to the lowest taxonomic level possible, dried at 60˚C for 48h and weighed. We also sampled seaweeds outside the tested rock pools to determine back-ground isotopic values.
We expressed macroalgal biomass per sampling unit (0.04 m2) and per experimental unit (rock pool). The former indicated the localized macroalgal biomass, independently of the size of the pools. Unless otherwise, results did not differ and we only report those for macroalgal biomass per rock pool, as for the carbon and nitrogen flows (see below).
After collecting the samples, we selected which species to use for stable isotope analysis.
Bifurcaria bifurcata R. Ross and Corallina spp. were the dominant taxa at all sites, making up
70% of the biomass of native species. These species were also present in the majority of tide pools across the four sites, thus enabling the consistency of the effect ofS. muticum to be tested
across sites. In addition, they represented two different morphological and functional groups, asB. bifurcata is a canopy-forming brown seaweed, and Corallina spp. is a primary space
hold-ing, turf-forming red seaweed. We also selectedCeramium spp., a small sub-canopy forming
seaweed. Although it was not particularly abundant, it was widespread across the four sites, thereby allowing cross-site comparisons.
Isotopic analysis and calculations
The C and N concentrations and stable isotopic composition (δ13
C andδ15
N) were measured in the dried and grounded samples of the selected dominant native species with a Fisons ele-mental analyser coupled on line via a Finningan conflo 2 interfaces, to a Finningan delta S mass spectrometer. The isotope ratios are expressed in the delta notation (δX = δ13
C orδ15N) and in units of ‰, as inEq 1. Reference values are based on the isotopic composition of Vienna PDB for C and atmospheric nitrogen for N.
dX ¼ ½ðRsample=RreferenceÞ 1� � 103
ð1Þ The excess of heavy isotopes (E) was estimated above background values as % atoms (the proportion of heavy isotope (in weight of atoms) over the total carbon or nitrogen), as derived
fromEq 1.
E ¼ %atomsXend %atomsXbackground ð2Þ
Gross primary production (GPP) and nitrogen uptake rate were calculated from the amount of label assimilated during the first tidal cycle (2–3 hours of exposure). GPP was derived using the equations by [Miller and Dunton 2007] and normalised to the dry weight of the macroalgae in the pool (DW inEq 3). Nitrogen uptake rate followed the equation proposed by [Naldi and Wheeler 2002], under the assumption that there was no change in the macroal-gal biomass during the hours of exposure to the label (Eq 4):
GPPðmgCg 1drywth 1Þ ¼ ðOCthalli � EthalliÞ=ðtincubation � EwaterÞ=DW ð3Þ Nitrogen uptake rateðmgNg 1
drywth 1Þ
¼ ðNthalli � EthalliÞ=ðtincubation � EwaterÞ=DW ð4Þ where C and N indicate the mg of13C-Carbon or15N-nitrogen and t is the time of exposure.
We then estimated the role of seaweeds in sequestrating C and N at the end of the study period as net mg13C-Carbon or15N-nitrogen incorporations.
mgX ¼ E � OC; N ð5Þ
As the amount of isotopes added was proportional to the volume of the pools and therefore differed between pools, the data were expressed as the percentage of total mg13C-Carbon or 15
N-nitrogen added to the pool.
Statistical analysis
We analyzed the response of the native assemblage to the removal ofS. muticum using
PER-MANOVA (999 permutations) on the triangular matrix created by pairwise Bray-Curtis index after log transformation of biomass data to decrease the relative importance of most abundant species [43]. The biomass ofS. muticum was excluded from this analysis because it was
manip-ulated as part of the design. According to the experimental design, the statistical model included two orthogonal fixed factors: Site (4 levels) andS. muticum presence (2 levels) with 3
replicate pools. Site was considered a fixed factor because sites were selected on the basis of the presence of local upwelling events and established presence ofS. muticum. A posteriori
pair-wise comparisons were done when significant differences were detected in theS. muticum ×
Site interaction term or in the main term Site.
Analysis of variance (ANOVA) and generalised least square (GLS) models were used to test for differences in the total number of species and in the biomass of native macroalgae (whole assemblage, canopy and dominant species), as well as in the gross primary production, nitro-gen uptake rate,13C-carbon and or15N-nitrogen incorporation. The GLS model considered residual variances correlated to the mean values of sites orS. muticum × Site interaction term
(model varIdent in [44]). The optimal model was then selected using Akaike’s Information Criteria, AIC [44]. When the optimal model indicated significant differences forS. muticum
term, we useda posteriori comparisons to detect at which sites the removal of S. muticum had
an impact. When the ANOVA yielded the best model, we used the SNK (Student-Newman-Kuels) test fora posteriori multiple comparisons. Otherwise, we used pairwise least-square
means comparisons using t-test. We analysed the temporal changes of excess (E) above back-ground with repeated measure linear-mixed model (GLM) [45]. Site andS muticum-removed
factors were included in the analyses for native species as fixed and orthogonal, while rock pool was included as random factor, nested in the interaction and sampled at different
repeated times. For the excess label measured inS. muticum, we used a GLM model with one
fixed factor (Site) and rock pool nested in Site as random factor.
We used ANOVA with Month and Site as fixed and orthogonal factors to test for differ-ences in temperature among sites. We run separate analyses for each season. For seawater nutrient analyses we used ANOVA model with Time of sampling and Site as fixed factors. Assumption of linearity and homogeneity of residual variances (when necessary) were checked by inspecting plots of residuals vs fitted values. If these conditions were not found and the VarInd structure did not correct residual variance heterogeneity, we log-transformed data, as indicated in the result section. All analyses were done in R 3.2.3 using the libraries nlme for the GLM and GLS model, lme4 and lsmeans for pairwise comparison tests and GAD for analy-ses of variance anda posteriori SNK test (R Development Core Team 2011). Multivariate
anal-ysis was run using PRIMER v.6.0 +PERMANOVA.
Results
Environmental setting
Temperatures were similar during autumn and winter and started to differentiate in spring. The largest differences among sites were in summer (S1 Fig). In northern Galicia, the sites had oceanic water in the rock pools of about 1˚C lower than in eastern Asturias (V: 19.66± 0.08˚C, LG: 19.54± 0.08˚C, P: 18.73 ± 0.07˚C, RB: 18.25± 0.08). The analyses showed significant differ-ences in the Month× Site interaction term, both in spring and summer (ANOVA, F6,684= 11.26 p < 0.001; F6,684= 4.23, p < 0.001, respectively). Thea posteriori SNK test showed that in spring differences among sites occurred in May only, when La Griega (LG) and Rocas Blan-cas (RB) sites had the warmest and coldest seawater temperatures, respectively. In summer, the eastern Asturias sites (LG and Vidiago, V) had the highest temperature and at Peizas (P) seawater temperature was warmer than at Rocas Blancas (V = LG > P > RB). The differences among sites in seawater nutrient concentration varied through time and sites (S1 Fig; ANOVA for the Time× Site interaction term: F15,72= 4.76, p< 0.001; data were log-transformed). The SNK test showeda posteriori that in November 2010 Rocas Blancas had the highest values and
that Peizas had the lowest values in April-May 2012, just after the labeling experiment was car-ried out (March 2012).
Isotopic enrichment experiment
The excess E (Eq 2) of13C-carbon and15N-nitrogen in native seaweed thalli did not decrease during the 4 days of the experiment (S2 Fig) and values were lower in the control than in theS.
muticum—removed pools at the Peizas site (P inTable 1). The AIC comparisons showed no
differences between auto-correlative and repeated-measure GLM models for either carbon or nitrogen. Excess label inS. muticum did not differ between sites (S2 Fig).
Macroalgal assemblage
At the time of sampling, native macroalgal assemblages did not differ following the removal of
S. muticum and this pattern was consistent across sites (PERMANOVA: F1, 16= 1.30, p = 0.24 and F3,16= 0.88, p = 0.30, for the termS. muticum and the S. muticum × Site interaction term, respectively;S3 Fig). The total number of species and their biomass showed a similar pattern of variation (Table 2). The biomass of each of the dominant species per rock pool did not differ betweenS. muticum—removed and control rock pools, and this pattern was consistent across
(90% of native canopy biomass across sites;Table 2) and, as for this species canopy-forming biomass did not differ in relation to the removal ofS. muticum (Table 2).
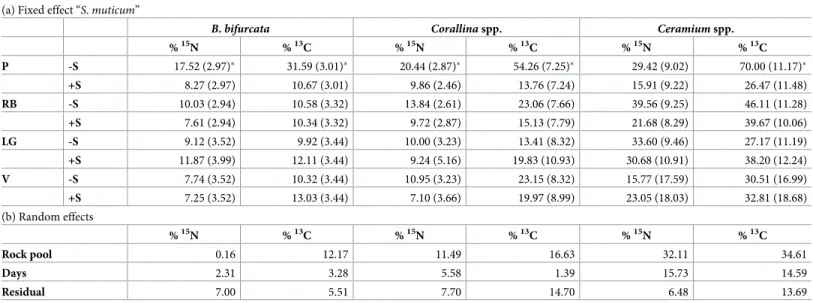
Table 1. Parameter estimates and standard errors of the GLM models for the excess E of15N and13C atoms in native macroalgae.
(a) Fixed effect “S. muticum”
B. bifurcata Corallina spp. Ceramium spp.
%15N %13C %15N %13C %15N %13C P -S 17.52 (2.97)� 31.59 (3.01)� 20.44 (2.87)� 54.26 (7.25)� 29.42 (9.02) 70.00 (11.17)� +S 8.27 (2.97) 10.67 (3.01) 9.86 (2.46) 13.76 (7.24) 15.91 (9.22) 26.47 (11.48) RB -S 10.03 (2.94) 10.58 (3.32) 13.84 (2.61) 23.06 (7.66) 39.56 (9.25) 46.11 (11.28) +S 7.61 (2.94) 10.34 (3.32) 9.72 (2.87) 15.13 (7.79) 21.68 (8.29) 39.67 (10.06) LG -S 9.12 (3.52) 9.92 (3.44) 10.00 (3.23) 13.41 (8.32) 33.60 (9.46) 27.17 (11.19) +S 11.87 (3.99) 12.11 (3.44) 9.24 (5.16) 19.83 (10.93) 30.68 (10.91) 38.20 (12.24) V -S 7.74 (3.52) 10.32 (3.44) 10.95 (3.23) 23.15 (8.32) 15.77 (17.59) 30.51 (16.99) +S 7.25 (3.52) 13.03 (3.44) 7.10 (3.66) 19.97 (8.99) 23.05 (18.03) 32.81 (18.68) (b) Random effects %15N %13C %15N %13C %15N %13C Rock pool 0.16 12.17 11.49 16.63 32.11 34.61 Days 2.31 3.28 5.58 1.39 15.73 14.59 Residual 7.00 5.51 7.70 14.70 6.48 13.69
�: Significant differences between the 2 levels of the fixed factor.
Table 1 legend. (a) Mean (SE) estimates from the GLM model for the removal ofS. muticum at each site (P, RB, LG, V, as indicated inFig 1legend) for the fixed-effectS. muticum (2 levels: no S. muticum: -S; control: +S); (b) Standard deviation of the random effect “days” (repeated measure within replicate pools).
https://doi.org/10.1371/journal.pone.0217121.t001
Table 2. Diversity and biomass of the macroalgal assemblages.
Summary ANOVA P RB LG V S. m. S. m. × Site No. of species +S 9.3(0.7) 9.7(0.9) 5.0 (0.0) 3.7 (0.3) F1,16= 3.06 p = 0.10 F3,16= 2.38 p = 0.11 -S 8.0(0.6) 6.3 (1.3) 5.0 (1.0) 4.3(0.9) Native Assemblage +S 1302.4 (439.1) 912.6 (134.2) 749.1 (297.0) 549.2 (107.8) F1,16= 0.14 p = 0.72 F3,16= 0.19 p = 0.90 -S 991.8 (73.6) 853.6 (118.1) 753.1 (488.7) 629.2 (171.6) B. bifurcata +S 519.7 (297.5) 433.0 (56.3) 301.8 (119.9) 392.8 (83.0) F1,16= 1.77 p = 0.20 F3,16= 0.65 p = 0.60 -S 247.8 (32.6) 360.9 (114.6) 143.9 (50.1) 499.4 (152.1) Corallina spp. +S 431.8 (82.7) 283.0 (90.2) 67.9 (34.0) 8.4 (4.2) F1,16= 2.54 p = 0.13 F3,16= 0.32 p = 0.81 -S 519.1 (135.5) 229.2 (78.7) 147.7 (69.1) 32.3 (7.4) Ceramium spp. +S 20.7 (15.8) 10.4(6.6) 5.6 (0.7) 0.7 (0.7) F1,16= 0.55 p = 0.47 F3,16= 1.92 p = 0.17 -S 1.8 (1.6) 5.0(4.0) 7.0 (4.3) 7.3 (4.8) Native Canopy +S 568.2 (342.6) 434.4 (57.4) 315.3 (112.8) 392.8 (83.0) F1,16= 0.36 p = 0.55 F3,16= 0.20 p = 0.89 -S 324.4 (91.5) 361.9 (115.6) 255.9 (93.4) 501.5 (152.1) S. muticum +S 868.7 (375.1) 16.3 (14.9) 95.9 (34.8) 52.7 (21.0) -S 15.6 (9.6) 0.7(0.7) 0.0 (0.0) 0.0 (0.0)
Table 2 legend. Mean (SE) number of native species (No. of species) and the biomass (g dw pool-1) of the native macroalgal assemblage, of the dominant and most represented macroalgae used for isotopic analyses, of native canopy-forming macroalgae and of the invasive species (S. muticum) at each of the four sites (P, RB, LG, V,
as indicated inFig 1legend). Values are averaged over the 3 rock pools whereS. muticum was removed (-S) or the control rock pools (+S). Summary of analyses of
variance (ANOVA) with F ratio and significant p values for theS. muticum term (S. m.) and the interaction term S. muticum × Site is also indicated. Biomass data were
log-transformed.
We observed different macroalgal assemblages between sites, independently of the removal ofS. muticum (PERMANOVA; F3, 16= 4.97, p < 0.001). There were more species at Peizas and Rocas Blancas than at La Griega and Vidiago (ANOVA: F3,16= 15.74, p < 0.0001; SNK test: P = RB > LG = V, p < 0.05,Table 1). Overall, species biomass did not vary (F3,16= 1.49, p = 0.25; F3,16= 0.77, p = 0.53; F3,16= 2.43, p = 0.10, F3,16= 0.79, p = 0.52 for all species, for
Cer-amium spp. and B. bifurcata and for canopy-forming macroalgae, respectively;Table 2), except that ofCorallina spp. (F3,16= 13.88 p = 0.0001, SNK test: P > RB = LG > V, p < 0.05). How-ever, when we considered biomass per sampling unit (0.04 m2), the biomass of canopy-form-ing species was greater at Peizas and La Griega than at the remaincanopy-form-ing sites (SNK test: V: 16.2± 2.1 = RB: 15.1 ± 3.3 > P: 8.0 ± 1.7 = LG: 6.7 ± 0.7; p < 0.05).
In the control rock pools,S. muticum biomass differed among sites, but the a posteriori
multiple comparison SNK test did not identify any alternative pattern (ANOVA for sites: F3,8 = 8.05, p = 0.01;Table 1). Analysis ofS. muticum biomass per sampling unit (0.04 m2) revealed that biomass was greater at Peizas than at any other site (ANOVA: F3,8= 12.36, p = 0.002; SNK-test: P > LG = RB = V, p < 0.05). When the biomass of canopy, habitat-forming native species was combined with that ofS. muticum, biomass was found to be significantly greater in
control than in theS. muticum—removed pools (F1, 16= 4.90, p = 0.01), consistently across sites.
Eco-physiological response
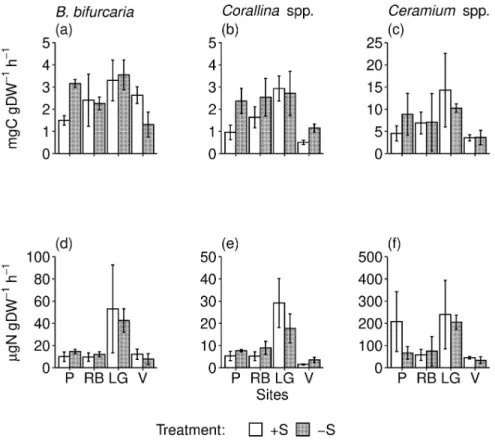
The gross primary production (GPP) was lower in individuals ofCorallina spp. and B. bifur-cata collected in the control (+S) than in the rock pools where S. muticum was removed (-S).
This pattern was consistent across sites for the former species, but it was significant only at the Peizas site for the latter species.Ceramium spp. did not show any significant effect (Fig 2A–2C
andTable 3). The pattern of response to the removal ofS. muticum for the rate of nitrogen
uptake was similar to that of GPP, but we did not identify any significant change (Table 3and
Fig 2D–2F). The GPP and nitrogen uptake rate ofS. muticum did not vary significantly
between sites (GLS2 model; F3,8= 0.48, p = 0.70 for GPP; F3,8= 1.31, p = 0.34 for nitrogen uptake rate after log-transformation).
The mg of13C-carbon and15N-nitrogen stored in the thalli also varied according to the removal ofS. muticum. The native species B. bifurcata and Corallina spp. retained significantly
more carbon and nitrogen in -S than +S rock pools at Peizas and consistently across sites, respectively.Ceramium spp. stored more nitrogen in +S pools at Peizas (Table 4andFig 3). The overall13C-carbon stored in the three native species was significantly higher in -S than in +S rock pools at Peizas site. These differences disappeared when the13C-carbon stored inS. muticum was included in the estimate (Table 4andFig 3). There was also an increase of the 13
C-carbon stored in the +S as compared to the -S rock pools at the site of Vidiago (Fig 3). The 15
N-nitrogen pool in both the assemblages of the three native species and of the three native + invasive species showed a the same trend observed for the13C-carbon (Fig 3). However, the statistical analysis did not identify any significant effect, probably due to high variability between rock pools (Table 4). The concentration of both13C-carbon and15N-nitrogen inS. muticum varied among sites (ANOVA model; F3,8= 4.79, p = 0.03; 4.84 p = 0.03 for13C and 15
N, respectively; data were log-transformed).A posteriori SNK test (p < 0.05) did not identify
any clear difference, although the accumulation was particularly low at Rocas Blancas (Fig 3). The cumulative % contribution to the13C-carbon and15N-nitrogen pools of native species (Corallina spp. and B. bifurcata) was higher in S. muticum—removed (-S) than control (+S)
Fig 2. Estimates of macroalgal physiological traits. Mean (SE) gross primary production (a-c) and nitrogen uptake
rate (d-f) of the 3 dominant native macroalgae inS. muticum—removed (-S) and control rock pools (+S) at each site
(P, RB, LG, V, as indicated inFig 1legend).
https://doi.org/10.1371/journal.pone.0217121.g002
Table 3. Parameter estimates of the GLS models and t-tests for gross primary production and nitrogen uptake rate of the native macroalgae.
B. bifurcata Corallina spp. Ceramium spp.
-Svs +S Mean (SE) t -Svs +S Mean (SE) t -Svs +S Mean (SE) t Gross Primary Production
Fit: GLS2 Fit: GLS2_red Fit: ANOVA_red^
P 1.66 (0.28) 5.94� 0.69(0.18) 3.73� 0.09 (0.22) 0.79
RB -0.14(1.21) -0.12
LG 0.25 (1.14) 0.22
V -1.32(0.67) -1.97
Nitrogen uptake rate
Fit: ANOVA^ Fit:ANOVA^ Fit: ANOVA_red^
P 0.34 (0.68) 0.51 0.61 (0.53) 0.27 0.44 (0.45) 0.97 RB 0.33 (0.68) -0.49 -0.44 (0.53) 0.42 LG 0.52 (0.68) 0.77 0.52 (0.53) 0.97 V -0.61 (0.68) -0.89 0.78 (0.53) 0.17 �: p<0.05 ^: log-transformed data
Table 3 legend. The t-test on least-square mean estimates betweenS. muticum—removed (-S) and control (+S) rock pools at each site (P, RB, LG, V, as indicated inFig 1
legend). “Fit” indicates the best-fit model (ANOVA: no variance structure; GLS2: residual variance varies with mean values of sites). When the interaction term of the best-fit model was not significant (p > 0.25), we used a reduced model with only the main factors (“_red” in Table).
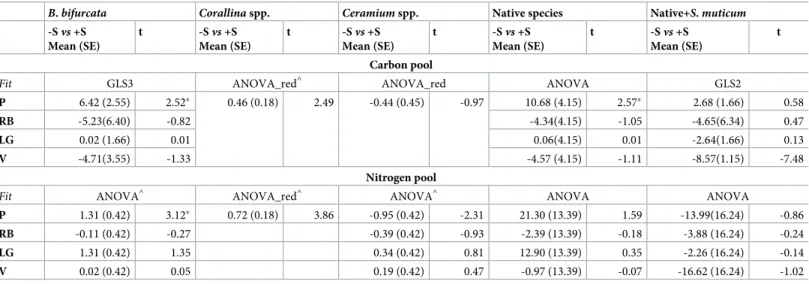
Table 4. Parameter estimates of the GLS models and t-tests for mg of13C-carbon and of15N-nitrogen stored in thalli.
B. bifurcata Corallina spp. Ceramium spp. Native species Native+S. muticum
-Svs +S Mean (SE) t -Svs +S Mean (SE) t -Svs +S Mean (SE) t -Svs +S Mean (SE) t -Svs +S Mean (SE) t Carbon pool
Fit GLS3 ANOVA_red^ ANOVA_red ANOVA GLS2
P 6.42 (2.55) 2.52� 0.46 (0.18) 2.49 -0.44 (0.45) -0.97 10.68 (4.15) 2.57� 2.68 (1.66) 0.58
RB -5.23(6.40) -0.82 -4.34(4.15) -1.05 -4.65(6.34) 0.47
LG 0.02 (1.66) 0.01 0.06(4.15) 0.01 -2.64(1.66) 0.13
V -4.71(3.55) -1.33 -4.57 (4.15) -1.11 -8.57(1.15) -7.48
Nitrogen pool
Fit ANOVA^ ANOVA_red^ ANOVA^ ANOVA ANOVA
P 1.31 (0.42) 3.12� 0.72 (0.18) 3.86 -0.95 (0.42) -2.31 21.30 (13.39) 1.59 -13.99(16.24) -0.86 RB -0.11 (0.42) -0.27 -0.39 (0.42) -0.93 -2.39 (13.39) -0.18 -3.88 (16.24) -0.24 LG 1.31 (0.42) 1.35 0.34 (0.42) 0.81 12.90 (13.39) 0.35 -2.26 (16.24) -0.14 V 0.02 (0.42) 0.05 0.19 (0.42) 0.47 -0.97 (13.39) -0.07 -16.62 (16.24) -1.02 �: p<0.05 ^: log-transformed data
Table 4 legend. The t-test was applied to the least-square mean estimates forS. muticum term (-S vs. +S) at each site (P, RB, LG, V, as indicated inFig 1legend). Results refer to the best-fit model (Fit), which varied among the response variables and was selected using AIC among the ANOVA and GLSs models (GLS2 = residual variance
related to sites; GLS3 = residual variance related toS. muticum × Site interaction term). When the interaction term of the best-fit model was not significant (p > 0.25),
we used a reduced model with only main factors (“_red” suffix).
https://doi.org/10.1371/journal.pone.0217121.t004
Fig 3. Macroalgal carbon and nitrogen pools. Mean (SE) mg13C-carbon and15N-nitrogen retained by the
assemblage of the 3 native species (B. bifurcata, Corallina spp and Ceramium spp.) and S. muticum. The average
contribution of each species to these pools is indicated in different colors. P, RB, LG, V, as indicated inFig 1legend.
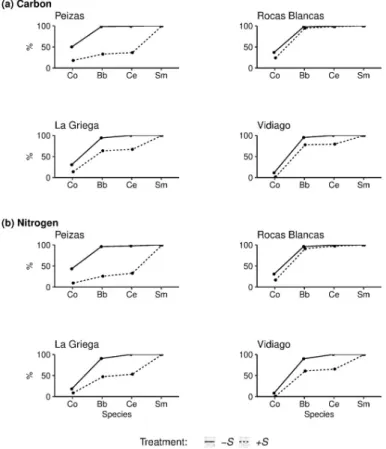
comparable to that of the two native species in the -S rock pools, except at Rocas Blancas whereS. muticum contribution was not relevant (Fig 4).
Discussion
Our experiment was designed to detect if the impact of the removal of the invasive seaweed
Sargassum muticum from rock intertidal pools could vary with the environmental setting
relate to an upwelling current that can brings nutrient-rich, cool seawater nearby the coast of north of Galicia [29]. Although there were no differences in daily average temperature when this study was done (March 2012), daily average temperature diverged in May and in summer. And the range of temperature was always larger at the sites in Asturias than at those in Galicia all-year-around during 2011 [30]. Moreover, air temperature and number of sun hours that differ among these regions can further affect the seawater temperature in rock pools during low tide [30]. Seawater nutrient concentration, instead, showed large spatial and temporal var-iability in agreement with the presence of local anthropogenic nitrogen sources rather than upwelling-driven nutrient concentrations all-year-around [46]. Therefore, the initial hypothe-sis that the impact ofS. muticum varied among sites according to the regions because of
nutri-ent-richer and warmer seawater in Galicia than Asturias could not be tested exhaustively, but we could expect differences between regions if thermal conditions were important.
Our findings indicated that the removal ofS. muticum changed some eco-physiological
traits of native species, independently of the region. The removal ofS. muticum increased both
gross primary production (the amount of carbon that a plant can fix in a given time) and car-bon storage capacity of the primary space-holder, turf-formingCorallina spp. consistently
across sites. It also increased the same eco-physiological traits in the canopy-forming brown seaweedB. bifurcata only at the site of Peizas. The eco-physiological traits linked to the
nitro-gen flow followed the same pattern, but the response was more variable and no clear patterns were identified. At Peizas site, seawater nutrient concentration was the lowest andS. muticum
biomass was the greatest in spring 2012, when the labeling experiment was done. It is possible that under low seawater nutrients, the removal of a large amount ofS. muticum rendered
avail-able nutrients for other competing species, likeB. bifurcata [47–49]. It is therefore possible that seawater nutrients can regulate the impact ofS. muticum, as expected initially, but further
evidence is needed.
A laboratory experiment found thatS muticum reduced the primary production (estimated
as percentage biomass change in the experiment) of native species, including the canopy-form-ing brown algaeFucus vesiculosus Linnaeus [50]. The authors attributed this negative impact
ofS. muticum to shading. Canopy-forming macroalgae, like S. muticum, can successfully
com-pete for light by forming a floating canopy that shade other underlying algae [22,47,51]. At greatS. muticum biomass, as at Peizas site, the invasive species biomass could shade not only
understorey, but also other canopy species, which is an alternative, non-exclusive explanation of the site-specific impact onB. bifurcata. Shading can have an intense impact on the
photo-synthesis of small-sized sub-canopy species of Corallinales in rock pools because individuals can have adapted metabolic processes such as ion transport or RUBISCO activity for photo-synthesis to the high irradiance of low tides [52]. Some corallinales can, however, adjust their photosynthesis to low irradiance [53] and there might be other, non-exclusive mechanisms explaining the negative effect ofS. muticum. For instance, daily fluctuation of pH, CO2and O2 are particularly large under algal canopy as a result of their metabolism (e.g. photosynthesis and respiration) and mechanical alteration of water flow [49]. This may greatly impact photo-synthesis and calcification of coralline-algae [54,55].
The physiological changes inCorallina spp. and B. bifurcata following the repeated
(monthly) removal ofS. muticum for over a year were not clearly reflected by changes in
bio-mass. The apparent mismatch between physiological and growth traits may be due to the tim-ing of the experiment. This experiment was carried out in March, at the beginntim-ing of theS. muticum growing season, which spans from January to September in this area. The large
can-opy is then lost through erosion and fragmentation [56]. During winter,S. muticum was
there-fore naturally absent from the rock pools and had only a slight effect on native species. We should also consider that, althoughS. muticum is regarded as an aggressive invader, its impact
on native macroalgal populations and assemblages in rock pools is variable, spanning from a moderate increase or decrease to substantial changes in biomass and in species diversity [27,57,58].
Some studies have proposed that a positive effect of invasive seaweeds on ecosystem func-tioning (productivity, respiration or light-use efficiency) is due to the sampling effect hypothe-sis [14,59]. This hypothesis applied to invasion advocates that when an invasive species establishes in the assemblage, there is a high probability of including a highly productive, dom-inant species in the community. As an alternative, native species with a long history of co-evo-lution may influence ecosystem processes through resource-use efficiency [60]. Our results showed both aspects could intertwine. The negative impact ofS. muticum on the gross primary
production of native species was associated with their reduced carbon storage capacity and with their contribution to assemblage-level functioning, especially at the site of Peizas. The
Fig 4. Cumulative contribution to carbon and nitrogen pools. Average percentage mg of13C-carbon (a) and of15
N-nitrogen (b) of the native species (Co =Corallina spp., Bb = Bifurcaria bifurcata, Ce = Ceramium spp.) and of the
invaderSargassum muticum (Sm) in control (+S) and S. muticum—removed (-S) rock pools at each site.
contribution ofS. muticum to ecosystem functioning was particularly important at this site
and counterbalanced the loss of functioning of native species, indicatingS. muticum could
impact resource-use efficiency. At the other sites, where there was less impact on native spe-cies,S. muticum contribution to functioning decreased according to its biomass (La
Griega > Vidiago > Rocas Blancas;Fig 4), corroborating the sampling effect hypothesis of including a dominant species [14,59]. Our initial hypothesis considered the impact of the pres-ence and not the abundance ofS. muticum. The role of S. muticum biomass in determining the
magnitude and direction of the impact on native species has been already recognized [27], but it should be better addressed in the context of ecosystem functioning and the management of native species control.
Invasive species are often competitively superior regarding growth or nutrient uptake [6,7]. Neither the gross primary production nor the carbon storage was greater inS. muticum than
in native species. The competitive capacity of invaders may decrease once the species has become established in the remaining native assemblage. Some researchers reported that in the invasive red algaeDasysiphonia japonica (Yendo) H.-S. Kim, the efficiency of taking up
nutri-ents decreased progressively during the process of invading a new community. When estab-lished, the invasive species reached an efficiency level close to that of the remaining native species [10]. In some areas of Portugal, whereS muticum has established since the 1980s,
nitro-gen uptake efficiency was found to be higher in the canopy-forming native speciesCystoseira humilis Schousboe ex Kuntzing than in S. muticum [61].
Conclusions
Biological invasions can modify native communities and ecosystems through complex pat-terns, acting first on the physiology and survival of individual organisms and, in turn, propa-gate their effects to community structure and ecosystem functioning through interactions with the environmental setting at different biological scales [3,16,51]. We showed that the impact of
S. muticum on the eco-physiology of native seaweeds propagated to assemblage-level
function-ing and that at the time of the year when the experiment was done the thermal conditions were unlikely to play a role in shaping native assemblage response. Invasive species biomass and nutrient availability might be important, but we need further evidence. Interestingly, we found that when the invasive species was removed, the remaining native species could recover their functional role, which might have implication for managing the control of established invasive species. Although forecasting invasion impact on ecosystem functioning is a major focus of ecological research and ecosystem management, we still lack knowledge about how physiological processes and species interactions may cause changes in ecosystem functioning. Our study findings highlighted the importance of including eco-physiological response to invasion for understanding, anticipating and perhaps mitigating the impacts of invasion on ecosystem functioning.
Supporting information
S1 Fig. Temperature and nutrient concentration. Average monthly values of seawater
tem-perature at high tide (n = 60) between November 2010 and September 2011 and seawater inor-ganic nutrients (n = 4) from autumn 2010 to spring 2012.
(TIF)
S2 Fig. Fluctuation of excess stable isotopes (E, as described inEq 2) in macroalgal thalli during the 4 days after the end of the incubation period. Mean (SE) % atoms of13C (a) and
of15N (b) in native macroalgae and in the invaderS. muticum.
(TIFF)
S3 Fig. Two-dimension non-metric multi dimensional scaling (nMDS). The ordination is
based on the triangular matrix derived from the Bray-Curtis index measuring differences in native species composition between macroalgal assemblages from control (+S) andS. muticum —removed rock pools (-S) at each of the four sites indicated in the graph. P = Peizas,
RB = Rocas Blancas, LG = La Griega and V = Vidiago. (TIF)
Acknowledgments
This research was supported by the Spanish Government through the Ministry of Science and Innovation-FEDER (project CGL2009-07205) and Xunta-FEDER de Galicia (ED431C 2017/ 46).
Author Contributions
Conceptualization: Francesca Rossi, Rosa M. Viejo, Celia Olabarria.
Data curation: Francesca Rossi, Linney Duarte, Fatima Vaz-Pinto, Ignacio Gestoso. Formal analysis: Francesca Rossi.
Funding acquisition: Francesca Rossi, Rosa M. Viejo, Celia Olabarria.
Investigation: Francesca Rossi, Linney Duarte, Fatima Vaz-Pinto, Ignacio Gestoso. Methodology: Francesca Rossi, Rosa M. Viejo, Celia Olabarria.
Project administration: Celia Olabarria.
Writing – original draft: Francesca Rossi, Celia Olabarria.
References
1. Vitousek PM. Biological invasions and ecosystem processes: Towards an integration of population biol-ogy and ecosystem studies. Oikos. 1990; 57: 7–13.https://doi.org/10.2307/3565731
2. Simberloff D, Parker IM, Windle PN. Introduced species policy, management, and future research needs. Front Ecol Environ. 2005; 3: 12–20.https://doi.org/10.1890/1540-9295(2005)003[0012: ISPMAF]2.0.CO;2
3. Simberloff D, Martin J-L, Genovesi P, Maris V, Wardle DA, Aronson J, et al. Impacts of biological inva-sions: what’s what and the way forward. Trends Ecol Evol. 2013; 28: 58–66.https://doi.org/10.1016/j. tree.2012.07.013PMID:22889499
4. Guy-Haim T, Lyons DA, Kotta J, Ojaveer H, Queiro´ s AM, Chatzinikolaou E, et al. Diverse effects of inva-sive ecosystem engineers on marine biodiversity and ecosystem functions: A global review and meta-analysis. Glob Change Biol. 2018; 24: 906–924.https://doi.org/10.1111/gcb.14007PMID:29211336
5. Vila M, Espinar JL, Hejda M, Hulme PE, Jarosik V, Maron JL, et al. Ecological impacts of invasive alien plants: a meta-analysis of their effects on species, communities and ecosystems. Ecol Lett. 2011; 14: 702–708.https://doi.org/10.1111/j.1461-0248.2011.01628.xPMID:21592274
6. Pysek P, Jarosik V, Hulme PE, Pergl J, Hejda M, Schaffner U, et al. A global assessment of invasive plant impacts on resident species, communities and ecosystems: the interaction of impact measures, invading species’ traits and environment. Glob Change Biol. 2012; 18: 1725–1737.https://doi.org/10. 1111/j.1365-2486.2011.02636.x
7. Davidson A, Jennions M, Nicotra A. Do invasive species show higher phenotypic plasticity than native species and, if so, is it adaptive? A meta-analysis. Ecol Lett. 2011; 14: 419–431.https://doi.org/10. 1111/j.1461-0248.2011.01596.xPMID:21314880
8. Hulme PE, Pysek P, Jarosik V, Pergl J, Schaffner U, Vila M. Bias and error in understanding plant inva-sion impacts. Trends Ecol Evol. 2013; 28: 212–218.https://doi.org/10.1016/j.tree.2012.10.010PMID:
23153723
9. Berthon K. How do native species respond to invaders? Mechanistic and trait-based perspectives. Biol Invasions. 2015; 17: 2199–2211.https://doi.org/10.1007/s10530-015-0874-7
10. Ramsay-Newton C, Drouin A, Hughes AR, Bracken MES. Species, community, and ecosystem-level responses following the invasion of the red alga Dasysiphonia japonica to the western North Atlantic Ocean. Biol Invasions. 2017; 19: 537–547.https://doi.org/10.1007/s10530-016-1323-y
11. Stachowicz J, Terwin J, Whitlatch R, Osman R. Linking climate change and biological invasions: Ocean warming facilitates nonindigenous species invasions. Proc Natl Acad Sci U S A. 2002; 99: 15497– 15500.https://doi.org/10.1073/pnas.242437499PMID:12422019
12. Walther GR, Roques A, Hulme PE, Sykes MT, Pysek P, Kuhn I, et al. Alien species in a warmer world: risks and opportunities. Trends Ecol Evol. 2009; 24: 686–693.https://doi.org/10.1016/j.tree.2009.06. 008PMID:19712994
13. Olabarria C, Arenas F, Viejo RM, Gestoso I, Vaz-Pinto F, Incera M, et al. Response of macroalgal assemblages from rockpools to climate change: effects of persistent increase in temperature and CO2.
Oikos. 2013; 122: 1065–1079.https://doi.org/10.1111/j.1600-0706.2012.20825.x
14. Vye SR, Emmerson MC, Arenas F, Dick JTA, O’Connor NE. Stressor intensity determines antagonistic interactions between species invasion and multiple stressor effects on ecosystem functioning. Oikos. 2015; 124: 1005–1012.https://doi.org/10.1111/oik.01583
15. Blackburn TM, Essl F, Evans T, Hulme PE, Jeschke JM, Kuhn I, et al. A Unified Classification of Alien Species Based on the Magnitude of their Environmental Impacts. PLoS Biol. 2014;12.https://doi.org/ 10.1371/journal.pbio.1001850PMID:24802715
16. Reichard M, Douda K, Przybylski M, Popa OP, Karbanova E, Matasova K, et al. Population-specific responses to an invasive species. Proc R Soc B-Biol Sci. 2015; 282: 167–174.https://doi.org/10.1098/ rspb.2015.1063PMID:26180070
17. Liao CZ, Peng RH, Luo YQ, Zhou XH, Wu XW, Fang CM, et al. Altered ecosystem carbon and nitrogen cycles by plant invasion: a meta-analysis. New Phytol. 2008; 177: 706–714.https://doi.org/10.1111/j. 1469-8137.2007.02290.xPMID:18042198
18. Schramski JR, Dell AI, Grady JM, Sibly RM, Brown JH. Metabolic theory predicts whole-ecosystem properties. Proc Natl Acad Sci USA. 2015; 112: 2617–2622.https://doi.org/10.1073/pnas.1423502112
PMID:25624499
19. Chan FT, Briski E. An overview of recent research in marine biological invasions. Mar Biol. 2017; 164: 121.https://doi.org/10.1007/s00227-017-3155-4PMID:28579642
20. Eno NC. Non-native marine species in British waters: Effects and controls. Aquat Conserv-Mar Freshw Ecosyst. 1996; 6: 215–228. https://doi.org/10.1002/(SICI)1099-0755(199612)6:4%3C215::AID-AQC191%3E3.0.CO;2-Q
21. Nyberg CD, Wallentinus I. Can species traits be used to predict marine macroalgal introductions? Biol Invasions. 2005; 7: 265–279.https://doi.org/10.1007/s10530-004-0738-z
22. Schaffelke B, Hewitt CL. Impacts of introduced seaweeds. Bot Mar. 2007; 50: 397–417.https://doi.org/ 10.1515/bot.2007.044
23. Thomsen MS, Wernberg T, South PM, Schiel DR. To include or not to include (the invader in community analyses)? That is the question. Biol Invasions. 2016; 18: 1515–1521. https://doi.org/10.1007/s10530-016-1102-9
24. Pe´rez-Cirera JL, Cremades J, Barbara I. Precisiones sistema´ ticas y sinecolo´gicas sobre algunas algas nuevas para Galicia o para las costas atla´nticas de la Penı´nsula Ibe´rica. An Jardin Bot Madrid. 1989; 46: 35–45.
25. Rull Lluch J, Gomez Garreta A, Ribeira MA, Barcelo MC. Mapas de distribucio´n de algas marinas de la Penı´nsula Ibe´rica e Islas Baleares. VII. Cystoseira C. Agardh (Grupo C. baccata) y Sargassum C. Agardh (S. muticum y S. vulgare). Bot Complut. 1994; 19: 131–138.
26. Cacabelos E, Olabarria C, Viejo RM, Rubal M, Veiga P, Incera M, et al. Invasion of Sargassum muticum in intertidal rockpools: Patterns along the Atlantic Iberian Peninsula. Mar Environ Res. 2013; 90: 18–26.
https://doi.org/10.1016/j.marenvres.2013.05.008PMID:23764086
27. Engelen AH, Serebryakova A, Ang P, Britton-Simmons K, Mineur F, Pedersen MF, et al. Circumglobal invasion by the brown seaweed Sargassum muticum. In: Hughes RN, Hughes DJ, Smith IP, Dale AC, editors. Oceanogr Mar Biol. 2015. pp. 81–126. Available:<Go to ISI>://WOS:000364174100003 28. Tuya F, Cacabelos E, Duarte P, Jacinto D, Castro JJ, Silva T, et al. Patterns of landscape and
assem-blage structure along a latitudinal gradient in ocean climate. Mar Ecol Prog Ser. 2012; 466: 9–19.
29. Botas J, Fernandez E, Bode A, Anadon R. A persistent upwelling off the Central Cantabrian Coast (Bay of Biscay). Estuar Coast Shelf Sci. 1990; 30: 185–199.https://doi.org/10.1016/0272-7714(90)90063-W
30. Llope M, Anadon R, Viesca L, Quevedo M, Gonzalez-Quiros R, Stenseth NC. Hydrography of the southern Bay of Biscay shelf-break region: Integrating the multiscale physical variability over the period 1993–2003. J Geophys Res-Oceans. 2006;111.https://doi.org/10.1029/2005jc002963
31. Dawson TE, Mambelli S, Plamboeck AH, Templer PH, Tu KP. Stable isotopes in plant ecology. Annu Rev Ecol Syst. 2002; 33: 507–559.
32. Werner C, Schnyder H, Cuntz M, Keitel C, Zeeman MJ, Dawson TE, et al. Progress and challenges in using stable isotopes to trace plant carbon and water relations across scales. Biogeosciences. 2012; 9: 3083–3111.https://doi.org/10.5194/bg-9-3083-2012
33. Middelburg JJ. Stable isotopes dissect aquatic food webs from the top to the bottom. Biogeosciences. 2014; 11: 2357–2371.https://doi.org/10.5194/bg-11-2357-2014
34. Mateo MA, Renom P, Hemminga MA, Peene J. Measurement of seagrass production using the13C
sta-ble isotope compared with classical O2and 14
C methods. Mar Ecol Prog Ser. 2001; 223: 157–165.
https://doi.org/10.3354/meps223157
35. Miller HL, Dunton KH. Stable isotope (C13) and O2 micro-optode alternatives for measuring photosyth-esis in seaweeds. Mar Ecol Prog Ser. 2007; 329: 85–97.https://doi.org/10.3354/meps329085
36. Naldi M, Wheeler PA. 15N measurements of ammonium and nitrate uptake by Ulva fenestrata (chloro-phyta) and Gracilaria pacifica (Rhodo(chloro-phyta): Comparison of net nutrient disappearance, release of ammonium and nitrate, and 15N accumulation in algal tissue. J Phycol. 2002; 38: 135–144.https://doi. org/10.1046/j.1529-8817.2002.01070.x
37. Wang C, Lei AP, Zhou K, Hu ZY, Hao WL, Yang JD. Growth and Nitrogen Uptake Characteristics Reveal Outbreak Mechanism of the Opportunistic Macroalga Gracilaria tenuistipitata. PLoS ONE. 2014;9.https://doi.org/10.1371/journal.pone.0108980PMID:25299123
38. Bodey W, Bearhop S, McDonald RA. Invasions and stable isotope analysis–informing ecology and management. In: Veitch CR, Clout MN, Towns DR, editors. Island invasives: eradication and manage-ment. Switzerland: IUNC Gland; 2011. pp. 148–151.
39. Jackson MC, Donohue I, Jackson AL, Britton JR, Harper DM, Grey J. Population-Level Metrics of Tro-phic Structure Based on Stable Isotopes and Their Application to Invasion Ecology. PLoS ONE. 2012;7.
https://doi.org/10.1371/journal.pone.0031757PMID:22363724
40. Stephens TA, Hepburn CD. A kelp with integrity: Macrocystis pyrifera prioritises tissue maintenance in response to nitrogen fertilisation. Oecologia. 2016; 182: 71–84. https://doi.org/10.1007/s00442-016-3641-2PMID:27170330
41. Rossi F, Vos M, Middelburg J. Species identity, diversity and microbial carbon flow in reassembling macrobenthic communities. Oikos. 2009; 503–512.https://doi.org/10.1111/j.1600-0706.2009.17112.x
42. Rossi F, Incera M, Callier M, Olabarria C. Effects of detrital non-native and native macroalgae on the nitrogen and carbon cycling in intertidal sediments. Mar Biol. 2011; 158: 2705–2715.https://doi.org/10. 1007/s00227-011-1768-6
43. Anderson MJ. A new method for non-parametric multivariate analysis of variance. Austral Ecol. 2001; 26: 32–46.https://doi.org/10.1111/j.1442-9993.2001.01070.pp.x
44. Zuur AF, Ieno EN, Walker N, Saveliev AA, Smith GM. Mixed effects models and extensions in ecology with R [Internet]. USA: Springer, New York, NY; 2009. Available: https://doi.org/10.1007/978-0-387-87458-6
45. Crawley MJ. The R book. 2nd ed. Wiley; 2009.
46. Viana IG, Bode A. Stable nitrogen isotopes in coastal macroalgae: Geographic and anthropogenic vari-ability. Sci Total Environ. 2013; 443: 887–895.https://doi.org/10.1016/j.scitotenv.2012.11.065PMID:
23247291
47. Armitage CS, Husa V, Petelenz-Kurdziel EA, Sjotun K. Growth and competition in a warmer ocean: a field experiment with a non-native and two native habitat-building seaweeds. Mar Ecol Prog Ser. 2017; 573: 85–99.https://doi.org/10.3354/meps12161
48. Pedersen MF, Borum J. Nutrient control of algal growth in estuarine waters. Nutrient limitation and the importance of nitrogen requirements and nitrogen storage among phytoplankton and species of macro-algae. Mar Ecol Prog Ser. 1996; 142: 261–272.https://doi.org/10.3354/meps142261
49. Hurd CL, Harrison PJ, Biscoff K, Lobban CS. Seaweed Ecology and Physiology. Cambridge University Press; 2014.
50. Salvaterra T, Green DS, Crowe TP, O’Gorman EJ. Impacts of the invasive alga Sargassum muticum on ecosystem functioning and food web structure. Biol Invasions. 2013; 15: 2563–2576.https://doi.org/10. 1007/s10530-013-0473-4
51. Levine JM, Vila M, D’Antonio CM, Dukes JS, Grigulis K, Lavorel S. Mechanisms underlying the impacts of exotic plant invasions. Proc R Soc B-Biol Sci. 2003; 270: 775–781.https://doi.org/10.1098/rspb. 2003.2327PMID:12737654
52. Guenther RJ, Martone PT. Physiological performance of intertidal coralline algae during a simulated tidal cycle. J Phycol. 2014; 50: 310–321.https://doi.org/10.1111/jpy.12161PMID:26988188
53. Egilsdottir H, Olafsson J, Martin S. Photosynthesis and calcification in the articulated coralline alga Elli-solandia elongata (Corallinales, Rhodophyta) from intertidal rock pools. Eur J Phycol. 2016; 51: 59–70.
https://doi.org/10.1080/09670262.2015.1101165
54. Tait LW. Impacts of natural and manipulated variations in temperature, pH and light on photosynthetic parameters of coralline-kelp assemblages. J Exp Mar Biol Ecol. 2014; 454: 1–8.https://doi.org/10. 1016/j.jembe.2014.01.016
55. Cornwall C, Pilditch C, Hepburn C, Hurd C. Canopy macroalgae influence understorey corallines’ meta-bolic control of near-surface pH and oxygen concentration. Mar Ecol Prog Ser. 2015; 525: 81–95.
https://doi.org/10.3354/meps11190
56. Wernberg T, Thomsen MS, Staehr PA, Pedersen MF. Comparative phenology of Sargassum muticum and Halidrys siliquosa (Phaeophyceae: Fucales) in Limfjorden, Denmark. Bot Mar. 2001; 44: 31–39.
https://doi.org/10.1515/bot.2001.005
57. Sanchez I, Fernandez C, Arrontes J. Long-term changes in the structure of intertidal assemblages after invasion by Sargassum muticum (Phaeophyta). J Phycol. 2005; 41: 942–949.https://doi.org/10.1111/j. 1529-8817.2005.00122.x
58. Viejo RM. The effects of colonization by Sargassum muticum on tidepool macroalgal assemblages. J Mar Biol Assoc U K. 1997; 77: 325–340.https://doi.org/10.1017/s0025315400071708
59. Vaz-Pinto F, Olabarria C, Arenas F. Ecosystem functioning impacts of the invasive seaweed Sargas-sum muticum (Fucales, Phaeophyceae). J Phycol. 2014; 50: 108–116.https://doi.org/10.1111/jpy. 12136PMID:26988012
60. Flombaum P, Aragon R, Chaneton EJ. A role for the sampling effect in invaded ecosystems. Oikos. 2017; 126: 1229–1232.https://doi.org/10.1111/oik.04221
61. Vaz-Pinto F, Martinez B, Olabarria C, Arenas F. Neighbourhood competition in coexisting species: The native Cystoseira humilis vs the invasive Sargassum muticum. J Exp Mar Biol Ecol. 2014; 454: 32–41.