This document is an extract from the PhD thesis entitled “Can satellites help
organic crops certification?”, pages 26-40, Antoine DENIS, 2018, ULIEGE,
https://orbi.uliege.be/handle/2268/226209
.
This extract presents 2 sub-sections of the literature review dedicated to:
3.3.1 Remote sensing of crops: the main principles
26 3 Literature review
3.3 Remote sensing for crop monitoring
3.3.1 Remote sensing of crops: the main principles
Remote sensing is the technique of acquiring spectral information on an object, typically a piece of
earth surface, with a sensor distant from the object, typically on board on a satellite, an airplane, and more recently an UAV.
Remote sensing has been widely used since the seventies to characterize and monitor earth surface and atmosphere and in particular the natural and agricultural vegetation.
Applied to agriculture, remote sensing techniques can be useful for a variety of purposes, among
which the main ones are, parcel boundary detection, crop recognition, crop area estimation, and, in the context of precision agriculture, crop growth monitoring, the computation of various soil and crop biochemical and biophysical properties that may induce or be indicative of plant stress that may be used for site-specific management recommendations concerning crop fertilization, irrigation, protection (insect and fungal infestation), weed management, or incorporated into crop yield and production forecasting models.
Spectral remote sensing technique is based on the principle that the solar electromagnetic
radiation (EMR) is either absorbed, transmitted, or reflected by the studied surface, and that the pattern of the reflected part, as recorded by an optical sensor, is directly dependent on the surface properties, i.e. the particular material (vegetation, soil, rock,…), its physical (e.g. plant and canopy structure) and chemical (e.g. plant nitrogen, chlorophyll and water content) state, and can consequently be used for its characterization.
The most relevant spectral range for the study of the vegetation consider wavelengths in the
[350-2500 nm] range, including the visible (VIS, 380-750 nm), near-infrared (NIR, 750-1400 nm) and a part of the short-wavelength infrared (SWIR, 1400-3000 nm). However, given atmospheric water vapor highly disrupt the solar EMR around 1400 nm, 1900 nm and 2500 nm spectral regions, the
later are not usable for sensors operating in outdoor conditions (i.e. by satellite or airborne sensors) (Figure 3-a-b-c-e). The thermal infrared spectral range (TIR, 3000-15000 nm) is also used in order to characterize the vegetation surface temperature.
Aside from spectral remote sensing, RADAR remote sensing, considering wavelengths in the
approximate range of 1 cm to 1 m and self-emitting the energy it uses, can also be useful to characterize vegetation surface, but won’t however be considered in this study.
Spectral remote sensors can be of 2 types, multispectral, or hyperspectral, though the latter is
currently scarcely represented on satellite. While multispectral sensors delivers a few (3 to ~10) broad (~20 to 250 nm wavelength width) spectral bands, hyperspectral delivers a high number (~ 60 to 500) of contiguous narrow (~10 - 20 nm wavelength width) spectral bands.
The variation of reflectance (the reflected EMR/incoming EMR ratio), from a particular land cover with respect to wavelengths constitutes its spectral signature (Figure 2) and may enable its
differentiation from another land cover type and/or state (Figure 2 and Figure 3).
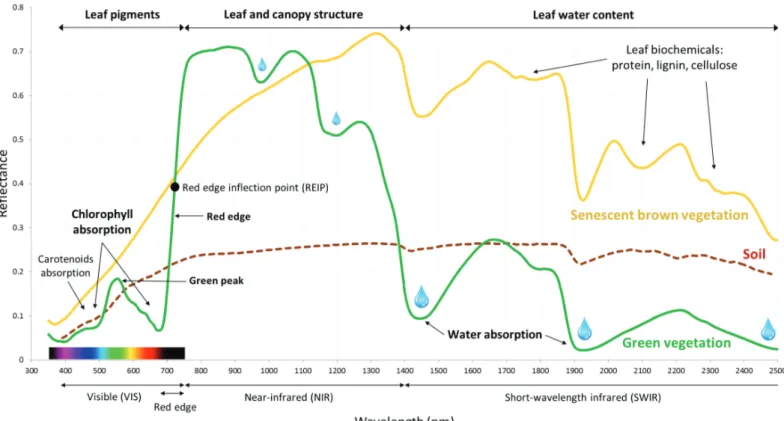
Healthy green vegetation provides a characteristic spectral signature (green spectrum in Figure 2)
that presents a low reflectance in the visible part of the spectrum, also known as the
Photosynthetically Active Radiation (PAR), due to a strong EMR absorption used for photosynthesis. In particular, while leaf pigments are responsible for a part of this absorption, with chlorophyll a and b absorbing EMR in the blue (~400-500 nm) and red (~600-700 nm) regions, and carotenoids absorbing EMR in the blue region principally, the green light (500 to 600 nm) is relatively less absorbed, which results in a reflectance peak in the green surrounded by reflectance depressions in the blue and red regions, reason why the green vegetation appears “green”. The important reflectance rise in the transition zone between the VIS and the NIR correspond to the so called “red-edge” (~680-750 nm). The NIR region is characterized by a relatively high reflectance,
also known as the “NIR plateau”, due to a small EMR absorption and high EMR scattering, which is mainly controlled by structural parameters of the vegetation cells, leaves and canopies (Asner, 1998; Knipling, 1970; Mohammed et al., 2000). The SWIR region presents an intermediate
reflectance featuring 3 spectral regions (around 1450 nm, 1950 nm and 2500 nm) importantly impacted by water absorption related to leaf water content.
Crop spectral signature is influenced by a complex interaction of numerous factors, sometimes
interdependent, that relate to crop type and development, management, environmental and measuring conditions (Figure 3).
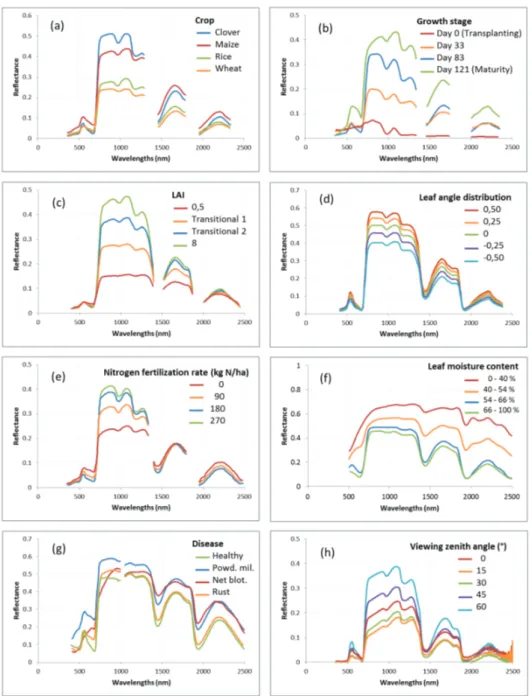
Evidently, different crops may present different spectral signatures (Figure 3-a). This also holds
true, but to a lesser extent, for different crop varieties that may differ in phenology timing (early senescing vs stay green), height, or even ability to extract nutrients, to compete with weeds, resist to disease,…
Crop growth stages (Figure 3-b) directly condition the canopy closure (ground cover), the
proportion of non-photosynthetic background such as soil and litter visible on a remote sensed image, the crop physiological evolution (green till senescent), all of these strongly impacting the crop reflectance. Crop emergence mark the apparition of the green reflectance peak, biomass development contributes to a general reflectance increase in the NIR and SWIR regions, and crop maturity, accompanied by senescence process, result in a general reflectance increase throughout the 350-2500 spectral range, with in particular, in the visible, a relatively more important increase in the red region.
The crop canopy density is often characterized by the LAI, the one-sided canopy green leaf area
per unit ground surface area (Watson, 1947 in Xavier and Vettorazzi, 2004) (Figure 3-c). Higher LAI contributes to a very clear reflectance increase in the NIR, and to a lesser extent in the SWIR1 (1400-1900 nm), while presenting a very limited and often inconsistent variation in SWIR2
(1900-28 3 Literature review
reflectance decrease in the red, LAI > ~2 is often reported as not impacting anymore the visible range (saturation), despite various patterns are found in the literature (Asner, 1998; Darvishzadeh et al., 2008; Daughtry et al., 2000; Jacquemoud et al., 2009).
The leaf inclination is another canopy structure parameter highly impacting its spectral response,
with planophile leaves presenting higher reflectance in the whole 350-2500 nm spectral range compared to erectophile ones (Punalekar et al., 2016) (Figure 3-d).
Various crop stresses, nutrients, water or diseases related, may also considerably impact the crop
reflectance. A stressed crop will very typically present a generalized higher reflectance in the VIS induced by a reduction of leaf photosynthetic pigment concentration, particularly chlorophyll, resulting in a reduction of the photosynthetic activity (Ashraf and Harris, 2013). While healthy vegetation presents a lower green reflectance peak corresponding to a darker green, a moderately stressed vegetation often presents an increased green reflectance peak corresponding to lighter green vegetation, and a more severe stress results in a relatively more important reflectance increase in the yellow and red regions, which is responsible for the typical yellowing of stressed crops.
A nitrogen stressed crop (Figure 3-e) has the particularity to present a marked lower reflectance in
the NIR, mainly due to a lower biomass development, and, in the SWIR, a higher reflectance is observed only in case of important nitrogen deficiency with the SWIR2 showing a more important increase than SWIR1 in some references (Feng et al., 2008; Guo et al., n.d.; Ranjan et al., 2012). A phosphorous stress is reported to result, for some crops, in a purple tint of the leaves, leaf
sheathes or stems (Chen et al., 2014; Osborne et al., 2002a; YARA crop Nutrition, n.d.) which is mainly due to an increase of the production of anthocyanin (Marschner, 1995 in S. L. Osborne et al., 2002) that is responsible for a strong absorption of the green light, while causing very slight or no absorption of the blue and red light respectively.
While a relatively moderate hydric stress typically results in a global reflectance increase
throughout the 350-2500 nm spectral range compared to well-watered vegetation, along with the attenuation of the water absorption features in the SWIR, a particularly severe hydric stress
(senescent vegetation) may finally result in a reflectance decrease in the first part of the NIR and reveal, in the SWIR, absorption features related to other leaf biochemical such as protein, lignin and cellulose (Figure 2 and Figure 3-f) (Bayat et al., 2016; Hoffer and Johannsen, 1969; Kokaly et al., 2017; Yu, 2000; Zygielbaum, 2009).
Diseases (Figure 3-g) may impact the VIS-NIR-SWIR-TIR spectral range, with, for example, the
following behavior observed: a green reflectance decrease and blue and red reflectance stability (Apan et al., 2004), a red increase and blue-green increase or decrease (Mahlein, 2016), a NIR increase (Mahlein, 2016), decrease or stability (Kuska et al., 2015) and decrease (Apan et al., 2004; Muhammed, 2005), a SWIR increase (Apan et al., 2004; Mahlein, 2016), and a TIR increase in (Falkenberg et al., 2007; Nicolas, 2004).
Measuring conditions and in particular the solar and sensor viewing zenith angle and their relative azimuth angle, as well as the topographic configuration of the area and related field slope
orientation, also strongly impact crop reflectance given its highly anisotropic behavior (Figure 3-h). The relative orientation of crop rows is another geometrical parameter that may also impact crop
reflectance, depending on the type and development of the crop canopy (space between consecutive rows, canopy closure level and crop height).
Atmospheric conditions are another source of reflectance variation, though “atmospheric
Figure 2 : Dominant factor controlling leaf reflectance. Vegetation spectra correspond to bundles of leaves and stems of Spartina alterniflora, a
wetland perennial grass, from Kokaly et al. (2017). Soil spectrum from Clark (1999). Figure adapted from Kokaly et al. (1998), Bowker et al. (1985), Curran (1989) and Thenkabail et al. (2013).
32 3 Literature review
Figure 3 : Variation of vegetation reflectance for some parameters.
(i) Reflectance measured 3 cm above plants of fields of various crops (maize, rice, clover and
wheat) at maximum vegetative growth stage, adapted from Arafat et al. (2013).
(ii) Reflectance measured for a paddy rice field at several growth stages (from transplanting
to maturity), adapted from Qi et al. (2011).
(iii) Canopy reflectance simulated with SAIL model (Verhoef, 1984) for various LAI, adapted
from Asner (1998).
(iv) Canopy reflectance simulated with PROSAIL model (Jacquemoud et al., 2009) for various leaf angle distribution (LIDFa parameter - Leaf Inclination Distribution Function, values
ranging from-1.0 for completely erectophile leaves to 1.0 for completely planophile leaves), adapted from Punalekar et al. (2016).
(v) Reflectance measured 1 meter above wheat field canopy at booting growth stage for
various mineral nitrogen (urea) fertilization rates, adapted from Feng et al. (2008).
(vi) Reflectance measured for maize leaves at various moisture levels in laboratory, adapted
from Hoffer and Johannsen (1969).
(vii) Reflectance measured on barley leaves affected by various diseases (net blotch, rust,
powdery mildew), adapted from Mahlein (2016).
(viii) Reflectance measured 40 cm above lawn grass canopy for various viewing zenith angles
in the forward scattering direction of the illumination source principal plane (azimuth angle = 0°), with a 30° illumination zenith angle, in laboratory, adapted from Roosjen et al. (2012).
34 3 Literature review
3.3.2 Remote sensing of crop properties
Remote sensing has been used to assess numerous crop properties that can be subdivided in 2
main categories, i.e. the biochemical crop properties, related to crop chemical elements content,
and the biophysical crop properties, related to crop biomass and canopy structure as detailed in
Alchanatis and Cohen (2012), Gitelson (2012), Roberts et al. (2012) and Thenkabail et al. (2012).
Biochemical crop properties include principally pigments content, i.e. chlorophyll (total, -a, -b),
carotenoid, ratio carotenoid/chlorophyll and anthocyanin content, whose relative concentrations will directly impact crop color, nitrogen and crude protein content, content in plant structural materials, i.e. lignin and cellulose, water content and starch content.
Biophysical crop properties include ground cover (also called canopy cover, green cover,
vegetation fraction, fraction cover (FCOVER)), total or green Leaf Area Index (LAI), specific leaf area (the one-sided area of the leaf divided by the dry weight of the leaf), above ground biomass (wet or dry, total or leaf), canopy volume, plant height, flowering intensity, grain and biomass yield, Fraction of Absorbed Photosynthetically Active Radiation (fAPAR), crop growth stage and phenology.
The retrieval of crop properties from reflectance faces 2 major limitations, i.e. (i) that reflectance
generally tend to saturate (to be insensitive) at low or high level of a given crop property (e.g. high
chlorophyll content), and (ii) that reflectance is the result of a complex interaction of numerous factors that relate to crop type and development, management, environmental and measuring conditions (confer previous section 3.3.1) that may impact the reflectance the same way and may consequently act as “confounding effects” in attempt of a specific crop properties retrieval.
The estimation of these crop properties from spectral remote sensing information can be done via 2 distinct approaches: (i) the widely used empirical statistical modeling, based on regression
between spectral bands or “Spectral Vegetation Indices” (SVI) and the crop properties of interest, or (ii) the less used physical modeling which consists in applying Radiative Transfer Models (RTM)
based on physical laws.
Vegetation Indices (VI) combine the reflectance of 2 or more wavelengths in order to maximize
their sensitivity to the biochemical or biophysical crop property of interest while minimizing external variation factors (Daughtry et al., 2000) and often integer a wavelength sensitive to the crop property of interest and another one insensitive. These indices may take the form of
difference, simple ratio, normalized difference, linear combination, derivative, combination of several indices,...
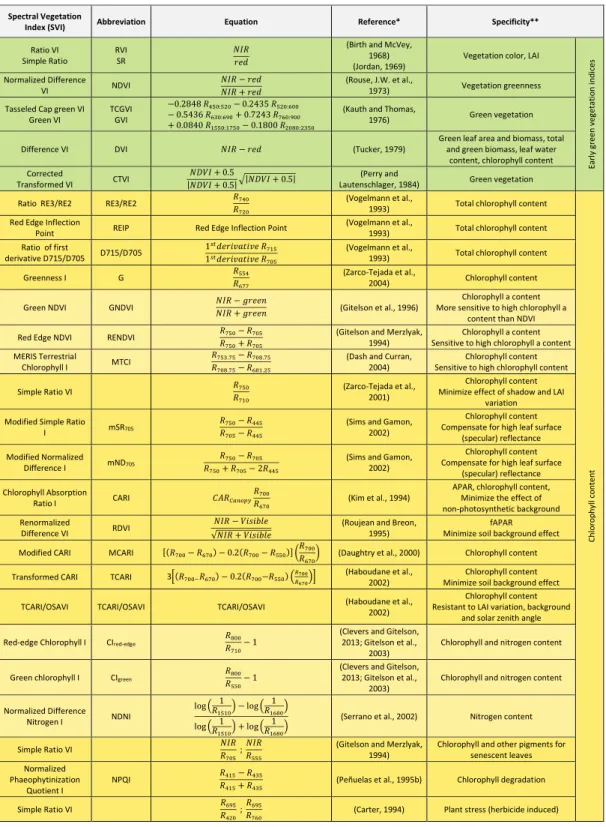
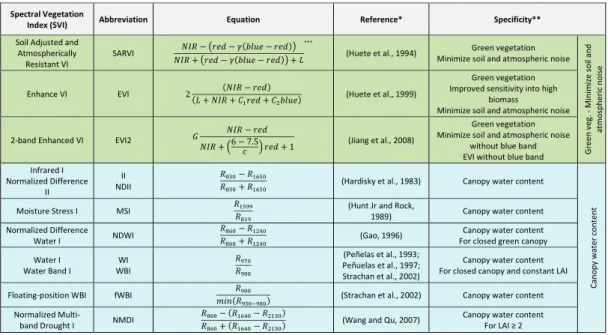
Table 2 presents a non-exhaustive list of some of the main vegetation indices among the numerous developed ones, regrouped by the vegetation properties for the assessment of which they were initially developed and other specificities.
Early remote sensed vegetation indices were used to identify the wider “green vegetation” and its
“condition”. They usually took advantage of the very specific vegetation spectral signature by
combining a red spectral band related to the strong EMR absorption by chlorophyll with a NIR spectral band characterized by high reflectance scattering.
Later existing and newly developed VI were used to assess more specific vegetation biochemical and biophysical properties.
Numerous VI are dedicated to the assessment of the canopy chlorophyll content which is
considered as an indicator of vegetation health, vigor and photosynthetic activity, and also as a proxy for vegetation nitrogen nutrition status and content since leaf chlorophyll content is mainly determined by nitrogen availability (Filella et al., 1995). While VI using the red and NIR spectral bands, such as NDVI, were observed to saturate from very low chlorophyll content, VI indices replacing the red by the green or red-edge, or adding a red-edge to red and NIR spectral bands, showed a higher sensitivity to high chlorophyll content (Dash and Curran, 2004; Gitelson et al., 1996; Gitelson and Merzlyak, 1994). Another challenge of chlorophyll VI is to minimize their sensitivity to LAI, as, according to Daughtry et al. (2000), the relatively subtle differences in canopy reflectance associated with changes in leaf chlorophyll are often confounded with major changes in plant growth and development.
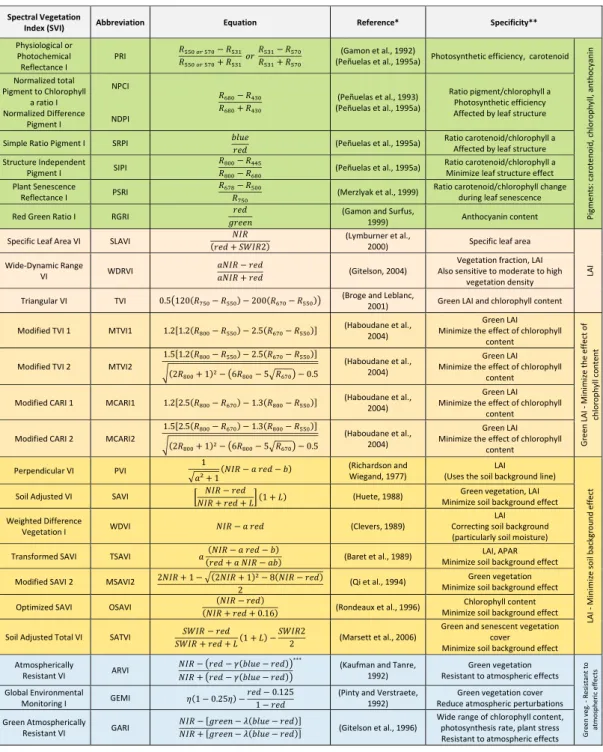
A few VI were elaborated for the assessment of other vegetation pigments, and especially the
carotenoids/chlorophyll ratio which is indicative of the photosynthetic efficiency and chlorophyll
degradation induced by senescence or plant stress. Some of these indices combine a spectral band in the 550 - 740 nm spectral range, where reflectance increase with chlorophyll degradation, with a spectral band in the 400 - 500 nm spectral range where reflectance remains low, due to retention of carotenoids (Merzlyak et al., 1999; Peñuelas et al., 1995a).
Vegetation indices used for LAI assessment are based on a combination of the red and NIR spectral
bands, the later continuing to be sensitive even at moderate-to-high vegetation density (LAI from 2 to 6) in crops (Gitelson, 2004) (Figure 3-c). However, basic LAI index such as NDVI approaches saturation asymptotically under conditions of moderate-to-high aboveground biomass, typically from LAI of 2 or 3 (Gitelson, 2004; Haboudane et al., 2004). Various advanced LAI VI try to minimize the disrupting sensitivity to chlorophyll content while maximizing the sensitivity to high LAI, and often include an additional green spectral band. Nguy-Robertson et al. (2012) observed that the combination of VI highly sensitive to Green LAI at low to moderate or moderate to high GLAI ranges enabled to accurately assess GLAI across its entire range of variability.
A series of vegetation indices, also designed for the assessment of the green vegetation, LAI, APAR or chlorophyll content, present the specificity of minimizing the soil background or/and atmospheric disruptive effects on vegetation reflectance. Those minimizing soil background effect
(impact on reflectance of the non-photosynthetic materials background such as soil and leaf litter) rely on the addition of a “soil brightness correction factor” and are intended to be used in
36 3 Literature review
correction is based on the principle of using the blue spectral band for correction of the atmospheric effect on the red spectral band (Huete et al., 1999; Kaufman and Tanre, 1992). Finally a series of indices were specifically developed to assess the canopy water content. These
indices typically combine a wavelength of the 800-900 nm spectral region of the NIR, relatively insensitive to canopy water content, with another wavelength in the NIR around 970 nm or 1200 nm, or in the SWIR, corresponding to water absorption and consequently sensitive to canopy water content.
Regarding the relative efficiency of different types of sensors for crop properties assessment, hyperspectral sensors are often found more efficient than multispectral ones (Hansen and
Schjoerring, 2003; Liu et al., 2012; Thenkabail et al., 2004) due to their narrow and numerous spectral bands, despite equivalent efficiency is sometimes observed as in Goel et al. (2003). TIR
sensors present the disadvantage of being sensitive to ambient temperature and wind speed (Mahlein, 2016). TIR reflectance is reported to either provide an earlier (Falkenberg et al., 2007) or later (Nicolas, 2004) crop disease detection compared to VIS or VIS-NIR reflectance respectively.
38 3 Literature review
Table 2 : Spectral vegetation indices and their specificity.
Spectral Vegetation
Index (SVI) Abbreviation Equation Reference* Specificity**
Ratio VI
Simple Ratio RVI SR 𝑁𝑁𝑁𝑁𝑁𝑁𝑟𝑟𝑟𝑟𝑟𝑟
(Birth and McVey, 1968)
(Jordan, 1969) Vegetation color, LAI
Ea rly g reen v eg et at io n i nd ices Normalized Difference VI NDVI 𝑁𝑁𝑁𝑁𝑁𝑁 − 𝑟𝑟𝑟𝑟𝑟𝑟𝑁𝑁𝑁𝑁𝑁𝑁 + 𝑟𝑟𝑟𝑟𝑟𝑟 (Rouse, J.W. et al., 1973) Vegetation greenness
Tasseled Cap green VI
Green VI TCGVI GVI
−0.2848 𝑁𝑁450:520− 0.2435 𝑁𝑁520:600
− 0.5436 𝑁𝑁630:690+ 0.7243 𝑁𝑁760:900
+ 0.0840 𝑁𝑁1550:1750− 0.1800 𝑁𝑁2080:2350
(Kauth and Thomas,
1976) Green vegetation
Difference VI DVI 𝑁𝑁𝑁𝑁𝑁𝑁 − 𝑟𝑟𝑟𝑟𝑟𝑟 (Tucker, 1979) Green leaf area and biomass, total and green biomass, leaf water
content, chlorophyll content Corrected
Transformed VI CTVI |𝑁𝑁𝑁𝑁𝑁𝑁𝑁𝑁 + 0.5| �𝑁𝑁𝑁𝑁𝑁𝑁𝑁𝑁 + 0.5 |𝑁𝑁𝑁𝑁𝑁𝑁𝑁𝑁 + 0.5| Lautenschlager, 1984) (Perry and Green vegetation
Ratio RE3/RE2 RE3/RE2 𝑁𝑁740
𝑁𝑁720
(Vogelmann et al.,
1993) Total chlorophyll content
Chl or ophy ll c ont ent
Red Edge Inflection
Point REIP Red Edge Inflection Point (Vogelmann et al., 1993) Total chlorophyll content
Ratio of first derivative D715/D705 D715/D705 1 𝑠𝑠𝑠𝑠𝑟𝑟𝑟𝑟𝑟𝑟𝑑𝑑𝑑𝑑𝑑𝑑𝑑𝑑𝑑𝑑𝑑𝑑𝑟𝑟 𝑁𝑁 715 1𝑠𝑠𝑠𝑠𝑟𝑟𝑟𝑟𝑟𝑟𝑑𝑑𝑑𝑑𝑑𝑑𝑑𝑑𝑑𝑑𝑑𝑑𝑟𝑟 𝑁𝑁 705 (Vogelmann et al.,
1993) Total chlorophyll content
Greenness I G 𝑁𝑁554
𝑁𝑁677
(Zarco-Tejada et al.,
2004) Chlorophyll content
Green NDVI GNDVI 𝑁𝑁𝑁𝑁𝑁𝑁 − 𝑔𝑔𝑟𝑟𝑟𝑟𝑟𝑟𝑔𝑔𝑁𝑁𝑁𝑁𝑁𝑁 + 𝑔𝑔𝑟𝑟𝑟𝑟𝑟𝑟𝑔𝑔 (Gitelson et al., 1996) More sensitive to high chlorophyll a Chlorophyll a content
content than NDVI
Red Edge NDVI RENDVI 𝑁𝑁750− 𝑁𝑁705
𝑁𝑁750+ 𝑁𝑁705
(Gitelson and Merzlyak,
1994) Sensitive to high chlorophyll a content Chlorophyll a content
MERIS Terrestrial
Chlorophyll I MTCI 𝑁𝑁𝑁𝑁753.75708.75− 𝑁𝑁− 𝑁𝑁708.75681.25
(Dash and Curran,
2004) Sensitive to high chlorophyll content Chlorophyll content
Simple Ratio VI 𝑁𝑁750
𝑁𝑁710
(Zarco-Tejada et al., 2001)
Chlorophyll content Minimize effect of shadow and LAI
variation Modified Simple Ratio
I mSR705 𝑁𝑁750− 𝑁𝑁445
𝑁𝑁705− 𝑁𝑁445
(Sims and Gamon, 2002)
Chlorophyll content Compensate for high leaf surface
(specular) reflectance Modified Normalized
Difference I mND705 𝑁𝑁 𝑁𝑁750− 𝑁𝑁705
750+ 𝑁𝑁705− 2𝑁𝑁445
(Sims and Gamon, 2002)
Chlorophyll content Compensate for high leaf surface
(specular) reflectance Chlorophyll Absorption
Ratio I CARI 𝐶𝐶𝐶𝐶𝑁𝑁𝐶𝐶𝐶𝐶𝐶𝐶𝐶𝐶𝐶𝐶𝐶𝐶𝑁𝑁𝑁𝑁700
670 (Kim et al., 1994)
APAR, chlorophyll content, Minimize the effect of non-photosynthetic background Renormalized
Difference VI RDVI √𝑁𝑁𝑁𝑁𝑁𝑁 + 𝑁𝑁𝑑𝑑𝑉𝑉𝑑𝑑𝑉𝑉𝑉𝑉𝑟𝑟𝑁𝑁𝑁𝑁𝑁𝑁 − 𝑁𝑁𝑑𝑑𝑉𝑉𝑑𝑑𝑉𝑉𝑉𝑉𝑟𝑟
(Roujean and Breon,
1995) Minimize soil background effect fAPAR
Modified CARI MCARI [(𝑁𝑁700− 𝑁𝑁670) − 0.2(𝑁𝑁700− 𝑁𝑁550)] �𝑁𝑁𝑁𝑁700
670� (Daughtry et al., 2000) Chlorophyll content
Transformed CARI TCARI 3�(𝑁𝑁700−𝑁𝑁670) − 0.2(𝑁𝑁700−𝑁𝑁550) �𝑅𝑅700𝑅𝑅670�� (Haboudane et al., 2002) Minimize soil background effect Chlorophyll content
TCARI/OSAVI TCARI/OSAVI TCARI/OSAVI (Haboudane et al., 2002) Resistant to LAI variation, background Chlorophyll content
and solar zenith angle
Red-edge Chlorophyll I CIred-edge 𝑁𝑁800
𝑁𝑁710− 1
(Clevers and Gitelson, 2013; Gitelson et al.,
2003) Chlorophyll and nitrogen content
Green chlorophyll I CIgreen 𝑁𝑁800
𝑁𝑁550− 1
(Clevers and Gitelson, 2013; Gitelson et al.,
2003) Chlorophyll and nitrogen content
Normalized Difference Nitrogen I NDNI log � 1𝑁𝑁 1510� − log � 1𝑁𝑁1680� log � 1𝑁𝑁 1510� + log � 1𝑁𝑁1680�
(Serrano et al., 2002) Nitrogen content
Simple Ratio VI 𝑁𝑁𝑁𝑁𝑁𝑁
𝑁𝑁705 ;
𝑁𝑁𝑁𝑁𝑁𝑁
𝑁𝑁555
(Gitelson and Merzlyak,
1994) Chlorophyll and other pigments for senescent leaves
Normalized Phaeophytinization
Quotient I NPQI
𝑁𝑁415− 𝑁𝑁435
𝑁𝑁415+ 𝑁𝑁435 (Peñuelas et al., 1995b) Chlorophyll degradation
Simple Ratio VI 𝑁𝑁695
𝑁𝑁420 ;
𝑁𝑁695
Table 2 (cont.) : Spectral vegetation indices and their specificity.
Spectral Vegetation
Index (SVI) Abbreviation Equation Reference* Specificity**
Physiological or Photochemical Reflectance I PRI 𝑁𝑁550 𝐶𝐶𝑜𝑜 570− 𝑁𝑁531 𝑁𝑁550 𝐶𝐶𝑜𝑜 570+ 𝑁𝑁531 𝑜𝑜𝑟𝑟 𝑁𝑁531− 𝑁𝑁570 𝑁𝑁531+ 𝑁𝑁570 (Gamon et al., 1992)
(Peñuelas et al., 1995a) Photosynthetic efficiency, carotenoid
Pig m en ts : c ar ot en oid , c hlo ro ph yll, a nt ho cy ani n Normalized total Pigment to Chlorophyll a ratio I Normalized Difference Pigment I NPCI NDPI 𝑁𝑁680− 𝑁𝑁430 𝑁𝑁680+ 𝑁𝑁430 (Peñuelas et al., 1993) (Peñuelas et al., 1995a)
Ratio pigment/chlorophyll a Photosynthetic efficiency Affected by leaf structure
Simple Ratio Pigment I SRPI 𝑉𝑉𝑉𝑉𝑏𝑏𝑟𝑟
𝑟𝑟𝑟𝑟𝑟𝑟 (Peñuelas et al., 1995a)
Ratio carotenoid/chlorophyll a Affected by leaf structure Structure Independent
Pigment I SIPI 𝑁𝑁𝑁𝑁800800− 𝑁𝑁− 𝑁𝑁445680 (Peñuelas et al., 1995a)
Ratio carotenoid/chlorophyll a Minimize leaf structure effect Plant Senescence
Reflectance I PSRI 𝑁𝑁678𝑁𝑁− 𝑁𝑁750500 (Merzlyak et al., 1999)
Ratio carotenoid/chlorophyll change during leaf senescence
Red Green Ratio I RGRI 𝑟𝑟𝑟𝑟𝑟𝑟
𝑔𝑔𝑟𝑟𝑟𝑟𝑟𝑟𝑔𝑔 (Gamon and Surfus, 1999) Anthocyanin content
Specific Leaf Area VI SLAVI (𝑟𝑟𝑟𝑟𝑟𝑟 + 𝑆𝑆𝑆𝑆𝑁𝑁𝑁𝑁2)𝑁𝑁𝑁𝑁𝑁𝑁 (Lymburner et al., 2000) Specific leaf area
LA
I
Wide-Dynamic Range
VI WDRVI 𝑑𝑑𝑁𝑁𝑁𝑁𝑁𝑁 − 𝑟𝑟𝑟𝑟𝑟𝑟𝑑𝑑𝑁𝑁𝑁𝑁𝑁𝑁 + 𝑟𝑟𝑟𝑟𝑟𝑟 (Gitelson, 2004)
Vegetation fraction, LAI Also sensitive to moderate to high
vegetation density
Triangular VI TVI 0.5�120(𝑁𝑁750− 𝑁𝑁550) − 200(𝑁𝑁670− 𝑁𝑁550)� (Broge and Leblanc, 2001) Green LAI and chlorophyll content
Modified TVI 1 MTVI1 1.2[1.2(𝑁𝑁800− 𝑁𝑁550) − 2.5(𝑁𝑁670− 𝑁𝑁550)] (Haboudane et al., 2004)
Green LAI Minimize the effect of chlorophyll
content Gr een LA I Mi ni m ize the e ffe ct o f chl or op hy ll c ont ent
Modified TVI 2 MTVI2 1.5[1.2(𝑁𝑁800− 𝑁𝑁550) − 2.5(𝑁𝑁670− 𝑁𝑁550
)]
�(2𝑁𝑁800+ 1)2− �6𝑁𝑁800− 5�𝑁𝑁670� − 0.5
(Haboudane et al., 2004)
Green LAI Minimize the effect of chlorophyll
content
Modified CARI 1 MCARI1 1.2[2.5(𝑁𝑁800− 𝑁𝑁670) − 1.3(𝑁𝑁800− 𝑁𝑁550)] (Haboudane et al., 2004)
Green LAI Minimize the effect of chlorophyll
content
Modified CARI 2 MCARI2 1.5[2.5(𝑁𝑁800− 𝑁𝑁670) − 1.3(𝑁𝑁800− 𝑁𝑁550
)]
�(2𝑁𝑁800+ 1)2− �6𝑁𝑁800− 5�𝑁𝑁670� − 0.5
(Haboudane et al., 2004)
Green LAI Minimize the effect of chlorophyll
content
Perpendicular VI PVI 1
�𝑑𝑑² + 1(𝑁𝑁𝑁𝑁𝑁𝑁 − 𝑑𝑑 𝑟𝑟𝑟𝑟𝑟𝑟 − 𝑉𝑉)
(Richardson and
Wiegand, 1977) (Uses the soil background line) LAI
LA I M ini m ize so il ba ck gr ound e ffe ct
Soil Adjusted VI SAVI �𝑁𝑁𝑁𝑁𝑁𝑁 + 𝑟𝑟𝑟𝑟𝑟𝑟 + 𝐿𝐿�𝑁𝑁𝑁𝑁𝑁𝑁 − 𝑟𝑟𝑟𝑟𝑟𝑟 (1 + 𝐿𝐿) (Huete, 1988) Minimize soil background effect Green vegetation, LAI
Weighted Difference
Vegetation I WDVI 𝑁𝑁𝑁𝑁𝑁𝑁 − 𝑑𝑑 𝑟𝑟𝑟𝑟𝑟𝑟 (Clevers, 1989)
LAI Correcting soil background (particularly soil moisture)
Transformed SAVI TSAVI 𝑑𝑑(𝑟𝑟𝑟𝑟𝑟𝑟 + 𝑑𝑑 𝑁𝑁𝑁𝑁𝑁𝑁 − 𝑑𝑑𝑉𝑉)(𝑁𝑁𝑁𝑁𝑁𝑁 − 𝑑𝑑 𝑟𝑟𝑟𝑟𝑟𝑟 − 𝑉𝑉) (Baret et al., 1989) Minimize soil background effect LAI, APAR
Modified SAVI 2 MSAVI2 2𝑁𝑁𝑁𝑁𝑁𝑁 + 1 − �(2𝑁𝑁𝑁𝑁𝑁𝑁 + 1)2− 8(𝑁𝑁𝑁𝑁𝑁𝑁 − 𝑟𝑟𝑟𝑟𝑟𝑟)
2 (Qi et al., 1994)
Green vegetation Minimize soil background effect
Optimized SAVI OSAVI (𝑁𝑁𝑁𝑁𝑁𝑁 − 𝑟𝑟𝑟𝑟𝑟𝑟)
(𝑁𝑁𝑁𝑁𝑁𝑁 + 𝑟𝑟𝑟𝑟𝑟𝑟 + 0.16) (Rondeaux et al., 1996) Minimize soil background effect Chlorophyll content
Soil Adjusted Total VI SATVI 𝑆𝑆𝑆𝑆𝑁𝑁𝑁𝑁 − 𝑟𝑟𝑟𝑟𝑟𝑟
𝑆𝑆𝑆𝑆𝑁𝑁𝑁𝑁 + 𝑟𝑟𝑟𝑟𝑟𝑟 + 𝐿𝐿(1 + 𝐿𝐿) −
𝑆𝑆𝑆𝑆𝑁𝑁𝑁𝑁2
2 (Marsett et al., 2006)
Green and senescent vegetation cover Minimize soil background effect Atmospherically
Resistant VI ARVI 𝑁𝑁𝑁𝑁𝑁𝑁 − �𝑟𝑟𝑟𝑟𝑟𝑟 − 𝛾𝛾(𝑉𝑉𝑉𝑉𝑏𝑏𝑟𝑟 − 𝑟𝑟𝑟𝑟𝑟𝑟)�𝑁𝑁𝑁𝑁𝑁𝑁 + �𝑟𝑟𝑟𝑟𝑟𝑟 − 𝛾𝛾(𝑉𝑉𝑉𝑉𝑏𝑏𝑟𝑟 − 𝑟𝑟𝑟𝑟𝑟𝑟)�
∗∗∗
(Kaufman and Tanre,
1992) Resistant to atmospheric effects Green vegetation
Gr een veg . R es ista nt to atm os ph er ic e ffe cts Global Environmental Monitoring I GEMI 𝜂𝜂(1 − 0.25𝜂𝜂) −𝑟𝑟𝑟𝑟𝑟𝑟 − 0.1251 − 𝑟𝑟𝑟𝑟𝑟𝑟
(Pinty and Verstraete,
1992) Reduce atmospheric perturbations Green vegetation cover
Green Atmospherically
Resistant VI GARI 𝑁𝑁𝑁𝑁𝑁𝑁 − [𝑔𝑔𝑟𝑟𝑟𝑟𝑟𝑟𝑔𝑔 − 𝜆𝜆(𝑉𝑉𝑉𝑉𝑏𝑏𝑟𝑟 − 𝑟𝑟𝑟𝑟𝑟𝑟)]𝑁𝑁𝑁𝑁𝑁𝑁 + [𝑔𝑔𝑟𝑟𝑟𝑟𝑟𝑟𝑔𝑔 − 𝜆𝜆(𝑉𝑉𝑉𝑉𝑏𝑏𝑟𝑟 − 𝑟𝑟𝑟𝑟𝑟𝑟)] (Gitelson et al., 1996)
Wide range of chlorophyll content, photosynthesis rate, plant stress Resistant to atmospheric effects
40 3 Literature review
Table 2 (cont.) : Spectral vegetation indices and their specificity.
Spectral Vegetation
Index (SVI) Abbreviation Equation Reference* Specificity**
Soil Adjusted and Atmospherically
Resistant VI SARVI
𝑁𝑁𝑁𝑁𝑁𝑁 − �𝑟𝑟𝑟𝑟𝑟𝑟 − 𝛾𝛾(𝑉𝑉𝑉𝑉𝑏𝑏𝑟𝑟 − 𝑟𝑟𝑟𝑟𝑟𝑟)� 𝑁𝑁𝑁𝑁𝑁𝑁 + �𝑟𝑟𝑟𝑟𝑟𝑟 − 𝛾𝛾(𝑉𝑉𝑉𝑉𝑏𝑏𝑟𝑟 − 𝑟𝑟𝑟𝑟𝑟𝑟)� + 𝐿𝐿
∗∗∗
(Huete et al., 1994) Minimize soil and atmospheric noise Green vegetation
Gr een v eg . M in im ize so il a nd at m os phe ric no ise Enhance VI EVI 2(𝐿𝐿 + 𝑁𝑁𝑁𝑁𝑁𝑁 + 𝐶𝐶(𝑁𝑁𝑁𝑁𝑁𝑁 − 𝑟𝑟𝑟𝑟𝑟𝑟) 1𝑟𝑟𝑟𝑟𝑟𝑟 + 𝐶𝐶2𝑉𝑉𝑉𝑉𝑏𝑏𝑟𝑟) (Huete et al., 1999) Green vegetation Improved sensitivity into high
biomass
Minimize soil and atmospheric noise
2-band Enhanced VI EVI2 𝐺𝐺 𝑁𝑁𝑁𝑁𝑁𝑁 − 𝑟𝑟𝑟𝑟𝑟𝑟
𝑁𝑁𝑁𝑁𝑁𝑁 + �6 − 7.5𝑐𝑐 � 𝑟𝑟𝑟𝑟𝑟𝑟 + 1 (Jiang et al., 2008)
Green vegetation Minimize soil and atmospheric noise
without blue band EVI without blue band Infrared I
Normalized Difference II
II
NDII 𝑁𝑁𝑁𝑁830830− 𝑁𝑁+ 𝑁𝑁16501650 (Hardisky et al., 1983) Canopy water content
Ca no py w at er co nt ent
Moisture Stress I MSI 𝑁𝑁1599
𝑁𝑁819
(Hunt Jr and Rock,
1989) Canopy water content
Normalized Difference
Water I NDWI
𝑁𝑁860− 𝑁𝑁1240
𝑁𝑁860+ 𝑁𝑁1240 (Gao, 1996)
Canopy water content For closed green canopy Water I
Water Band I WBI WI 𝑁𝑁𝑁𝑁970900
(Peñelas et al., 1993; Peñuelas et al., 1997; Strachan et al., 2002)
Canopy water content For closed canopy and constant LAI
Floating-position WBI fWBI 𝑁𝑁900
𝑚𝑚𝑑𝑑𝑔𝑔(𝑁𝑁930−980) (Strachan et al., 2002) Canopy water content
Normalized
Multi-band Drought I NMDI 𝑁𝑁𝑁𝑁860860− (𝑁𝑁+ (𝑁𝑁16401640− 𝑁𝑁− 𝑁𝑁21302130)) (Wang and Qu, 2007)
Canopy water content For LAI ≥ 2
Color code identifies group of indices with similar specificity (last header column).
VI = Vegetation Index; I= Index; Rxxx = reflectance in a given wavelength expressed in nanometers; NIR = near infrared;
SWIR= shortwave infrared; CAR= Chlorophyll Absorption in Reflectance (~depth of the chlorophyll absorption at 670
nm); a, b, L, η, λ, γ, G, C1, C2 : confer original papers.
* Reference: generally, reference of the first paper mentioning the index.
** Specificity: specificity of the index as mentioned in the reference paper (Confer *): the vegetation biochemical
or/and biophysical property(-ies) for the assessment of which they were initially developed for and other specificities. *** Reflectances with prior correction for molecular scattering and ozone absorption.
References
Alchanatis Victor, Cohen Yafit, 2012. Chapter 13 - Spectral and Spatial Methods of Hyperspectral Image Analysis for Estimation of Biophysical and Biochemical Properties of Agricultural Crops, in: Thenkabail, P.S., Lyon, J.G., Huete, A. (Eds.), Hyperspectral Remote Sensing of Vegetation. pp. 289–307.
Apan A., Held A., Phinn S., Markley J., 2004. Detecting sugarcane ‘orange rust’ disease using EO-1 Hyperion hyperspectral imagery. International Journal of Remote Sensing 25, 489– 498. https://doi.org/10.1080/01431160310001618031
Arafat Sayed M., Aboelghar Mohamed A., Ahmed Eslam F., 2013. Crop Discrimination Using Field Hyper Spectral Remotely Sensed Data. Advances in Remote Sensing 02, 63–70. https://doi.org/10.4236/ars.2013.22009
Ashraf M., Harris P. J. C., 2013. Photosynthesis under stressful environments: An overview. Photosynthetica 51, 163–190. https://doi.org/10.1007/s11099-013-0021-6
Asner Gregory P., 1998. Biophysical and Biochemical Sources of Variability in Canopy Reflectance. Remote Sensing of Environment 64, 234–253. https://doi.org/10.1016/S0034-4257(98)00014-5
Baret F., Guyot G., Major D.J., 1989. TSAVI: A Vegetation Index Which Minimizes Soil Brightness Effects On LAI And APAR Estimation, in: 12th Canadian Symposium on Remote Sensing Geoscience and Remote Sensing Symposium. IEEE, pp. 1355–1358. https://doi.org/10.1109/IGARSS.1989.576128
Bayat Bagher, van der Tol Christiaan, Verhoef Wouter, 2016. Remote Sensing of Grass Response to Drought Stress Using Spectroscopic Techniques and Canopy Reflectance Model Inversion. Remote Sensing 8, 557. https://doi.org/10.3390/rs8070557
Birth Gerald S., McVey George R., 1968. Measuring the Color of Growing Turf with a Reflectance Spectrophotometer1. Agronomy Journal 60, 640. https://doi.org/10.2134/agronj1968.00021962006000060016x
Bowker D. E., Davis R. E., Myrick D. L., Stacy K., Jones W. T., 1985. Spectral reflectances of natural targets for use in remote sensing studies, NASA reference publication 1139. Broge N.H, Leblanc E, 2001. Comparing prediction power and stability of broadband and
hyperspectral vegetation indices for estimation of green leaf area index and canopy chlorophyll density. Remote Sensing of Environment 76, 156–172. https://doi.org/10.1016/S0034-4257(00)00197-8
Carter Gregory A., 1994. Ratios of leaf reflectances in narrow wavebands as indicators of plant stress. International Journal of Remote Sensing 15, 697–703. https://doi.org/10.1080/01431169408954109
Chen Lisu, Lin Lin, Cai Guangzhe, Sun Yuanyuan, Huang Tao, Wang Ke, Deng Jinsong, 2014. Identification of Nitrogen, Phosphorus, and Potassium Deficiencies in Rice Based on Static Scanning Technology and Hierarchical Identification Method. PLoS ONE 9,
Clark R. N., 1999. Chapter 1: Spectroscopy of Rocks and Minerals, and Principles of Spectroscopy, in: Manual of Remote Sensing, Volume 3, Remote Sensing for the Earth Sciences. New York, pp. 3–58.
Clevers J.G.P.W., 1989. Application of a weighted infrared-red vegetation index for estimating leaf Area Index by Correcting for Soil Moisture. Remote Sensing of Environment 29, 25– 37. https://doi.org/http://dx.doi.org/10.1016/0034-4257(89)90076-X
Clevers J.G.P.W., Gitelson A.A., 2013. Remote estimation of crop and grass chlorophyll and nitrogen content using red-edge bands on Sentinel-2 and -3. International Journal of Applied Earth Observation and Geoinformation 23, 344–351. https://doi.org/10.1016/j.jag.2012.10.008
Curran Paul J, 1989. Remote sensing of foliar chemistry. Remote Sensing of Environment 30, 271–278. https://doi.org/10.1016/0034-4257(89)90069-2
Darvishzadeh Roshanak, Skidmore A.K. (Promoter), Prins H.H.T. (Promoter), 2008. Hyperspectral remote sensing of vegetation parameters using statistical and physical models. Enschede, ITC.
Dash J., Curran P. J., 2004. The MERIS terrestrial chlorophyll index. International Journal of Remote Sensing 25, 5403–5413. https://doi.org/10.1080/0143116042000274015 Daughtry C S T, Walthall C L, Kim M S, de Colstoun E Brown, McMurtrey J E, 2000. Estimating
Corn Leaf Chlorophyll Concentration from Leaf and Canopy Reflectance. Remote Sensing of Environment 74, 229–239.
Falkenberg Nyland R., Piccinni Giovanni, Cothren J. Tom, Leskovar Daniel I., Rush Charlie M., 2007. Remote sensing of biotic and abiotic stress for irrigation management of cotton.
Agricultural Water Management 87, 23–31.
https://doi.org/10.1016/j.agwat.2006.05.021
Feng W, Yao X, Zhu Y, Tian Y C, Cao W X, 2008. Monitoring leaf nitrogen status with hyperspectral reflectance in wheat. European Journal of Agronomy 28, 394–404. Filella I., Serrano L., Serra J., Peñuelas J., 1995. Evaluating Wheat Nitrogen Status with Canopy
Reflectance Indices and Discriminant Analysis. Crop Science 35, 1400. https://doi.org/10.2135/cropsci1995.0011183X003500050023x
Gamon J. A., Surfus J. S., 1999. Assessing leaf pigment content and activity with a reflectometer. New Phytologist 143, 105–117. https://doi.org/10.1046/j.1469-8137.1999.00424.x
Gamon J.A., Peñuelas J., Field C.B., 1992. A narrow-waveband spectral index that tracks diurnal changes in photosynthetic efficiency. Remote Sensing of Environment 41, 35– 44. https://doi.org/10.1016/0034-4257(92)90059-S
Gao Bo-cai, 1996. NDWI—A normalized difference water index for remote sensing of vegetation liquid water from space. Remote Sensing of Environment 58, 257–266. https://doi.org/10.1016/S0034-4257(96)00067-3
Gitelson Anatoly A., 2012. Chapter 15 - Remote Sensing Estimation of Crop Biophysical Characteristics at Various Scales, in: Thenkabail, P.S., Lyon, J.G., Huete, A. (Eds.),
Hyperspectral Remote Sensing of Vegetation. pp. 329–358.
Gitelson Anatoly A., 2004. Wide Dynamic Range Vegetation Index for Remote Quantification of Biophysical Characteristics of Vegetation. Journal of Plant Physiology 161, 165–173. https://doi.org/10.1078/0176-1617-01176
Gitelson Anatoly A., Gritz Yuri, Merzlyak Mark N., 2003. Relationships between leaf chlorophyll content and spectral reflectance and algorithms for non-destructive chlorophyll assessment in higher plant leaves. Journal of Plant Physiology 160, 271–282. https://doi.org/10.1078/0176-1617-00887
Gitelson Anatoly A., Kaufman Yoram J., Merzlyak Mark N., 1996. Use of a green channel in remote sensing of global vegetation from EOS-MODIS. Remote Sensing of Environment 58, 289–298. https://doi.org/10.1016/S0034-4257(96)00072-7
Gitelson Anatoly, Merzlyak Mark N., 1994. Spectral Reflectance Changes Associated with Autumn Senescence of Aesculus hippocastanum L. and Acer platanoides L. Leaves. Spectral Features and Relation to Chlorophyll Estimation. Journal of Plant Physiology 143, 286–292. https://doi.org/10.1016/S0176-1617(11)81633-0
Goel P K, Prasher S O, Landry J A, Patel R M, Bonnell R B, Viau A A, Miller J R, 2003. Potential of airborne hyperspectral remote sensing to detect nitrogen deficiency and weed infestation in corn. Computers and Electronics in Agriculture 38, 99–124.
Guo X., Zheng Y., Olfert O., Brandt S., Thomas A.G., Weiss R.M., Sproule L., n.d. Evaluation of Remote Sensing Approaches to Monitor Crop Conditions under Specific Input Levels and Cropping Diversity.
Haboudane Driss, Miller John R., Pattey Elizabeth, Zarco-Tejada Pablo J., Strachan Ian B., 2004. Hyperspectral vegetation indices and novel algorithms for predicting green LAI of crop canopies: Modeling and validation in the context of precision agriculture. Remote Sensing of Environment 90, 337–352. https://doi.org/10.1016/j.rse.2003.12.013 Haboudane Driss, Miller John R, Tremblay Nicolas, Zarco-Tejada Pablo J, Dextraze Louise,
2002. Integrated narrow-band vegetation indices for prediction of crop chlorophyll content for application to precision agriculture. Remote Sensing of Environment 81, 416–426. https://doi.org/10.1016/S0034-4257(02)00018-4
Hansen P M, Schjoerring J K, 2003. Reflectance measurement of canopy biomass and nitrogen status in wheat crops using normalized difference vegetation indices and partial least squares regression. Remote Sensing of Environment 86, 542–553.
Hardisky M A, Klemas V, Smart R M, 1983. The Influence of Soil Salinity, Growth Form, and Leaf Moisture on the Spectral Radiance of Spartina Alterniflora Canopies. Photogrammetric Engineering and Remote Sensing 49, 77–83.
Hoffer RM, Johannsen CJ, 1969. Ecological potentials in spectral signature analysis. Remote Sensing in Ecology.
Huete A.R, 1988. A soil-adjusted vegetation index (SAVI). Remote Sensing of Environment 25, 295–309. https://doi.org/10.1016/0034-4257(88)90106-X
Remote Sensing of Environment 49, 224–234. https://doi.org/10.1016/0034-4257(94)90018-3
Huete Alfredo, Justice Chris, Van Leeuwen Wim, 1999. MODIS vegetation index (MOD 13) - Algorithm theoretical basis document - Version 3.
Hunt Jr E, Rock B, 1989. Detection of changes in leaf water content using Near- and Middle-Infrared reflectances. Remote Sensing of Environment 30, 43–54. https://doi.org/10.1016/0034-4257(89)90046-1
Jacquemoud Stéphane, Verhoef Wout, Baret Frédéric, Bacour Cédric, Zarco-Tejada Pablo J., Asner Gregory P., François Christophe, Ustin Susan L., 2009. PROSPECT+SAIL models: A review of use for vegetation characterization. Remote Sensing of Environment 113, S56–S66. https://doi.org/10.1016/j.rse.2008.01.026
Jiang Z, Huete A, Didan K, Miura T, 2008. Development of a two-band enhanced vegetation index without a blue band. Remote Sensing of Environment 112, 3833–3845. https://doi.org/10.1016/j.rse.2008.06.006
Jordan Carl F., 1969. Derivation of Leaf-Area Index from Quality of Light on the Forest Floor. Ecology 50, 663–666. https://doi.org/10.2307/1936256
Kaufman Y.J., Tanre D., 1992. Atmospherically resistant vegetation index (ARVI) for EOS-MODIS. IEEE Transactions on Geoscience and Remote Sensing 30, 261–270. https://doi.org/10.1109/36.134076
Kauth R J, Thomas G S, 1976. The tasselled cap - A graphic description of the spectral-temporal development of agricultural crops as seen by Landsat. Proceedings of the Symposium on Machine Processing of Remotely Sensed Data, West Lafayette, Indiana, U.S.A, 29 June-1 July 1976.
Kim Moon S., Daughtry C. S. T., Chappelle E. W., Mcmurtrey J. E., Walthall C. L., 1994. The use of high spectral resolution bands for estimating absorbed photosynthetically active radiation (A par), in: CNES, Proceedings of 6th International Symposium on Physical Measurements and Signatures in Remote Sensing. pp. 299–306.
Knipling Edward B., 1970. Physical and physiological basis for the reflectance of visible and near-infrared radiation from vegetation. Remote Sensing of Environment 1, 155–159. https://doi.org/10.1016/S0034-4257(70)80021-9
Kokaly Raymond F, Clark Roger N, Swayze Gregg A, Livo K Eric, Hoefen Todd M, Pearson Neil C, Wise Richard A, Benzel William M, Lowers Heather A, Driscoll Rhonda L, Klein Anna J, 2017. USGS Spectral Library Version 7, Data Series. Reston, VA. https://doi.org/10.3133/ds1035
Kokaly RF, Clark RN, Livo KE, 1998. Mapping the biology and mineralogy of Yellowstone National Park using imaging spectroscopy, in: Summaries of the 7th Annual JPL Airborne Earth Science Workshop, R.O. Green, Ed., JPL Publication 97-21. Vol. 1, AVIRIS Workshop, Conducted Jan 12-16, 1998, Pp. 245-254, Dec. 1998.
Kuska Matheus, Wahabzada Mirwaes, Leucker Marlene, Dehne Heinz-Wilhelm, Kersting Kristian, Oerke Erich-Christian, Steiner Ulrike, Mahlein Anne-Katrin, 2015. Hyperspectral
phenotyping on the microscopic scale: towards automated characterization of plant-pathogen interactions. Plant Methods 11, 28. https://doi.org/10.1186/s13007-015-0073-7
Liu Jiangui, Pattey Elizabeth, Jégo Guillaume, 2012. Assessment of vegetation indices for regional crop green LAI estimation from Landsat images over multiple growing seasons.
Remote Sensing of Environment 123, 347–358.
https://doi.org/10.1016/j.rse.2012.04.002
Lymburner L, Beggs P J, Jacobson C R, 2000. Estimation of canopy-average surface-specific leaf area using Landsat TM data. Photogrammetric Engineering and Remote Sensing. Mahlein Anne-Katrin, 2016. Plant Disease Detection by Imaging Sensors – Parallels and
Specific Demands for Precision Agriculture and Plant Phenotyping. Plant Disease 100, 241–251. https://doi.org/10.1094/PDIS-03-15-0340-FE
Marschner Horst, 1995. Functions of Mineral Nutrients, in: Mineral Nutrition of Higher Plants. Elsevier, pp. 229–312. https://doi.org/10.1016/B978-012473542-2/50010-9
Marsett Robert C., Qi Jiaguo, Heilman Philip, Biedenbender Sharon H., Carolyn Watson M., Amer Saud, Weltz Mark, Goodrich David, Marsett Roseann, 2006. Remote Sensing for Grassland Management in the Arid Southwest. Rangeland Ecology & Management 59, 530–540. https://doi.org/10.2111/05-201R.1
Merzlyak Mark N., Gitelson Anatoly A., Chivkunova Olga B., Rakitin Victor YU., 1999. Non-destructive optical detection of pigment changes during leaf senescence and fruit ripening. Physiologia Plantarum 106, 135–141. https://doi.org/10.1034/j.1399-3054.1999.106119.x
Mohammed G H, Noland T L, Irving D, Sampson P H, Zarco-Tejada P J, Miller J R, 2000. Natural and stress induced effects on leaf spectral reflectance in Ontario species, Forest Research Report No. 156.
Muhammed Hamed Hamid, 2005. Hyperspectral Crop Reflectance Data for characterising and estimating Fungal Disease Severity in Wheat. Biosystems Engineering 91, 9–20. https://doi.org/10.1016/j.biosystemseng.2005.02.007
Nguy-Robertson Anthony, Gitelson Anatoly, Peng Yi, Vi?a Andr?s, Arkebauer Timothy, Rundquist Donald, 2012. Green Leaf Area Index Estimation in Maize and Soybean: Combining Vegetation Indices to Achieve Maximal Sensitivity. Agronomy Journal 104, 1336. https://doi.org/10.2134/agronj2012.0065
Nicolas Hervé, 2004. Using remote sensing to determine of the date of a fungicide application
on winter wheat. Crop Protection 23, 853–863.
https://doi.org/10.1016/j.cropro.2004.01.008
Osborne S. L., Schepers J. S., Francis D. D., Schlemmer M. R., 2002. Detection of Phosphorus and Nitrogen Deficiencies in Corn Using Spectral Radiance Measurements. Agronomy Journal 94, 1215. https://doi.org/10.2134/agronj2002.1215
1887–1905. https://doi.org/10.1080/01431169308954010
Peñuelas J., Baret F., Filella I., 1995a. Semi-empirical indices to assess carotenoids/chlorophyll a ratio from leaf spectral reflectance. Photosynthetica 31, 221–230.
Peñuelas J., Filella I., Lloret P., Munoz F., Vilajeliu M., 1995b. Reflectance assessment of mite effects on apple trees. International Journal of Remote Sensing 16, 2727–2733. https://doi.org/10.1080/01431169508954588
Peñuelas J., Pinol J., Ogaya R., Filella I., 1997. Estimation of plant water concentration by the reflectance Water Index WI (R900/R970). International Journal of Remote Sensing 18, 2869–2875. https://doi.org/10.1080/014311697217396
Peñuelas Josep, Gamon John A, Griffin Kevin L, Field Christopher B, 1993. Assessing community type, plant biomass, pigment composition, and photosynthetic efficiency of aquatic vegetation from spectral reflectance. Remote Sensing of Environment 46, 110– 118. https://doi.org/10.1016/0034-4257(93)90088-F
Perry Charles R., Lautenschlager Lyle F., 1984. Functional equivalence of spectral vegetation indices. Remote Sensing of Environment 14, 169–182. https://doi.org/10.1016/0034-4257(84)90013-0
Pinty B., Verstraete M. M., 1992. GEMI: a non-linear index to monitor global vegetation from satellites. Vegetatio 101, 15–20. https://doi.org/10.1007/BF00031911
Punalekar Suvarna, Verhoef Anne, Tatarenko Irina, van der Tol Christiaan, Macdonald David, Marchant Benjamin, Gerard France, White Kevin, Gowing David, 2016. Characterization of a Highly Biodiverse Floodplain Meadow Using Hyperspectral Remote Sensing within a Plant Functional Trait Framework. Remote Sensing 8, 112. https://doi.org/10.3390/rs8020112
Qi J., Chehbouni A., Huete A.R., Kerr Y.H., Sorooshian S., 1994. A modified soil adjusted vegetation index. Remote Sensing of Environment 48, 119–126. https://doi.org/10.1016/0034-4257(94)90134-1
Qi Jiaguo, Inoue Yoshio, Wiangwang Narumon, 2011. Hyperspectral Remote Sensing in Global Change Studies, in: Hyperspectral Remote Sensing of Vegetation. CRC Press, pp. 69–90. https://doi.org/10.1201/b11222-6
Ranjan Rajeev, Chopra Usha Kiran, Sahoo Rabi N., Singh Anil Kumar, Pradhan Sanatan, 2012. Assessment of plant nitrogen stress in wheat ( Triticum aestivum L.) through hyperspectral indices. International Journal of Remote Sensing 33, 6342–6360. https://doi.org/10.1080/01431161.2012.687473
Richardson A J, Wiegand C L, 1977. Distinguishing vegetation from soil background information. Photogrammetric Engineering and Remote Sensing 43, 1541–1552. Roberts Dar A., Roth Keely L., Perroy Ryan L., 2012. Chapter 14 - Hyperspectral Vegetation
Indices, in: Thenkabail, P.S., Lyon, J.G., Huete, A. (Eds.), Hyperspectral Remote Sensing of Vegetation. pp. 309–327.
Rondeaux Geneviève, Steven Michael, Baret Frédéric, 1996. Optimization of soil-adjusted vegetation indices. Remote Sensing of Environment 55, 95–107.
https://doi.org/10.1016/0034-4257(95)00186-7
Roosjen Peter, Clevers Jan, Bartholomeus Harm, Schaepman Michael, Schaepman-Strub Gabriela, Jalink Henk, van der Schoor Rob, de Jong Arjan, 2012. A Laboratory Goniometer System for Measuring Reflectance and Emittance Anisotropy. Sensors 12, 17358–17371. https://doi.org/10.3390/s121217358
Roujean Jean-Louis, Breon François-Marie, 1995. Estimating PAR absorbed by vegetation from bidirectional reflectance measurements. Remote Sensing of Environment 51, 375–384. https://doi.org/10.1016/0034-4257(94)00114-3
Rouse, J.W. Jr., Haas R.H., Schell J.A., Deering D.W., 1973. Monitoring the vernal advancement and retrogradation (green wave effect) of natural vegetation. Progress report RSC 1978-1.
Serrano Lydia, Peñuelas Josep, Ustin Susan L, 2002. Remote sensing of nitrogen and lignin in Mediterranean vegetation from AVIRIS data. Remote Sensing of Environment 81, 355– 364. https://doi.org/10.1016/S0034-4257(02)00011-1
Sims Daniel A, Gamon John A, 2002. Relationships between leaf pigment content and spectral reflectance across a wide range of species, leaf structures and developmental stages. Remote Sensing of Environment 81, 337–354. https://doi.org/10.1016/S0034-4257(02)00010-X
Strachan Ian B., Pattey Elizabeth, Boisvert Johanne B., 2002. Impact of nitrogen and environmental conditions on corn as detected by hyperspectral reflectance. Remote Sensing of Environment 80, 213–224. https://doi.org/10.1016/S0034-4257(01)00299-1 Thenkabail Prasad S., Enclona Eden A., Ashton Mark S., Van Der Meer Bauke, 2004. Accuracy
assessments of hyperspectral waveband performance for vegetation analysis applications. Remote Sensing of Environment 91, 354–376. https://doi.org/10.1016/j.rse.2004.03.013
Thenkabail Prasad S., Lyon John G., Huete Alfredo, 2012. Chapter 1 - Advances in Hyperspectral Remote Sensing of Vegetation and Agricultural Croplands, in: Thenkabail, P.S., Lyon, J.G., Huete, A. (Eds.), Hyperspectral Remote Sensing of Vegetation. pp. 3–35. Thenkabail Prasad S., Mariotto Isabella, Gumma Murali Krishna, Middleton Elizabeth M.,
Landis David R., Huemmrich K. Fred, 2013. Selection of Hyperspectral Narrowbands (HNBs) and Composition of Hyperspectral Twoband Vegetation Indices (HVIs) for Biophysical Characterization and Discrimination of Crop Types Using Field Reflectance and Hyperion/EO-1 Data. IEEE Journal of Selected Topics in Applied Earth Observations and Remote Sensing 6, 427–439. https://doi.org/10.1109/JSTARS.2013.2252601 Tucker Compton J, 1979. Red and photographic infrared linear combinations for monitoring
vegetation. Remote Sensing of Environment 8, 127–150. https://doi.org/http://dx.doi.org/10.1016/0034-4257(79)90013-0
Verhoef W., 1984. Light scattering by leaf layers with application to canopy reflectance modeling: The SAIL model. Remote Sensing of Environment 16, 125–141.
Vogelmann J. E., Rock B. N., Moss D. M., 1993. Red edge spectral measurements from sugar maple leaves. International Journal of Remote Sensing 14, 1563–1575. https://doi.org/10.1080/01431169308953986
Wang Lingli, Qu John J., 2007. NMDI: A normalized multi-band drought index for monitoring soil and vegetation moisture with satellite remote sensing. Geophysical Research Letters 34, L20405. https://doi.org/10.1029/2007GL031021
Watson D. J., 1947. Comparative Physiological Studies on the Growth of Field Crops: I. Variation in Net Assimilation Rate and Leaf Area between Species and Varieties, and within and between Years. Annals of Botany 11, 41–76. https://doi.org/10.1093/oxfordjournals.aob.a083148
Xavier A. C., Vettorazzi C. A., 2004. Mapping leaf area index through spectral vegetation indices in a subtropical watershed. International Journal of Remote Sensing 25, 1661– 1672. https://doi.org/10.1080/01431160310001620803
YARA crop Nutrition, n.d. Phosphorus Deficiency - Wheat Web document. URL http://www.yara.co.uk/crop-nutrition/crops/wheat/crop-nutrition/deficiencies/p/01-13398-phosphorus-deficiency---wheat/
Yu Gui-Rui, 2000. A proposal for universal formulas for estimating leaf water status of herbaceous and woody plants based on spectral reflectance properties. Plant and Soil 227, 47–58. https://doi.org/10.1023/A:1026556613082
Zarco-Tejada P.J., Miller J.R., Noland T.L., Mohammed G.H., Sampson P.H., 2001. Scaling-up and model inversion methods with narrowband optical indices for chlorophyll content estimation in closed forest canopies with hyperspectral data. IEEE Transactions on Geoscience and Remote Sensing 39, 1491–1507. https://doi.org/10.1109/36.934080 Zarco-Tejada P J, Berjón A, Miller J R, 2004. Stress detection in crops with hyperspectral
remote sensing and physical simulation models, in: Proceedings of the Airborne Imaging Spectroscopy Workshop - Bruges, 8 October 2004.
Zygielbaum Arthur, 2009. Detection and Measurement of Water Stress in Vegetation Using Visible Spectrum Reflectance.