HAL Id: hal-01373762
https://hal.inria.fr/hal-01373762
Submitted on 5 Oct 2016
HAL is a multi-disciplinary open access
archive for the deposit and dissemination of
sci-entific research documents, whether they are
pub-lished or not. The documents may come from
teaching and research institutions in France or
abroad, or from public or private research centers.
L’archive ouverte pluridisciplinaire HAL, est
destinée au dépôt et à la diffusion de documents
scientifiques de niveau recherche, publiés ou non,
émanant des établissements d’enseignement et de
recherche français ou étrangers, des laboratoires
publics ou privés.
Crowdsourcing Biodiversity Monitoring: How Sharing
your Photo Stream can Sustain our Planet
Alexis Joly, Hervé Goëau, Julien Champ, Samuel Dufour-Kowalski, Henning
Müller, Pierre Bonnet
To cite this version:
Alexis Joly, Hervé Goëau, Julien Champ, Samuel Dufour-Kowalski, Henning Müller, et al..
Crowd-sourcing Biodiversity Monitoring: How Sharing your Photo Stream can Sustain our Planet. MM:
Con-ference on Multimedia, Oct 2016, Amsterdam, Netherlands. pp.958-967, �10.1145/2964284.2976762�.
�hal-01373762�
Crowdsourcing Biodiversity Monitoring: How Sharing your
Photo Stream can Sustain our Planet
Alexis Joly
Inria, ZENITH team, LIRMM 34095 Montpellier, France
Hervé Goëau
IRD, UMR AMAP Montpellier, France
Julien Champ
Inria, ZENITH team, LIRMM 34095 Montpellier, France
Samuel Dufour-Kowalski
INRA, UMR AMAP Montpellier, France
Henning Müller
HES-SO
3960 Sierre, Switzerland
Pierre Bonnet
CIRAD, UMR AMAP Montpellier, France
ABSTRACT
Large scale biodiversity monitoring is essential for sustain-able development (earth stewardship). With the recent ad-vances in computer vision, we see the emergence of more and more effective identification tools allowing to set-up large-scale data collection platforms such as the popular Pl@ntNet initiative that allow to reuse interaction data. Although it covers only a fraction of the world flora, this platform is al-ready being used by more than 300K people who produce tens of thousands of validated plant observations each year. This explicitly shared and validated data is only the tip of the iceberg. The real potential relies on the millions of raw image queries submitted by the users of the mobile applica-tion for which there is no human validaapplica-tion. People make such requests to get information on a plant along a hike or something they find in their garden but not know anything about. Allowing the exploitation of such contents in a fully automatic way could scale up the world-wide collection of implicit plant observations by several orders of magnitude, which can complement the explicit monitoring efforts. In this paper, we first survey existing automated plant identi-fication systems through a five-year synthesis of the Plant-CLEF benchmark and an impact study of the Pl@ntNet platform. We then focus on the implicit monitoring sce-nario and discuss related research challenges at the frontier of computer science and biodiversity studies. Finally, we discuss the results of a preliminary study focused on im-plicit monitoring of invasive species in mobile search logs. We show that the results are promising but that there is room for improvement before being able to automatically share implicit observations within international platforms.
1.
INTRODUCTION
Identifying organisms is a key step in accessing
informa-Permission to make digital or hard copies of all or part of this work for personal or classroom use is granted without fee provided that copies are not made or distributed for profit or commercial advantage and that copies bear this notice and the full citation on the first page. Copyrights for components of this work owned by others than the author(s) must be honored. Abstracting with credit is permitted. To copy otherwise, or republish, to post on servers or to redistribute to lists, requires prior specific permission and/or a fee. Request permissions from permissions@acm.org.
MM ’16, October 15 - 19, 2016, Amsterdam, Netherlands
c
2016 Copyright held by the owner/author(s). Publication rights licensed to ACM. ISBN 978-1-4503-3603-1/16/10. . . $15.00
DOI:http://dx.doi.org/10.1145/2964284.2976762
tion related to the ecology of species. This is essential in recording any specimen on earth to be used in ecological studies. Unfortunately, this is difficult to achieve due to the level of expertise necessary to correctly identify and record living organisms (in particular plants that are one of the most difficult group to identify with more than 350,000 species on earth). The required knowledge makes crowd-sourcing of plant identification hard, similar to other specific domains such as medical data analysis [10]. This taxonomic gap has been recognized since the Rio Conference of 1992 as a major obstacle to the global implementation of the Con-vention on Biological Diversity. Among the divers methods used for species identification, Gaston et al.[11] discussed in 2004 the potential of automated approaches typically based on machine learning and multimedia data analysis methods. They suggested that, if the scientific community is able to (i) overcome the production of large training datasets, (ii) more precisely identify and evaluate the error rates, (iii) scale up automated approaches, and (iv) detect novel species, it will then be possible to initiate the development of a generic automated species identification system that could open op-portunities for work in biological and related fields.
Since the question raised by Gaston in 2004 (”automated species identification: why not?”), enormous work has been done on the development of automated approaches for plant species identification, mostly based on computer vision tech-niques (e.g. [16, 42, 22] ). Some of these results were in-tegrated in effective web or mobile tools and have initiated close interactions between computer scientists and end-users such as ecologists, botanists, educators, land managers and the general public. One remarkable system in this domain was the LeafSnap application [25], focused on a few hun-dred tree species of North America. This was followed a few years later by other applications such as Pl@ntNet [20] or Folia [4] more specifically dedicated to the European flora, or LikeThat garden1 more focused on garden plants. These productions were perceived as innovative tools and have re-ceived a good support of a large part of the society. These tools are at an early stage of development according to the large number of plant species on earth, the large diversity of end-users interested in such an accessible approach and the limits of today’s performance.
In parallel to the emergence of automated identification
1
tools, large social networks dedicated to the production, sharing and identification of biodiversity records have in-creased in recent years. Some of the most active ones in the botanical domain like iNaturalist2, iSpot [32], Tela
Botan-ica3, federate tens of thousands of members, producing hun-dreds of thousands of observations. As a proof of their in-creasing reliability, some of these networks started to con-tribute to global initiatives in biodiversity such as the Global Biodiversity Information Facility (GBIF4) which is the largest and most recognized one.
Noticeably, the Pl@ntNet initiative was the first one at-tempting to combine the force of social networks with that of automated identification tools [21]. It was launched in 2009 by a consortium involving research institutes in com-puter sciences, ecology and agriculture in collaboration with the Tela Botanica social network. This was the starting point of several scientific and technological productions [12] which finally led to the first release of the Pl@ntNet app (iOS in February 2013 [15] and Android [14] the following year). It was the first system allowing the use of a combina-tion of different visual features (such as leaf, stem, fruit and flower) and the first one relying on a continuously enriched collaborative training set. This app was initially based on 800 species and was progressively enlarged to thousands of plant species of the European region (6 180 species up to now). Nowadays, the platform is being used by about 300K people who produce tens of thousands of validated plant ob-servations each year thanks to collaborative validation tools (IdentiPlante5 and PictoFlora6).
Nevertheless, this explicitly shared and validated data is only the tip of the iceberg. The real potential relies on the millions of raw image queries submitted by the users of the mobile application for which there is no human validation at all. As an illustration, in 2015, 2,328,502 queries were submitted by the users of the Pl@ntNet mobile apps but only less than 1 % of them were finally shared and collabo-ratively validated. Allowing the exploitation of the unvali-dated observations in a fully automatic way could scale up the world-wide collection of plant records by several orders of magnitude. The idea of implicitly monitoring living organ-isms from any kind of User Generated Content data streams has the potential to revolutionize biodiversity monitoring at a limited cost. The images are submitted by hikers who want to know about plants along the way or people who find an unknown species in their garden. Allowing to include these observations into implicit monitoring could allow to get large amounts of monitoring data with GPS coordinates, altitude, time of the year to allow for monitoring changes between years and over longer periods of time. This can not replace explicit efforts but can complement them in ways that are otherwise impossible. Whereas occlusion is a common prob-lem in computer vision and view points or color changes are as well, there are specific challenges to plants. Plants evolve strongly over the year, from color changes to blos-soms, flowering and then fruits and non-professional photog-raphers will get these incomplete or missing out potentially important detail. This creates interesting challenges of
miss-2 http://www.inaturalist.org/ 3http://www.tela-botanica.org/ 4 http://www.gbif.org/ 5http://www.tela-botanica.org/appli:identiplante 6 http://www.tela-botanica.org/appli:pictoflora
ing information and also changing information over the year as well as diversity also within species. Long term changes as in global warming require observations over a longer pe-riod of time. Only with implicit monitoring such challenges can really be tackled.
2.
THE PLANTCLEF CHALLENGE: A
FIVE-YEAR OVERVIEW
In order to evaluate the performance of automated plant identification technologies in a sustainable and repeatable way, a dedicated system-oriented benchmark was setup in 2011 in the context of ImageCLEF7. In 2011, 2012 and 2013
respectively 8, 11 and 12 research groups participated in this large collaborative evaluation by benchmarking their image-based plant identification systems (see [17, 18, 16] for more details). In 2014, the LifeCLEF research platform was created in the continuity of this effort so as to enlarge the evaluated challenges by considering birds and fishes in addition to plants, and audio and video contents in addition to images.
Within this context, the plant identification benchmark continued to be run yearly offering today a five-year follow-up of the progress in image-based plant identification. A particularity of the benchmark is that it always focused on real-world collaborative data contrary to most other testbeds that were created through well controlled laboratory condi-tions. Additionally, the evaluation protocol was defined in collaboration with biologists so as to reflect realistic usage scenarios. Notably particular attention was accorded to the notion of observation rather than considering standalone im-ages. In practice, the same individual plant is actually often photographed several times by the same observer resulting in contextually similar pictures and/or near-duplicates. To avoid bias, it is crucial to consider such image sets as a single plant observation that should not be split across the training and test set. Besides this, the use of contextual and social data was also authorized when they were judged as poten-tially useful and accessible in a real-world usage scenario. This includes geo-tags or location names, time information, author names, collaborative ratings, vernacular names (com-mon names), picture type tags, etc. It is however important to note that the visual modality remained largely predom-inant in all the best systems along the years and that the use of metadata was shown to provide only slight additional improvements.
Tables 1 and 2 give a year-to-year overview of the shared data and of the best performing systems (detailed descrip-tions of the results and systems can be found in the technical overview papers of each year [17, 13] and participant work-ing notes). To allow a comprehensive comparison along the years, we isolated in Table 1 the leaf scans and white back-ground image categories that were part of the evaluation of the three first years but that were abandoned afterwards. Table 2 focuses on photographs of plants in their natural environment (only leaves in 2011-2012, diverse organs and plant views in the following years). For a fair comparison, we also removed from the overview, the submissions that were humanly assisted in some point (e.g. involving a manual segmentation of the leaves). The evaluation metric that was used from 2011 to 2015 was i.e. an extension of the mean reciprocal rank [38] classically used in information retrieval.
7
Table 1: Three-year synthesis of the PlantCLEF challenge restricted to leaf scans and pseudo-scans Year #Species #Images #Evaluated
systems Score of best system Brief description of best system 2011 71 3,967 20 0.574
. Various local features (around Harris points) . Hash-based indexing
. RANSAC based matching 2012 126 9,356 30 0.565 . Shape and texture global features
. SVM classifier
2013 250 11,031 33 0.607 . Shape and texture global features . SVM classifier
The difference is that it is based on a two-stage averaging rather than a flat averaging such as:
S = 1 U U X u=1 1 Pu Pu X p=1 1 ru,p (1)
where U is the number of image authors within the test set, Pu the number of individual plants observed by the u-th
author (within the test set), ru,p is the rank of the correct
species within the ranked list of species returned by the eval-uated system (for the p-th observation of the u-th author). Note that if the correct species does not appear in the re-turned list, its rank ru,p is considered as infinite. Overall,
the proposed metric makes it possible to compensate the long-tail distribution effects of social data. As in any so-cial network, few people actually produce huge quantities of data whereas a vast majority of contributors (the long tail) produce much less data.
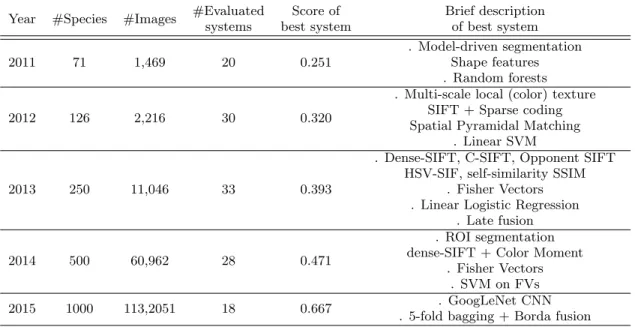
The main conclusion we can derive from the results of Table 1 is that the classical approach to plant identifica-tion consisting of analyzing the morphology of the leaves reached its limit. Leaf shape boundary features and shape matching techniques have been studied during 30 years and can be considered as sufficiently mature for capturing shape information in a robust and invariant way. The limited per-formance is thus rather due to the intrinsic limitation of using only the leaf morphology for discriminating a large number of species. The phenomenon that scientists focused on leaf-based identification during years is more related to the fact that the leaf was easier to scan and to process with state-of-the-art computer vision techniques of that period (segmentation, shape matching, etc.). With the arrival of more advanced computer vision techniques, we were pro-gressively able to make use of other parts of the plant such as flowers or fruits. For this reason, metrics on leaf scans were abandoned from the PlantCLEF evaluation after 2013. Table 2 gives the five-year synthesis of this approach to plant identification that we promoted through PlantCLEF. The most interesting conclusion we can derive is that we observed considerable improvements of the scores along the years whereas the difficulty of the task was increasing. The number of classes almost doubled every year between 2011 and 2015, starting from 71 species in 2011 and reaching 1000 species in 2015. The increase of the performance can be explained by two major technological breakthroughs. The first was the use of aggregation-based or coding-based image representation methods such as the Fisher Vector represen-tation [29], that was used by the best performing system of Nakayama et al. [26] in 2013 and Chen et al. [6] in 2014.
These methods consist of producing high-dimensional repre-sentations of the images by aggregating previously extracted sets of hand-crafted local features into a global vector repre-sentation. They rely on a two step process: (i) the learning of a set of latent variables that explain the distribution of the local features in the training set (denoted as the codebook or vocabulary), and (ii) the encoding of the relationship be-tween the local features of a given image and the latent vari-ables. Overall, this allows to embed the fine-grained visual content of each image into a single representation space in which classes are easily separable even with linear classifiers. The second technological step explaining the last increase of performance is the use of deep learning methods, in partic-ular convolutional neural networks (CNN) such as GoogLeNet [35]. In 2015, the 10 best evaluated systems were based on CNN. The difference of performance is mainly due to partic-ular system design improvements such as the use of bagging in the best run of Choi [7]. CNNs recently received a high amount of attention caused by the impressive performance they achieved in the ImageNet classification task [24]. The force of these technologies relies on their ability to learn dis-criminant visual features directly from the raw pixels of the images without falling in the trap of the curse of dimension-ality. This is achieved by stacking multiple convolutional layers, i.e. the core building blocks of a CNN. A convolu-tional layer basically takes images as input and produces as output feature maps corresponding to different convolution kernels, i.e looking for different visual patterns. Looking at the impressive results achieved by CNN’s in the 2015 edi-tion of PlantCLEF there is absolutely no doubt that they are able to capture discriminant visual patterns of the plants in a much more effective way than previously engineered visual features.
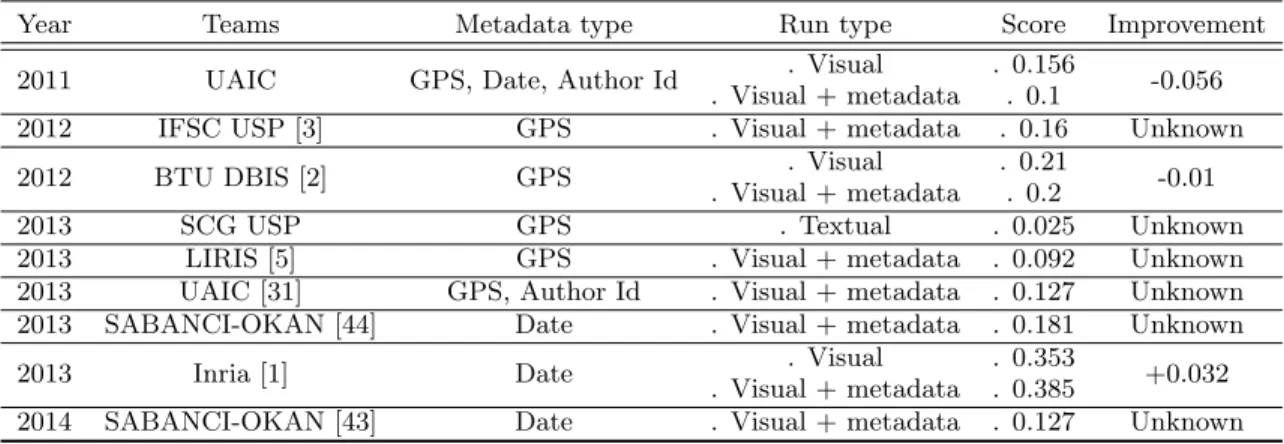
Besides purely visual concerns, we present in Table 3 the results obtained by the participants who attempted to use of the metadata associated to each image, specifically the one related to geography and seasonality. One can first see that among the large number of teams involved during the five years of the challenge, only few actually used the geo-location and date information. None of them obtained the best performance (the best identification methods were al-ways based on visual content only). The best improvement was achieved by the Inria team in 2013. It was obtained by post-filtering the list of candidate species based on a flow-ering period histogram of each species constructed from the training set (at the week level). This difficulty of success-fully using geography and seasonality is quite surprising. It is actually obvious that the habitat of a given species is highly correlated with its ecological profile. Several reasons
Table 2: Five-year synthesis of the PlantCLEF challenge (plants in their natural environment) Year #Species #Images #Evaluated
systems Score of best system Brief description of best system 2011 71 1,469 20 0.251 . Model-driven segmentation Shape features . Random forests 2012 126 2,216 30 0.320
. Multi-scale local (color) texture SIFT + Sparse coding Spatial Pyramidal Matching
. Linear SVM
2013 250 11,046 33 0.393
. Dense-SIFT, C-SIFT, Opponent SIFT HSV-SIF, self-similarity SSIM
. Fisher Vectors . Linear Logistic Regression
. Late fusion
2014 500 60,962 28 0.471
. ROI segmentation dense-SIFT + Color Moment
. Fisher Vectors . SVM on FVs 2015 1000 113,2051 18 0.667 . GoogLeNet CNN
. 5-fold bagging + Borda fusion
explain this paradox. The first one is that the occurrence data of the training set is too sparse to accurately model the distribution of the species. The second reason is that the used machine learning techniques were too straightfor-ward to well address the problem. As discussed in section 4, species distribution modeling from occurrence data is ac-tually still a hard problem in ecology, in particular in the context of uncontrolled observations such as the one used in the PlantCLEF challenge.
3.
PL@NTNET IMPACT STUDY
Pl@ntNet is among the most advanced infrastructures in the world making use of automated identification tools for monitoring biodiversity. To measure the impact of the ini-tiative, we did survey by email a large panel of authenticated Pl@ntnet users, i.e. users who created a user profile on the Pl@ntNet apps. Among the authenticated 20 859 users, and 20 003 successfully sent emails, we received a total of 719 responses within 2 weeks. The survey included a first part, common to all users, that was dedicated to the collection of personal information (place of residence, age, email and us-age frequency of Pl@ntNet). The second part was specific to the two main types of use of the application: professional vs. recreational. The part related to professionals included 22 questions, such as their job, in which sector are they work-ing (private or public), how often they use the application, to what extent this app has allowed to improve their botan-ical skills, etc. The part related to recreational included 22 questions too, such as the description of the situation that made them download the app (curiosity, gardening, hiking, etc.), if the application has changed their practices, their attention to nature, what is their interest for new functions. The survey was completed by several focus groups and in-terviews organised with representatives of different domains: (i) scientific domain (ecology, computer science) and citizen science, (ii) agriculture, (iii) biodiversity management, (iv) education.
The vast majority of respondents in the survey were lo-cated in France (85.7%) and the rest was mostly divided be-tween Belgium (4.9%), Switzerland, Spain (1.8%) and North America (Canada 1% USA and 0.8%). This is surprising as only 30% of Pl@ntNet users are actually in France (662,295 vs. 1,490,646 outside of France). The most likely reason of this bias is that the sent email was written in French and English only, and that the English translation was provided below the French one. It appears that more than 65% of users are over 40 years old. This illustrates that even if the transfer of knowledge to young people on mobile devices seems to be facilitated by the use of this device, a greater effort is needed if we want to enlarge their attractiveness to this type of initiative.
A majority of users exploit Pl@ntNet for their recreation (88 %). This can explain the peaks of use noticed since 2013, during weekends. Most of the users in this category used Pl@ntNet in a garden or during a trekking. The hor-ticultural and trekking domains are probably the two most important in which this kind of application can have a strong impact. Gardens are becoming more urban with the recent evolution of our societies. This recreational activity is mo-tivated by a variety of factors from a stronger immersion in nature to gastronomy.
Based on this survey, the proportion of Pl@ntNet use for professional purposes is about 12% (which represents a volume of 1,200,000 sessions mobilized for professional activities considering the total number of sessions of over 10M). The most frequently represented professional activ-ity is landscape management (34.6%). It includes land-scape workers, managers and architects, as well as foresters. The second category is more concerned with the produc-tion and/or transfer of knowledge (23.5%), that is to say, teachers (in botany, biology, horticulture), students (in hor-ticultural production for example), trainers (landscape man-agement, aromatherapy, herbal medicine, etc.), facilitators (botanists, nature guides) and scientists (biologists mainly). The category of ground workers represents 16% of
profes-Table 3: Impact of the use of geography and seasonality for plant species identification Year Teams Metadata type Run type Score Improvement 2011 UAIC GPS, Date, Author Id . Visual
. Visual + metadata
. 0.156
. 0.1 -0.056 2012 IFSC USP [3] GPS . Visual + metadata . 0.16 Unknown 2012 BTU DBIS [2] GPS . Visual
. Visual + metadata
. 0.21
. 0.2 -0.01 2013 SCG USP GPS . Textual . 0.025 Unknown 2013 LIRIS [5] GPS . Visual + metadata . 0.092 Unknown 2013 UAIC [31] GPS, Author Id . Visual + metadata . 0.127 Unknown 2013 SABANCI-OKAN [44] Date . Visual + metadata . 0.181 Unknown 2013 Inria [1] Date . Visual
. Visual + metadata
. 0.353
. 0.385 +0.032 2014 SABANCI-OKAN [43] Date . Visual + metadata . 0.127 Unknown
sional respondents. This category includes farmers, nurs-erymen, horticulturists and gardeners.
To further illustrate the potential future impact of Pl@ntNet, Figure 1 provides a cartography of the number of identifi-cation sessions performed through the Pl@ntNet Android version in April 2016. For the countries accounting for the most users, we provide the number of sessions as well as its increase in percentage compared to the same period in 2015 (so as to illustrate the dynamic). It first shows a strong increase in the countries neighboring France (in Italy and Spain the number of sessions was actually multiplied by re-spectively 35 and 22). This is not surprising since there is a high intersection between the floras of those countries and the one of France, which was the starting point in the first release of the Android application in March 2014. We thus observe a geographic diffusion of the usage of the applica-tion that is related to the increasing coverage of the related species in the database as well as to the media coverage. We also observe a very strong progression in South Amer-ica that is related to the release of a version of Pl@ntNet working on the Guyana flora in October 2015. Finally, we can also observe a relatively lower but still strong increase in North America whereas no specific version of Pl@ntNet was released there.
Whatever the future of the Pl@ntNet initiative in itself is, this impact study clearly shows that domain-specific mobile search technologies are attracting strong interest. We can thus hypothesize that such new practices of questioning our environment will bring a lasting production of plant and animal observations. The implicit biodiversity monitoring scenario introduced in this paper is thus realistic from a societal point of view. Now it still raises brave new research challenges.
4.
FROM EXPLICIT TO IMPLICIT PLANT
BIODIVERSITY MONITORING
Whereas previous approaches to monitor plant biodiver-sity were based on the explicit sharing of plant observations (be they partially automated or not), the new concept we introduce in this paper is the implicit detection of plant oc-currences in mobile search logs (or more generally in any stream of geo-localized user generated pictures). In recent years, we actually saw the arrival of more and more mobile search applications such as LikeThat, Goggles or CamFind,
Figure 1: Cartography of the number of Pl@ntNet Android sessions in April 2016 (increase over April 2015 in parenthesis).
that allow users to get information about surrounding ob-jects by simply photographing them These applications are still far from well recognizing any domain-specific object, but on the other side their search logs capture the user’s inter-est about the world’s objects at a very large scale and high rate. They generate quantities of geo-localized visual data that are noisy but might be used to monitor our environment and enrich its visual knowledge. In this paper, we focus on the search logs of the Pl@ntNet mobile search application, but in essence, the challenges we discuss could apply to any other mobile search application. As a concrete illustration, Figure 2 provides a small sample of geo-localized and dated image queries that were submitted to the Pl@ntNet appli-cation.
Challenge 1 - Dealing with novelty and uncertainty. Knowing how much automatically predicted labels can be trusted is essential for further data processing such as hu-man validation or direct statistical analysis. A good knowl-edge of the uncertainty of the automatic predictions is actu-ally required to select the most beneficial ones (for a given scenario) or to devise robust statistical inference methods. In our implicit biodiversity monitoring scenario, any auto-mated species detection should thus be systematically asso-ciated to a confidence score in [0, 1] quantifying the
prob-Figure 2: A sample of the geo-localized image search logs of Pl@ntNet mobile application
ability that this prediction is true, independently from the other predictions. Doing so in the context of a noisy visual data stream such as Pl@ntNet search logs is a hard problem for two main reasons: (i) the massive presence of unknown classes in the stream (because it works in an open world) and (ii), the heavily imbalanced training set (that is inevitable when dealing with biodiversity data). When launching a new country-specific instance of Pl@ntNet, the proportion of images belonging to unknown classes can for instance be very high, up to 80%. It can remain high even in the long term because of the continuous emergence of new classes. Estimating the probability of the membership to an open set of unknown classes is thus a crucial preliminary step before being able to model the ambiguity over the known classes. This is in essence a novelty detection problem (see e.g. [28] for a comprehensive review) but the fact that the data set is highly imbalanced increases the difficulty of the problem. Indeed, as the majority of the known classes in the long tail only contains few training samples, they are likely to be con-fused with the unknown classes when using classical novelty detection algorithms. To deal with this problem, it is re-quired to detect the novelty at the image level, for instance by estimating the uncertainty of the visual representation of each image during the learning process.
Challenge 2 - Enriching the training set in a col-laborative way. One of the main sources of uncertainty when trying to recognize plants in image search logs, is the lack of training data in sufficient quantity and quality. The majority of the images in the search logs do belong to either unknown classes, i.e. with no training samples in the train-ing set, or to weakly supervised classes, i.e. with very few training samples. A straightforward solution to reduce the uncertainty of the predictions is thus to enrich the training set. Actually, recent deep learning models, such as convolu-tional neural networks [24], are capable of learning very ef-fective visual features directly from the raw image pixels but to outperform the previous methods based on hand-crafted visual features, they still need to be trained on rich visual data with diverse enough visual patterns and accurate class labels. Such ideal content is unfortunately missing for the vast majority of plant species that lie in the long tail of exist-ing data distribution Large domain-specific collections such as Encyclopedia of Life (EOL) archives include quantities of well structured tags across many plant groups but they are not aimed at labeling precise domain-specific elements (e.g. spine, latex, buds, etc.), nor at covering their diversity. On the other side, computer-vision oriented data sets such as ImageNet [9] are only focused on the most popular species of the web and are too noisy from a taxonomic perspective
(mix of common, species and genus names, confusions across species, etc.).
In the end, the most beneficial way to enrich the train-ing set (and reduce the uncertainty of the predictions) is to directly annotate a fraction of the search logs themselves. Applying state-of-the-art crowdsourcing approaches in this regard is however impossible (e.g. [23, 34, 37]). First, the brute-force approach consisting of a quiz across the full list of species would only be tractable for the few specialists of a given flora, thus drastically limiting the potential number of annotators. Second, the very high number of classes (i.e. species), makes it impossible to train a complete confusion matrix for each annotator as it would require to answer to a large number of queries (typically quadratic in the number of classes). A much more promising approach is thus to devise effective collaborative active learning algorithms, i.e. learn-ing algorithms that actively select samples to be annotated as well as annotators in a joint objective. The main under-lying assumption is that even non-specialists are capable of recognizing a few tens of species (if we teach them), so that in the end, they might collectively solve complex classifica-tion tasks with thousands of classes. As in crowdsourcing algorithms, this paradigm supposes that we can model the imperfection of the annotators typically by inferring their confusion based on the labels they provide. Additionally, it requires inventing active training strategies aimed at train-ing the annotators on confusions that exist within the data. Overall, collaborative active learning poses several funda-mental questions: (i) how to optimize the selection and as-signment of the unvalidated samples? (ii) how to model the learning process of the annotators to train them effectively and complementary? (iii) how to design new machine learn-ing algorithms and/or statistical inference methods that deal with the partial knowledge of the annotators?
Challenge 3 - Using the taxonomy to reduce un-certainty. Graph-based knowledge representations such as taxonomies or ontologies are available for many domains, in particular those with high expertise such as botany. When such a rich organization of the visual class labels exists, it is likely to facilitate the estimation and reduction of the un-certainty. More precisely, it allows restricting our general problem to the case where the unknown classes occurring in an uncertain visual data stream are supposed to have at least one parent in the taxonomy of the known classes. Thanks to this relaxation, challenges 1 and 2 can be revis-ited in a radically different manner. We can actually now have a hierarchical representation of the uncertainty, typi-cally through hierarchical conditional probabilities. Such hi-erarchical structuring of the uncertainty is likely to be very effective for breaking the complexity due to an extremely large number of classes. The automatic prediction of the uncertainty of the unlabeled visual data might for instance benefit from the knowledge of the label structure by using it as a way of post-checking the veracity of a given prediction a posteriori. Concerning the collaborative active learning framework, both the active training of the annotators, the task assignment and the inference methods could be revised. For instance novices should start on easy to discriminate nodes of the taxonomy whereas the most advanced contrib-utors should tackle the leaves of the taxonomy that are the most difficult to disambiguate.
Challenge 4 - Using environmental data to reduce taxonomic uncertainty. As discussed in section 2, using
occurrence information (i.e. the geo-location and the date of the observation) did not conduct to significant identification improvement in the past PlantCLEF evaluation campaigns because of the sparsity of the occurrence in the training set. Thus, a first naive solution could be to use much larger oc-currence data such as the one collected through the world-scale GBIF initiative. However, even with such big data, sparsity would still be a challenge, in particular for the vast majority of species lying in the long tail distribution. Actu-ally, producing masses of occurrences, timely and globActu-ally, is precisely the objective of the implicit biodiversity monitor-ing scenario proposed in this paper. So that, it is somehow a chicken-egg problem. Improving plant identification systems thanks to geography would require accurate species distri-bution models but, on the other side, building such models requires large amounts of occurrence data and would clearly benefit from automated identification tools. A solution to that problem might rely in the use of external environmental data such as habitat maps[8], climate maps, soil character-istic maps, topographical maps, etc. Such data do actually less suffer from the sparsity problem and many regions of the world are well covered with such information. Thus, it might be possible to learn the ecological profile of each species by correlating its occurrences with the environmen-tal variables and then predict the likelihood of its presence in other regions. Several challenges remain. Human im-pact does notably alter the correlation between plant habi-tats and environmental variables. In cities and other highly frequented places, the presence of a species is for instance rather correlated to its usage by humans (e.g. potted plants, parks, etc.). Human equipments such as roads or railways as well as human activities such as agriculture or forestry tend to quickly and deeply modify species distribution and to fragment the habitats.
Challenge 5 - Controlling observer and detection bias in species distribution models As for any presence-only data (i.e where information is available concerning species presence but not species absence), Pl@ntNet search logs are subject to bias due to observers being more likely to visit and record sightings at some locations than others. Such observer bias has already been studied in some recent work on species distribution models (SDM) [39, 36]. The goal is typically to model species occurrence data through a distri-bution Nij p(Aij, Bij) where Aij is the relative abundance
of species i in place j (to be estimated), and Bij is a more
or less complex observer bias. In the context of the implicit monitoring scenario developed in this paper, modeling the bias is even more challenging. It actually depends on both observer bias and detection bias as illustrated by the prob-abilistic graphical model of Figure 3 that we built as a first attempt to model the problem. Incorporating taxonomic confusion in the species distribution models has in particular never been addressed before and offers brave new research perspectives at the frontier of ecological modeling and ma-chine learning. This approach might lay the foundation to a new data-driven research field, probabilistic taxonomy, that has the real potential to scale up biodiversity and pheno-logical studies to several orders of magnitude. Actually, the presence of determination errors, even with low ratios, often makes biodiversity researchers skeptical on the usefulness of crowdsourced or machine-learning based data for conducting trustable biodiversity studies. Incorporating the taxonomic uncertainty in the models and analyzing the extent to which
Figure 3: Probabilistic graphical model of observer and detection bias
this uncertainty yields error in SDM predictions, is thus a crucial step towards automatizing biodiversity monitoring.
5.
IMPLICIT MONITORING OF INVASIVE
SPECIES FROM MOBILE SEARCH LOGS
As a first step towards evaluating the feasibility of the implicit biodiversity monitoring paradigm, we conducted an experimental study in the context of the plant task of the LifeCLEF 2016 evaluation campaign. Therefore, we created and shared a new testbed entirely composed of image search logs of the Pl@ntNet mobile application (in contrast to the previous editions of the benchmark that were based on ex-plicitly shared and validated plant observations). We expect that data availability will increase in the coming years, al-lowing to make even larger sets available to the research community.
5.1
Usage scenario
As a concrete scenario, we focused on the monitoring of invasive exotic plant species. These species represent a ma-jor economic cost to our society (estimated at nearly 12 bil-lion euros a year in Europe) and one of the main threats to biodiversity conservation [40]. This cost can be even more important at the country level, such as in China where it is evaluated to about 15 billion US dollars annually [41], and more than 34 billion US dollars in the US [27]. The early de-tection of the appearance of these species, are key elements to manage them, and reduce the cost of their management. The analysis of Pl@ntNet search logs can provide a highly valuable response to this problem because the presence of these species is highly correlated with that of humans More generally, the Pl@ntNet platform has a high potential for the monitoring and early detection of threats to biodiver-sity related to human activities.
5.2
Data
We used the PlantCLEF 2015 dataset enriched with the groundtruth annotations of the test images (that were kept secret during the 2015 campaign). This data set contains 113,205 pictures of herb, tree and fern specimens belonging to 1,000 species (living in France and neighboring countries). Each image is associated with an xml file containing the
taxonomic groundtruth (and in particular the species level ClassId), as well as other meta-data such as the type of view (fruit, flower, entire plant, etc.), the quality rating (social-based), the author name, the observation Id, the date and the geo-loc (for some of the observations).
For the test set, we started with a randomized selection of 30K image queries that were submitted by authenticated users of the Pl@ntNet mobile application. Among this set, 3049 images had already been shared by their authors within the collaborative validation tools and were thus associated with a valid species name. The remaining pictures were dis-tributed to three botanists in charge of manually annotat-ing them either with a valid species name from the France flora repository or with newly created tags of their choice (and shared between them). In the period of time devoted to this process, they were able to manually annotate 4951 pictures (so as to reach 8000 images in total). Therefore, 82 new tags were created to qualify the unknown classes such as for instance non-plant objects, legs or hands, UVO (Unidentified Vegetal Object), artificial plants, cactaceae, mushrooms, animals, food, vegetables or more precise names of horticultural plants such as roses, geraniums, ficus, etc. For privacy reasons, we removed from the test set all images tagged as people (although they represented about 1.1% of the queries). In the end, the test set of 8,000 pictures in-cluded 3482 tagged with the newly created classes (i.e. the ones not in the training set of 1,000 species). Moreover it included 366 images belonging to a selected list of 26 poten-tially invasive species. This list was defined by aggregating several sources (such as the National Botanical conservatory, and the Global Invasive Species Programme) and comput-ing the intersection with the 1000 species of the traincomput-ing set. The final number of invasive specimens in the test set might appear rather low (366). However, it represents 1.22 % of the sample of Pl@ntNet queries used to create the test set. If we confront this statistic with the millions of queries collected each year through Pl@ntNet, we could hope moni-toring critical species at an unprecedented rate without any additional cost or effort for the society.
5.3
Evaluation protocol
Based on the testbed, we conducted a system-oriented evaluation involving 8 research groups who downloaded the data and ran their system. To prevent participants from tuning their algorithms on the invasive species scenario and keep our evaluation generalizable, we did not provide the list of species to be detected. Participants only knew that the targeted species were included in a larger set of 1000 species for which we provided a large training set (actually the full dataset used in PlantCLEF 2015). Participants were also aware that (i) most of the test data does not belong to the targeted list of species (ii) a large fraction does not belong to the training set of the 1000 species, and (iii) a fraction of them might not even be plants. In essence, the task to be addressed is related to what is sometimes called open-set or open-world recognition problems [30], i.e. problems in which the recognition system has to be robust to unknown and never seen categories. Beyond the brute-force classification across the known classes of the training set, a big challenge is thus to automatically reject the false positive classification hits that are caused by the unknown classes (i.e. by the dis-tractors). To measure this ability of the evaluated systems, each prediction had to be associated with a confidence score
in [0, 1] quantifying the probability that this prediction is true (independently from the other predictions).
5.4
Overview of the evaluated systems
The 8 participating research groups submitted 29 runs corresponding to different configurations of their systems. 26 were based on CNNs and the different systems mainly differed in (i) the architecture of the used CNN, (ii) the way in which the rejection of the unknown classes was managed and (iii), various system design improvements. We give here-after a few more details of the 3 systems that performed the best (on the invasive species). A more detailed description of these systems can be found in the working notes writ-ten by the participants and published in the CLEF working notes.
Bluefield system: A VGGNet [33] based system with the addition of Spatial Pyramid Pooling, Parametric ReLU and unknown class rejection based on the minimal predic-tion score of training data (Run 1). Run 2 is the same as run 1 but with a slightly different rejection making use of a validation set. Run 3 and 4 are respectively the same as Run 1 and 2 but the scores of the images belonging to the same observation were summed and normalised.
Sabanci system: A CNN based system with 2 main con-figurations. Run 1: An ensemble of GoogleLeNet [35] and VGGNet [33] fine-tuned on both LifeCLEF 2015 data (for recognizing the targeted species) and on 70K images of the ILSCVR dataset (for rejecting unknown classes). Run 2 is the same than Run 1 but without rejection.
CMP system: A ResNet [19] based system with the use of bagging in Run 1 (3 networks) and without bagging (in Run 2).
5.5
Results
Figure 4 provides the mean Average Precision (mAP) of the best fully automated systems considering only the se-lected list of 26 invasive species as queries (only the best 2 runs of each team were kept). The mAP is computed either in open-world (i.e. by considering all images of the test set) or in closed-world (i.e. by considering only the images of the test set belonging to the 1000 species of the training set). The figure shows that the presence of the unknown classes degrades the performance of all systems in a roughly simi-lar way. This difficulty of rejecting the unknown classes is confirmed by the very low difference between the runs of the participants who experimented their system with or without reject (e.g. Sabanci Run 1 vs. Run 2 or FlorisTic Run 1 vs. Run 2). On the other side, it is noticeable that all systems are quite robust to the presence of unknown classes since the drop in performance is not so high. Actually, as the CNNs were pre-trained on a large generalist data set beforehand, it is likely that they have learned a diverse enough set of visual patterns to avoid underfitting.
To better fit the implicit biodiversity monitoring scenario addressed in this paper, we completed this experiment by additional measurements more focused on high-precision op-erating points. If we would like the automatic predictions of the evaluated systems to be automatically integrated in an international biodiversity records database (such as GBIF), it is essential to guaranty a very high quality of the identifi-cation. Therefore, Figure 5 provides a precision/recall plot of the two best systems (in two configurations). The plot was obtained by varying the threshold of the confidence score t
Figure 4: mean Average Precision (mAP) on the 26 invasive species in open- and closed-world
Figure 5: Precision-recall values of best systems for highly confident operating points (probability threshold t ∈ [0.9, 0.99])
of each system and by measuring the recall and precision at each operating point. This experiment shows that for high precision values such as 0.99 or 0.95 only the Sabanci system evaluated in Run 1 is able to return results. How-ever, this high precision at the price of low recall values, around 40% on average (and much lower for some of the species). In all other systems, the trust in false positives is too high and prevents reaching high precision values accept-able for biologists. This shows that the strategy of Sabanci consisting of adding a supervised rejection class is effective for managing unknown classes although it is theoretically less elegant than devising new novelty detection algorithms. Interestingly, the run of Bluefield averaging the predictions of the images belonging to the same observation provided significant improvements in recall but failed to reach high precision operating points. This does not mean that the multi-view information should not be considered as a way to deal with novelty. It rather indicates that the averaging of the predictions of the different views in not an adapted fu-sion scheme. Other fufu-sion strategies should thus be explored so as to improve specificity.
6.
CONCLUSIONS
The new concept we explored in this paper is the auto-mated detection of plant occurrences in mobile search logs as a way to monitor biodiversity without asking the users to explicitly share and validate their observations. We showed through an impact study of the Pl@ntNet initiative that this concept is realistic from a societal point of view and that it could scale-up the world-wide collection of plant ob-servations by several orders of magnitude. To assess the technical feasibility of such an implicit biodiversity monitor-ing, we summarized five years of the PlantCLEF evaluation benchmark and organized a new dedicated evaluation task within the 2016 campaign. Results show that automated plant identification systems considerably progressed during the last years thanks to successive technological advances (aggregation-based image representations and convolutional neural networks). However, in the context of very noisy content such as mobile search logs, reaching high precision is still challenging. Jointly dealing with novelty, uncertainty and highly imbalanced training data is actually a hard prob-lem for which we suggested some new research directions. In the end, our study shows that there is still some room of im-provement before being able to automatically share implicit observations within international biodiversity platforms.
7.
ADDITIONAL AUTHORS
Timoth´ee Morin (Cirad, Umr AMAP), Antoine Affouard (Inria, ZENITH team, LIRMM), Jean-Fran¸cois Molino (IRD, Umr AMAP), Daniel Barth´el´emy (Dir-BIOS, CIRAD) and Nozha Boujemaa (Dir-Inria).
8.
ACKNOWLEDGMENTS
This work has been done throughout the Pl@ntNet project, supported by Agropolis Fondation, the French foundation for Agricultural Sciences and Sustainable Development.
9.
REFERENCES
[1] V. Bakic, S. Mouine, S. Ouertani-Litayem,
A. Verroust-Blondet, I. Yahiaoui, H. Go¨eau, and A. Joly. Inria’s participation at imageclef 2013 plant identification task. In CLEF (Online Working Notes/Labs/Workshop) 2013, 2013.
[2] T. B¨ottcher, C. Schmidt, D. Zellh¨ofer, and I. Schmitt. Btu dbis’plant identification runs at imageclef 2012. In CLEF (Online Working Notes/Labs/Workshop), 2012.
[3] D. Casanova, J. B. Florindo, W. N. Gon¸calves, and O. M. Bruno. Ifsc/usp at imageclef 2012: Plant identification task. In CLEF (Online Working Notes/Labs/Workshop), 2012. [4] G. Cerutti, L. Tougne, J. Mille, A. Vacavant, and
D. Coquin. Understanding leaves in natural images–a model-based approach for tree species identification. Computer Vision and Image Understanding, 117(10):1482–1501, 2013.
[5] G. Cerutti, L. Tougne, C. Sacca, T. Joliveau, P.-O. Mazagol, D. Coquin, and A. Vacavant. Late information fusion for multi-modality plant species identification. In Conference and Labs of the Evaluation Forum, pages Working–Notes, 2013.
[6] Q. Chen, M. Abedini, R. Garnavi, and X. Liang. Ibm research australia at lifeclef2014: Plant identification task. In CLEF (Working Notes), pages 693–704, 2014.
[7] S. Choi. Plant identification with deep convolutional neural network: Snumedinfo at lifeclef plant identification task 2015. In Working notes of CLEF 2015 conference, 2015.
[8] C. E. Davies, D. Moss, and M. O. Hill. Eunis habitat classification revised 2004. Report to: European Environment Agency-European Topic Centre on Nature Protection and Biodiversity, pages 127–143, 2004.
[9] J. Deng, W. Dong, R. Socher, L.-J. Li, K. Li, and L. Fei-Fei. Imagenet: A large-scale hierarchical image database. In Computer Vision and Pattern Recognition, 2009. CVPR 2009. IEEE Conference on, pages 248–255. IEEE, 2009. [10] A. Foncubierta-Rodr´ıguez and H. M¨uller. Ground Truth Generation in Medical Imaging: A Crowdsourcing Based Iterative Approach. In Workshop on Crowdsourcing for Multimedia, ACM Multimedia, oct 2012.
[11] K. J. Gaston and M. A. O’Neill. Automated species identification: why not? Philosophical Transactions of the Royal Society of London B: Biological Sciences,
359(1444):655–667, 2004.
[12] H. Go¨eau, P. Bonnet, J. Barbe, V. Bakic, A. Joly, J.-F. Molino, D. Barthelemy, and N. Boujemaa. Multi-organ plant identification. In Proceedings of the 1st ACM international workshop on Multimedia analysis for ecological data, pages 41–44. ACM, 2012.
[13] H. Go¨eau, P. Bonnet, and A. Joly. The lifeclef plant identification task 2016. In CEUR-WS, editor, CLEF, CLEF2016 working notes, Evora, Portugal, 2016. [14] H. Go¨eau, P. Bonnet, A. Joly, A. Affouard, V. Bakic,
J. Barbe, S. Dufour, S. Selmi, I. Yahiaoui, C. Vignau, et al. Pl@ntnet mobile 2014: Android port and new features. In Proceedings of international conference on multimedia retrieval, page 527. ACM, 2014.
[15] H. Go¨eau, P. Bonnet, A. Joly, V. Baki´c, J. Barbe, I. Yahiaoui, S. Selmi, J. Carr´e, D. Barth´el´emy,
N. Boujemaa, et al. Pl@ tnet mobile app. In Proceedings of the 21st ACM international conference on Multimedia, pages 423–424. ACM, 2013.
[16] H. Go¨eau, P. Bonnet, A. Joly, V. Bakic, D. Barth´el´emy, N. Boujemaa, and J.-F. Molino. The imageclef 2013 plant identification task. In CLEF, Valencia, Spain, 2013. [17] H. Go¨eau, P. Bonnet, A. Joly, N. Boujemaa,
D. Barth´el´emy, J.-F. Molino, P. Birnbaum, E. Mouysset, and M. Picard. The imageclef 2011 plant images classification task. In CLEF 2011, 2011.
[18] H. Go¨eau, P. Bonnet, A. Joly, I. Yahiaoui, D. Barth´el´emy, N. Boujemaa, and J.-F. Molino. The imageclef 2012 plant images identification task. In CLEF, Rome, Italy, 2012. [19] K. He, X. Zhang, S. Ren, and J. Sun. Deep residual
learning for image recognition. arXiv preprint arXiv:1512.03385, 2015.
[20] A. Joly, P. Bonnet, H. Go¨eau, J. Barbe, S. Selmi,
J. Champ, S. Dufour-Kowalski, A. Affouard, J. Carr´e, J.-F. Molino, et al. A look inside the pl@ ntnet experience. Multimedia Systems, pages 1–16, 2015.
[21] A. Joly, H. Go¨eau, P. Bonnet, V. Baki´c, J. Barbe, S. Selmi, I. Yahiaoui, J. Carr´e, E. Mouysset, J.-F. Molino, et al. Interactive plant identification based on social image data. Ecological Informatics, 23:22–34, 2014.
[22] A. Joly, H. Go¨eau, H. Glotin, C. Spampinato, P. Bonnet, W.-P. Vellinga, R. Planqu´e, A. Rauber, S. Palazzo, B. Fisher, et al. Lifeclef 2015: multimedia life species identification challenges. In Experimental IR Meets Multilinguality, Multimodality, and Interaction, pages 462–483. Springer, 2015.
[23] H.-C. Kim and Z. Ghahramani. Bayesian classifier combination. In International conference on artificial intelligence and statistics, pages 619–627, 2012.
[24] A. Krizhevsky, I. Sutskever, and G. E. Hinton. Imagenet classification with deep convolutional neural networks. In Advances in neural information processing systems, pages 1097–1105, 2012.
[25] N. Kumar, P. N. Belhumeur, A. Biswas, D. W. Jacobs, W. J. Kress, I. C. Lopez, and J. V. Soares. Leafsnap: A computer vision system for automatic plant species identification. In Computer Vision–ECCV 2012, pages
502–516. Springer, 2012.
[26] H. Nakayama. Nlab-utokyo at imageclef 2013 plant identification task. In CLEF (Working Notes), 2013. [27] D. Pimentel, R. Zuniga, and D. Morrison. Update on the
environmental and economic costs associated with alien-invasive species in the united states. Ecological economics, 52(3):273–288, 2005.
[28] M. A. Pimentel, D. A. Clifton, L. Clifton, and L. Tarassenko. A review of novelty detection. Signal Processing, 99:215–249, 2014.
[29] J. S´anchez, F. Perronnin, T. Mensink, and J. Verbeek. Image classification with the fisher vector: Theory and practice. International journal of computer vision, 105(3):222–245, 2013.
[30] W. J. Scheirer, L. P. Jain, and T. E. Boult. Probability models for open set recognition. IEEE Transactions on Pattern Analysis and Machine Intelligence (T-PAMI), 36, November 2014.
[31] C. ¸Serban, A. Siri¸teanu, C. Gheorghiu, A. Iftene, L. Alboaie, and M. Breab˘an. Combining image retrieval, metadata processing and naive bayes classification at plant identification 2013. 2013.
[32] J. Silvertown, M. Harvey, R. Greenwood, M. Dodd, J. Rosewell, T. Rebelo, J. Ansine, and K. McConway. Crowdsourcing the identification of organisms: A case-study of ispot. ZooKeys, (480):125, 2015.
[33] K. Simonyan and A. Zisserman. Very deep convolutional networks for large-scale image recognition. CoRR, abs/1409.1556, 2014.
[34] E. Simpson, S. Roberts, I. Psorakis, and A. Smith. Dynamic bayesian combination of multiple imperfect classifiers. In Decision Making and Imperfection, pages 1–35. Springer, 2013.
[35] C. Szegedy, W. Liu, Y. Jia, P. Sermanet, S. Reed,
D. Anguelov, D. Erhan, V. Vanhoucke, and A. Rabinovich. Going deeper with convolutions. In Proceedings of the IEEE Conference on Computer Vision and Pattern Recognition, pages 1–9, 2015.
[36] J. Vel´asquez-Tibat´a, C. H. Graham, and S. B. Munch. Using measurement error models to account for georeferencing error in species distribution models. Ecography, 2015.
[37] M. Venanzi, J. Guiver, G. Kazai, P. Kohli, and M. Shokouhi. Community-based bayesian aggregation models for crowdsourcing. In Proceedings of the 23rd international conference on World wide web, pages 155–164. ACM, 2014.
[38] E. M. Voorhees et al. The trec-8 question answering track report. In Trec, volume 99, pages 77–82, 1999.
[39] D. I. Warton, I. W. Renner, and D. Ramp. Model-based control of observer bias for the analysis of presence-only data in ecology. PloS one, 8(11):e79168, 2013.
[40] E. Weber and D. Gut. Assessing the risk of potentially invasive plant species in central europe. Journal for Nature Conservation, 12(3):171–179, 2004.
[41] E. Weber, S.-G. Sun, and B. Li. Invasive alien plants in china: diversity and ecological insights. Biological Invasions, 10(8):1411–1429, 2008.
[42] B. Yanikoglu, E. Aptoula, and C. Tirkaz. Automatic plant identification from photographs. Machine Vision and Applications, 25(6):1369–1383, 2014.
[43] B. Yanikoglu, Y. Tolga, C. Tirkaz, and E. FuenCaglartes. Sabanci-okan system at lifeclef 2014 plant identification competition. In Working notes of CLEF 2014 conference, 2014.
[44] B. A. Yanikoglu, E. Aptoula, and S. T. Yildiran.
Sabanci-okan system at imageclef 2013 plant identification competition. In CLEF (Working Notes). Citeseer, 2013.