HAL Id: hal-00805478
https://hal.archives-ouvertes.fr/hal-00805478
Submitted on 28 Mar 2013
HAL is a multi-disciplinary open access
archive for the deposit and dissemination of
sci-entific research documents, whether they are
pub-lished or not. The documents may come from
teaching and research institutions in France or
abroad, or from public or private research centers.
L’archive ouverte pluridisciplinaire HAL, est
destinée au dépôt et à la diffusion de documents
scientifiques de niveau recherche, publiés ou non,
émanant des établissements d’enseignement et de
recherche français ou étrangers, des laboratoires
publics ou privés.
A gate level methodology for efficient statistical leakage
estimation in complex 32nm circuits
Smriti Joshi, Anne Lombardot, Marc Belleville, Edith Beigné, Stephane
Girard
To cite this version:
Smriti Joshi, Anne Lombardot, Marc Belleville, Edith Beigné, Stephane Girard. A gate level
method-ology for efficient statistical leakage estimation in complex 32nm circuits. DATE 2013 - Design,
Au-tomation and Test in Europe, Mar 2013, Grenoble, France. pp.1056-1057, �10.7873/DATE.2013.221�.
�hal-00805478�
A Gate Level Methodology for Efficient Statistical
Leakage Estimation in Complex 32nm Circuits
Abstract- A fast and accurate statistical method that
estimates at gate level the leakage power consumption of CMOS digital circuits is demonstrated. Means, variances and correlations of logic gate leakages are extracted at library characterization step, and used for subsequent circuit statistical computation. In this paper, the methodology is applied to an eleven thousand cells ST test IP. The circuit leakage analysis computation time is 400 times faster than a single fast-Spice corner analysis, while providing coherent results.
Index Terms- Static Power, 32nm, leakage variability,
correlation coefficients, covariance method, statistical leakage estimation
I. INTRODUCTION
Leakage power increases with scaling. In addition, in nanometer technologies the variations have a large effect on leakage power [1]. Thus, accurate leakage power estimation is a key requirement in IC design.
Using MonteCarlo (MC) simulations, it is possible to obtain a relatively accurate estimation of the leakage distribution; however this is computationally expensive and not applicable on large circuits. Statistical leakage estimation which analytically estimates the leakage-current distribution of a circuit is a new and promising technique for leakage estimation (e.g. [2], [3]). There have been previous researches for estimating total leakage currents at both gate and circuit level. In [4] is presented, leakage estimation at gate level considering the effects of input vectors. But they did not consider the effect of local and global variation along with the effect of correlation between the variations on the total leakage, which is important to model. They compute the total leakage of a block using a probabilistic approach; however, they do not estimate the standard deviation of block.
In this work, the fully generic demonstrated methodology can easily predict the statistical parameters (median value and standard deviation) and the shape of the leakage probability distribution as a function of process parameters. Leakage mean and variance of individual cells, which are combined to find the total estimated leakage current, are characterized first. For an accurate analysis, correlations between cells and input state dependency are also considered.
The proposed statistical leakage estimation methodology has been applied to a complex block of eleven thousand gates (APIP), in 32nm ST Microelectronics technology.
978-3-9815370-0-0/DATE13/©2013 EDAA
II. STATISTICAL LIBRARY CELLS CHARACTERIZATION
A. Characterization flow
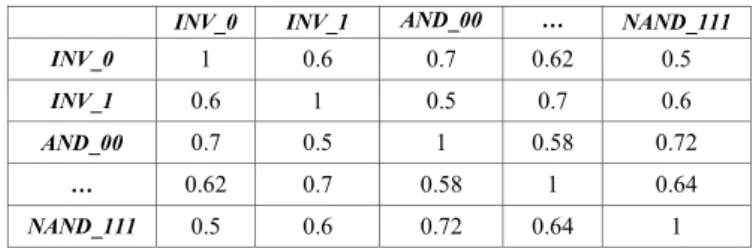
The proposed approach involves a first step of characterization of leakage power mean (μ) and variance (σ2) of each individual cell and for every input state possibility. For any cell/inputs-state combination, this is achieved using a MonteCarlo DC leakage electrical simulation, followed by simple mathematical calculations to extract the mean and variance. For the flip-flops, internal master and slave states are also considered in the combinations. At this stage, it is also necessary to build the correlation matrix between all the cell/inputs-state combinations (e.g. Table 1). To do this, we used a MC simulation embedding all cells/input states combinations without any cross-interconnections. Indeed, in 32nm high-k metal gate technology, the gate leakage is negligible, thus cells can be considered as high impedance input devices, and their interconnections have a negligible impact. Again, simple mathematical calculations are used to get the correlation factors from the simulations.
TABLE I. EXAMPLE OF CORRELATION MATRIX
INV_0 INV_1 AND_00 … NAND_111 INV_0 1 0.6 0.7 0.62 0.5
INV_1 0.6 1 0.5 0.7 0.6
AND_00 0.7 0.5 1 0.58 0.72
… 0.62 0.7 0.58 1 0.64
NAND_111 0.5 0.6 0.72 0.64 1
B. APIP cells characterization results
In this work, we have limited the library characterization to the cells used in the APIP block. Eighty three cells/input combinations were involved. To build each cell table (leakage mean and variance for each input state), as well as the full correlation table, we performed simulations with 1000 MC runs (T=125C). The cells mean and variance complete characterization took 5 hours on a single computer, while the correlations simulation took thirty five minutes. In addition, the maximum relative error achieved in the correlation matrix is 0.4% with respect to the correlations obtained by Monte Carlo simulations. Those results demonstrate that this approach can be extended to a full library characterization, while keeping a reasonable computing time. For a large number of cells, it may be relevant to split the correlation Smriti Joshi1,2 , AnneLombardot1 1 ST Microelectronics Crolles, France Marc Belleville2 , Edith Beigne2 2
CEA-LETI, MINATEC Campus Grenoble, France
Stephane Girard
3 3INRIA Montbonnot, France
simulation into several smaller ones to optimize the accuracy and the computing time.
II. GATE LEVEL STATISTICAL LEAKAGE ESTIMATION
A. Circuit Leakage Estimation flow
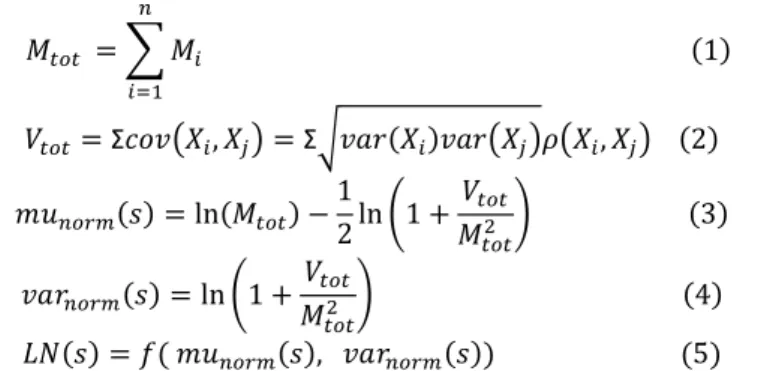
The proposed methodology is based on the approximation that the sum of lognormal distributions is approximately lognormal [5]. Figure 1 display how the parameters of approximated lognormal distribution can be deduced from the parameter of the lognormal distributions fitted to each individual cell [6]. The algorithm for estimating the probability distribution function is as following: (1) the calculation of the total mean ( ) of the final lognormal distribution LN(s); (2) the calculation of the total variance ( ) of LN(s); (3) the calculation of and (mean and variance of a normal distribution), using and ; (4) the estimation of the final lognormal distribution LN(s) using
and . 1 Σ , Σ , 2 ln 1 2ln 1 3 ln 1 4 , 5
Fig. 1. Lognormal distribution estimation ( represents mean of a cell , Xi and Xj represents any pair of cell/input state leakage values, ρ(Xi,Xj) the correlation between Xi and Xj, cov(Xi,Xj) the covariance and var(Xi) the variance )
In practical, the calculation of Vtot and Mtot, takes into
account the number of instances of each cell/input-state combination to weight the library cell statistical values. The complete flow for statistical leakage analysis and estimation is illustrated in fig. 2. It is simple, fast and can be easily merged with existing CAD design flow.
Fig. 2. Complete flow for statistical leakage analysis and estimation methodology
B. APIP statistical leakage results
The accuracy and computation efficiency of the statistical leakage analysis proposed in this paper were evaluated using as reference a fast Spice simulator, XA. Results are presented fig. 3. The probability distribution shown Fig. 3 covers all the corners estimated by XA tool. The computational time taken by the proposed methodology is nearly 400 times faster than any XA corner simulation on the same computer. To compare with MC approach on a Spice simulator, it took nearly 54hrs on ten computers in parallel, to simulate 2000 gates leakage with 1000 runs. Therefore, to get statistical leakage estimation for eleven thousand gates using MC is not feasible in terms of computation time. Our proposed approach overcomes this problem, while providing accurate results.
Fig. 3. APIP PDF distribution for leakage and XA corner simulations (x axis : log scale , y axis : PDF(I))
III. CONCLUSION
In this paper, a novel methodology to statistically estimate the distribution of the leakage current of complex circuit has been presented. It takes into account cells leakage correlations, as well as cells input state. Computation time of cells statistical leakage library characterization is compatible with existing flows. Circuit leakage estimation is very fast with a good accuracy. This method will be further extended to support spatial variations. The only required modifications are, at the characterization step, the extension of the correlation matrix adding a distance parameter, and, at the circuit estimation step, a link with the cells backend placement to determine the inter-cells distances and select the appropriate values in the correlation matrix for further calculations.
REFERENCES
[1] D.Sylvester, K.Agarwal and S.Shah, “Variability in nanometer CMOS: Impact, analysis, and minimization” in VLSI journal 41, 2008, pp.319-339.
[2] W. Kim, K.T. Do and Y.H. Kim, “Statistical Leakage Estimation Based on Sequential Addition of Cell Leakage Currents”, in IEEE transactions on VLSI , Volume 8, Issue 4, 2010,pp. 602-615.
[3] K. R. Heloue, Navid Azizi and Farid N. Najm, “Full-Chip Model for Leakage Current Estimation Considering Within-Die Correlation’’, in CAD, IEEE Transactions, 2009, pp. 874-887. [4] X. Zhao, K. Wang, X. Chang and D. Tong, “A leakage Power
Estimation Method for Standard Cell Based Design ”, in proc. IEEE Electronic Devices and Solid-State Circuits 2005, pp. 821-824.
[5] J.Wu, N.Mehta and J.Zhang, “A Flexible Lognormal Sum Approximation Method”, in GLOBECOM IEEE, 2005, pp. 3413-341.
[6] N.Johnson, S.Kotz, N.Balakrishnan, “Continuous Univariate Distributions” Vol. 1, 2nd ed., Wiley, New York, pp. 207-258.
GATE LEVEL VCD
VCD2SAIF (activity file) (extract cell/input states and cell
count ) CHARACTERIZATION (MEAN and VARIANCE for
individual cell /input states)
CHARACTERIZATION CORRELATION MATRIX
MEAN and VARIANCE CALCULATION ∑(√var(Xi)var(Xj)) ρ (XiXj) Library Characterization Statistical Estimation