HAL Id: hal-02477823
https://hal.archives-ouvertes.fr/hal-02477823
Submitted on 13 Feb 2020
HAL is a multi-disciplinary open access archive for the deposit and dissemination of sci-entific research documents, whether they are pub-lished or not. The documents may come from teaching and research institutions in France or abroad, or from public or private research centers.
L’archive ouverte pluridisciplinaire HAL, est destinée au dépôt et à la diffusion de documents scientifiques de niveau recherche, publiés ou non, émanant des établissements d’enseignement et de recherche français ou étrangers, des laboratoires publics ou privés.
Measurement and Practices of Social and Racial
Segmentation in Cali A Survey of African Colombian
Households
Olivier Barbary
To cite this version:
Olivier Barbary. Measurement and Practices of Social and Racial Segmentation in Cali A Survey of African Colombian Households. Population-E, 2002, 57. �hal-02477823�
Population-E 2002, 57(4-5),
Measurement and Practices of Social
and Racial Segmentation in Cali
A Survey of African Colombian Households
Olivier B
ARBARY*
Should cultural diversity based on ethnic or geographical origins within one population be accepted, or even encouraged? For “integrationists” the answer is no, in the interest of preserv-ing national unity; for “communalists” the answer is yes, because they refuse to ignore the diversity of identity and of historical experience. Political leaders in Colombia have chosen the second response. However, the implementation of policies adapted to the mechanisms of segregation and discrimination at work in society requires reliable information about the various groups involved. Here, Olivier BARBARY examines the difficulties of estimating the population of African descent in the city of Cali (2 million people). He begins by questioning the scientific and political relevance of such categorization, and emphasizes the importance of relating it to socio-economic and migration data.
Colombia has the second highest concentration of blacks in its popu-lation for Latin America — behind Brazil and on a par with Venezuela. Despite its demographic importance — about 18% of Colombia’s total population, or nearly 8 million people, according to recent statistical sources — and contrary to a long-standing tradition in the United States, Brazil and the Caribbean, the country’s African-origin population has been the subject of little social and demographic research. However, the major political and legal changes associated with adoption of the country’s new constitution in 1991 have fuelled a public debate over ethnic minorities in Colombia, focusing on recognition of society as multi-ethnic and, through the concrete legal measures embodied in Law 70, on the institutionaliza-tion of multiculturalism as a foundainstitutionaliza-tion of citizenship. In common with other Latin American countries, Colombia is trying to redefine the place of
*Institut de Recherche pour le Développement, Centre d’Analyse et de Mathématique Sociales, EHESS, Marseille.
2 O. BARBARY its indigenous and African American populations in national society. In this context, the case of the population of African origin raises a number of problems. First, the “historic invisibility” of Colombia’s black popula-tion, against which the pioneers of African Colombian studies and their successors reacted (see several studies by De Friedemann and Arocha), was replaced by a research output that until very recently was marked by nativist, ruralist and culturalist currents. This approach, though it can be seen to have influenced the lawmakers’ choices, provides an inadequate basis for understanding the range of current issues. Second, the question of the social condition of that population, still marked by the legacy of slavery during the colonial and later the republican period (territorial exclusion, social, economic and political marginalization), now has to be addressed in a “globalized” framework that presents contradictions of its own. Economic globalization, strongly favoured by international organiza-tions (the World Bank, the OAS, the IADB, bilateral co-operation, etc.), but also decentralization — or even regionalism — and ethnic identity and environmental protection are the main themes in the debate. The evolution of the law, however, is also an answer to the social and political movement that emerged in Colombia in the late 1980s, building on the specific condi-tions and identities of black and Indian people. The quescondi-tions addressed in this article, though they take particular form in Colombia, are thus of gen-eral significance.
The issues raised by “the black question” in Colombia are situated mainly at the regional and local levels. Administrative and budgetary decentralization was initiated in 1986 with the direct election of regional governors and mayors, and continued with the implementation of the 1991 Constitution. Elected officials and civil servants in charge of running the administration have expressed a strong demand for information on this topic. At the lower geographic level, the JAL (Juntas de acción local) and neighbourhood associations in the urban districts are also deeply involved. Lastly, although Law 70 is vague about the economic and social conse-quences of state recognition of the “black communities”, particularly the urban ones (Arocha, 1992), it nonetheless legitimates as political actors a series of social movements that have originated in the black population to promote specific claims (Agudelo, 1998; Agier and Hoffmann, 1999). For these new actors in the political arena, access to demographic, geographic and sociological information and its effective use in shaping the debate, are crucially important.
The survey on “Mobility, Urbanization, and Identities of African Colombian Populations” conducted in Cali during April and May 1998 as part of a cooperative programme between CIDSE and IRD(1) sought to
(1) CIDSE : Social and Economic Research and Documentation Centre of Del Valle
Uni-versity in Cali. IRD: Institut de Recherche pour le Développement. The team in charge of design-ing and conductdesign-ing the survey included F. Urrea, H.F. Ramirez and A. Estacio for CIDSE, and O. Barbary and S. Bruyneel for IRD. O. Barbary was in charge of survey coordination and V. Robayo of logistics.
MEASUREMENT AND PRACTICES OF SOCIAL AND RACIAL SEGMENTATION IN CALI 3
respond to the demand for information through the observation of the demographic, socio-economic and cultural situation of these populations. Among the determinants of their spatial and temporal evolution, priority was given to the ethnic factor for a diagnosis of social and racial segrega-tion in the city, equality of opportunity and discriminasegrega-tion processes. In a first stage, it was necessary to define from both theoretical and methodo-logical perspectives the observational and analytical categories employed. These questions are addressed in the first part of the article, where we take position in the debate over the use of ethnic categories in survey research, illustrating the point with results from the census in Cali. Next, we explain how these concepts were operationalized in the survey. The second part presents and discusses some of the early results, first concerning the size, racial mixture, migration, social and spatial segregation of African Colombian populations in Cali, and their perceptions of discrimination. Logistic models are used to compare the forms and determinants of the assertion of a “black identity” as revealed through self-reported questions in the 1993 census and the CIDSE/IRD survey of 1998.
I. Why and how to capture the ethnic origin
of the population of Cali?
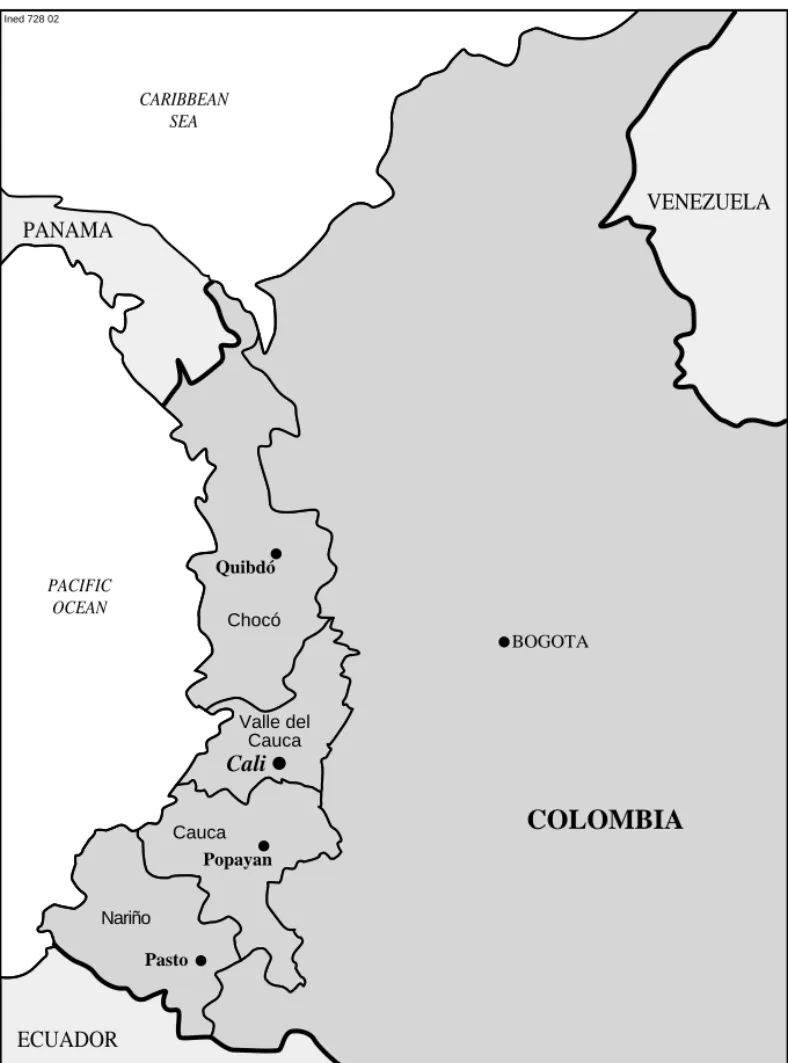
The majority of the population of the Pacific region of Colombia is black. Since the late 1970s, rural emigration to the coastal towns (Tumaco, Buenaventura) and particularly to Cali has accelerated. The regional metropolis (Figure 1) has become the country’s largest concentration of African Colombian population (Urrea, 1997, p. 115) and, through the con-centration of migrants from the Pacific region in the working-class neigh-bourhood of Agua Blanca, has acquired the image of a “black city”.
According to the 1993 census, Cali had around 116,000 migrants from municipios(2) with a predominantly black population(3), representing 7% of the total population and 15% of all migrants. A rough estimate based on the birthplaces of the parents of individuals born in Cali puts the African Colombian population resident of Cali at the time of the census at 10.5% of the total (175,000 people). In fact, however, our May 1998 sur-vey estimated the population of African Colombian households at about 27.5% of the total, or over 540,000 people. This shows the scale of the phenomenon, and also its invisibility in Colombian statistics. Generally speaking, the existing sources are inadequate for analysing the
socio-(2) The municipio is the basic administrative unit in Colombia; its area is usually larger
than that of the French “commune”.
(3) This territorial grouping that we call the “African Colombian population zone” includes
the Pacific coast of the Valle del Cauca, Cauca and Nariño departamentos, the whole of the Chocó departamento, as well as seven municipios in the northern part of the Cauca departamento (see Barbary and Ramirez, 1997).
4 O. BARBARY ECUADOR BOGOTA Pasto Popayan Quibdó Cali
COLOMBIA
VENEZUELA PACIFIC OCEAN PANAMA Chocó Cauca Valle del Cauca Nariño CARIBBEAN SEA Ined 728 02MEASUREMENT AND PRACTICES OF SOCIAL AND RACIAL SEGMENTATION IN CALI 5
economic and cultural differentials resulting from the mobility and inte-gration processes specific to the city’s different populations, let alone for studying their dynamics. Yet in a context marked by culturalist stereo-types, political rhetoric inspired by the strategies of patronage, and the instant sociology of the media, there is an urgent need for accurate, con-sistent and detailed information on the living conditions and the socio-economic and cultural characteristics of this “minority”, and all the more so where its demographic importance and migration dynamics make it an essential actor in regional development.
1. Ethnicity: a user’s guide
In 1997, P. Simon wrote that “the realization and representation of social relations along ethnic lines is one of the outstanding facts of recent decades”. But while ethnicity has indeed become a widely used analytical category in the social sciences, there is little agreement on the theoretical and methodological tools required for its use(4). In Colombia, where the headlines are dominated by the themes of armed conflict and drugs, the “ethnic issue” and its corollaries — integration/segregation, equal opportu-nities, and racism — are less prominent in political and academic discourse than they are in the United States or Europe. Here as elsewhere, however, the public debate is highly confused and usually draws on information that is either incomplete or lacking any statistical basis.
The ethnic minorities of Colombia — unlike those of Mexico or Central America but like those of Brazil — cannot be identified (nor iden-tify themselves) by any linguistic marker. The definition and legitimacy of ethnic, regional and cultural categories as tools for observation and analy-sis of the differential conditions of social and economic insertion are espe-c i a l l y espe-c o n t r ove r s i a l g ive n t h a t t h e s e espe-c a t eg o r i e s a r e o f t e n r e n d e r e d inoperative by the level of racial mixing in Colombia. The fact remains that skin colour and physical characteristics (which we will refer to as the phenotype) or certain cultural traits — whether claimed, accepted or imposed — determine social positions and relations. The “ethnic” or “racial” identities, as hybrid products of cultural, social and political structions, are central to the processes of interaction, symbiosis or con-frontation between the various social actors.
The survey conducted in Cali sought to establish a statistical charac-terization of the actors in these processes, and in particular those now re-f e r r e d t o i n C o l o m b i a a s t h e “A re-f r i c a n C o l o m b i a n p o p u l a t i o n ” . A (minority) section of this population defines itself on an ethnic basis, but
(4) In France, the collection and analysis, particularly by the official statistical apparatus,
of data on ethnic affiliation and its supposed effects, is an issue that produces contradictory ethi-cal, ideological and methodological positions, as shown by the lively debate over INED’s MGIS (Geographic Mobility and Social Insertion) survey (see Tribalat, 1996; Blum, 1998; Le Bras, 1998; Simon, 1999).
6 O. BARBARY usually it is non-African Colombians who give it this collective definition (in fact, as we shall see, based on a racial categorization). Be that as it may, most of this population lives in distinct and difficult economic and social circumstances. This is the reason we have applied a phenotypic rather than ethnic characterization to the individuals. This does not mean that we consider race to be a biological or cultural reality, but is simply a recognition that in many social contexts, semantic constructions built around phenotypes are responsible for the kinds of division, hierarchy and segregation that our observation categories are supposed to explain. Our aim is thus to use the categories that are articulated and experienced in everyday life as tools for the scientific observation of a segregated social order. In other words, to produce a diagnosis of the present state of the black question in Cali, and to counter both racist and culturalist stereo-types, we decided that the only coherent approach was by phenotypic characterization, since it is the only one that coincides with the commonly used racial categories, whose social effects we are investigating.
2. The heuristic failure of ethnic self-identification among urban populations in the 1993 census
For the first time since racial characterization of the population was abandoned after the 1918 census, and following a lively internal debate, DANE(5) inserted an ethnic question in the 1993 census. This produced high expectations among the leaders of native and African Colombian communities and among researchers. But the results of the question, as regards urban populations, were a disappointment.
For instance, in the whole population of Cali, the individuals answer-ing that they “belong to an ethnic group, an indigenous group or a black community” represented only 0.5% of the people enumerated (nationally, the proportion is 3.3%), while 95.5% gave a negative answer, and 4% declined to respond. Even more curiously, among the individuals enumer-ated in Cali who were born in the regions where the majority of the popu-lation is black and mulatto (the Pacific fringe and the northern part of the Cauca) or native and mixed-race (the Andean part of the Cauca and the Nariño), “yes” answers were again a small minority. The maximum reached among the natives of the Chocó region, where virtually the entire population is of African descent, is only 2.6%.
Many sources have criticized these figures as unrealistic; but they should not come as a surprise. Operationalizing a concept as multifaceted and vague as ethnic affiliation in a census questionnaire administered by hastily trained interviewers(6) for use on a heterogeneous, mixed-race
(5) División Administrativa Nacional de Estadística, the Colombian National Statistics
Bureau.
MEASUREMENT AND PRACTICES OF SOCIAL AND RACIAL SEGMENTATION IN CALI 7
population, was a considerable challenge. The actual word “ethnic” used in the wording of the question is not common in Colombia, and was mis-understood by some respondents. As for the phrase “black community”, the political context in 1993 gave it a militant connotation that was at odds with the spirit of the question. The real reasons for these results, however, are not methodological but historical and sociological. Unlike the United States or South Africa, Colombia experienced no institutionalized racial segregation following the abolition of slavery, and the country has no eth-nic and political movements comparable to those for civil rights in the United States or against apartheid in South Africa. In the latter countries, segregation, whether a legacy from the past or the product of present issues, including that associated with affirmative action, marks a deep division of society in the political, legal and social spheres(7), as well as in collective consciousness. No comparable institutionalization of ethnic dif-ferences has ever existed in Colombia.
Although a sense of ethnic affiliation, shared and spontaneously reported by significant population groups, is not observed in contemporary Colombia at the national level or in the main cities, a very different situa-tion prevails in the Pacific region. There, a rate of 44% “yes” answers was recorded in the census, with strong local variations whose historical, geo-graphical, economic and social determinants are examined below. For Cali, meanwhile, the census figures do not signify that social and racial discrimination is inexistent, or that only a small number of people are vic-tims of “black” or “Indian” stigmatization. But to demonstrate this, a pop-ulation classification different from that of the census must be used.
3. Observing an ethnic minority in Cali: African Colombian households and control households
From the point of view of measurement, the CIDSE/IRD survey had two major objectives. First, to reveal the behaviour, whether differentiated or not, of the African Colombian population, thus necessitating inclusion in the study of the non-African Colombian population; second, to capture the internal economic, social and cultural heterogeneity of that population, thus implying a diversification in spatial and socio-economic terms of the urban contexts being studied.
The main unit of analysis is the household, and the survey sample therefore included two sub-samples of households, selected in two sepa-rate populations, to which the same questionnaire was administered (a total of 1,880 households were interviewed).
— African Colombian households (1,504 households interviewed): households in which, in the interviewer’s opinion, at least one person in
(7) As P. Simon has analysed for the United States, this context is reflected in the use for
8 O. BARBARY the main family nucleus, i.e. the head of the household (h.h.), his or her spouse, or one of the children of the h.h. or of his or her spouse, has black or mulatto phenotypic traits. Consequently, the presence of African Colombian individuals with distant or no blood relationship with the h.h. does not identify the household as African Colombian.
— Non-African Colombian households (376 households interviewed as a control group): these are households in which none of the h.h.’s fam-ily nucleus has any black or mulatto phenotypic traits.
These definitions prompt several remarks. First, unlike for the 1993 census, they are not based on self-perception of ethnic affiliation or on cat-egorization of geographic origin by birthplaces of the individuals or their parents; instead they are based on phenotypic and external characteriza-tion applied by interviewers — the arbitrariness this entails is the neces-sary price for apprehending the “racial” categories of common language. Second, we have classified the population using a characteristic of the household, not of the individual, with a fairly broad definition for African Colombian households. In this way the analysis can be extended to a wide range of mixed-race situations, both in the biological sense (a mixed-race population) and in terms of household composition (mixed-race house-holds(8)). From this perspective, restricting attention to the main family nucleus is a limitation; but it is unavoidable because characterization of the household by the interviewer is based on visual observation of the individuals, and this has to be limited to remain workable.
Household characterization, though used to define the reference pop-u l a t i o n o f t h e t w o s a m p l e s , i s n o t m e c h a n i c a l l y a t t r i b pop-u t e d t o individuals — all persons present at the time of the visit are characterized individually. The interviewer attributes to the respondent one phenotype from among six categories that command broad semantic acceptance in Cali: negro, mulato, indigena, mestizo, blanco(9), other. In addition, in each household of the sample, one person selected for the biographical part of the survey (see infra) answers an open-ended question on his or her own skin colour(10), thereby creating a link between the respondents’
self-(8) In most mixed situations (all those occurring within the h.h.’s family nucleus), the
household is classified as African Colombian; this constitutes an additional arbitrary element in the definition and should be taken into account in the analysis.
(9) In their phenotypic sense, the adjectives negro and mulato refer to African ancestry,
dominant in the former case, combined with indigenous or European ancestry in the latter. The indigena category applies to “pure” Indians (a small minority in Colombia). The word mestizo covers all crossings of native, European and African populations, without the specific features of any one being dominant (this is the largest category), and last, the word blanco is used only for European phenotypes.
(10) The phrasing of this question is a translation of the question that has been successfully
used in Brazil’s census since 1980 : “¿Cual es su color de piel?”. In Brazil, the pre-coded ques-tion uses the following categories: “branco” (white), “preto” (black), “pardo” (mulatto), “amarello” (yellow), and “indio” (Indian). Since 1980, the phenotypic characterization of the population has become general in both public and private surveys (household surveys, market research, opinion polls, etc.). The debate in this country is no longer on the definition of those categories, which are almost unanimously acknowledged to be “useful”, but rather on how to analyse them and on the scientific, political or commercial use that is made of them.
MEASUREMENT AND PRACTICES OF SOCIAL AND RACIAL SEGMENTATION IN CALI 9
perception and their external characterization. The phenotypic category of households and individuals is thus merely one of the possible categories for population analysis, and we refer to the “population of African Colombian households” or to the “African Colombian population” (see section II). However, this vague ethnic terminology, modelled on the African American category of the United States, and which we have adopted because it is now widely used in Colombia, should not mislead; the categorization used is phenotypic. In summary, its justification rests on two main points:
1. Colombia’s black and mulatto population suffers in an objective sense from social and spatial segregation, and various forms of stigma and discrimination.
2. The processes of differentiation and division usually operate on a phenotypic, rather than ethnic, principle. We want the survey to yield information on the contents and roles of those segregating racial catego-ries, as expressed in the discourse of the protagonists.
Lastly, some precautions are in order when analysing the figures pro-duced using these different characterizations of the population. The defini-tion of the main family nucleus included children of only one of the partners and those adopted by the head of the household or his or her spouse. But this extension was not always understood or accepted by sub-jects, and African Colombian households, as identified on our definition, may as a result be slightly under-counted (see Table 1). Furthermore, when the members of a household were repeatedly absent at the time of visits, the household sometimes had to be characterized indirectly by using state-ments from neighbours; however, since the phenotypic categories used are based on a wide consensus, we believe that those few indirect characteri-zations will not introduce any bias. The most serious question concerns the possible effect of the interviewer’s phenotype, and more generally of the interviewer/respondent interaction, on the subjective questions and particularly the one about skin colour. Half of the interviewers were black or mulatto (10 out of 20), the other half were white or mixed-race; half were men and half women. Analysis of the results (see infra) reveals that the effect of gender is as significant as that of phenotype, and that the interviewer’s characteristics have a small influence. Among all the persons externally characterized as black or mulattos, the proportion of those char-acterizing themselves as having a black skin is 3–4% higher among those who were interviewed by men or by persons who were also black or mulatto (though the effect is no longer significant when “negra’” and “morena” answers are aggregated).
Overall, the inevitable variations that occur in the characterization of individuals and households by interviewers had no systematic influence either way on the size of a given population. The distinction between African Colombian and non-African Colombian households is thus statis-tically operational and, as will be seen in the next section, is pertinent
10 O. BARBARY when comparing the characteristics of households and individuals living in different “socio-racial” environments.
Beyond these methodological issues, however, the measurement of demographic, economic or cultural attributes, which is necessary, in the words of A. Desrosières(11), for “social facts to become things”, cannot reify or naturalize any category, and even less so in the case of a pheno-typic classification. There are strong methodological conditions for our approach not to produce the bias rightly criticized by A. Blum:
“[…] of building categories that are either meaningless or merely vague expressions of ‘common sense’. There is serious risk of producing an illusion of coherence and of favouring this stratification at the expense of any genuine confrontation between various determinants.” (Blum, 1998, p. 576, my emphasis).
Among these determinants, the writer emphasizes the importance of the variety of the migrants’ itineraries and the multiple factors underlying them, and concludes that the ethnic or social categories “observed” at the time of the survey cannot be analysed without reference to individual life histories (ibid, p. 586) — an opinion that we fully share. In fact, because of its high mobility in particular, Colombia’s black population has no homog-enous demographic, social or cultural characteristics. Analysis must thus be based on an observation system (concepts, sampling(12), question-naires) that can handle all the factors of heterogeneity — the geographic origins of migration flows, inter and intra-urban residential itineraries, cir-cumstances of economic, social and cultural insertion, etc.
This objective in particular influenced the design of the question-naire(13) (Barbary, 1998). The first part deals with the characteristics of the household and the individuals: housing conditions (or characteristics) and appliances available to the household, social and demographic characteris-tics of its individual members (observed phenotype, sex, age, civil status, educational level, main and secondary activities, a summary of their migration history, their places of residence during the year before the sur-vey in the metropolitan zone), visits to place of origin, the household’s social and political participation and network of domestic solidarity. The second part corresponds to the methodological imperative emphasized above and takes the form of an interview with one household member aged at least 18, about his or her residential, familial and occupational his-tory(14). Lastly, there are two modules of open-ended and semi-open-ended
(11) Desrosières, 1993, p. 412. This book is a reference for analysis of the historical and
social processes in the construction of statistical categories.
(12) Interested readers can find a full account of the sampling methodology in Barbary
et al., 1999, pp. 15-19.
(13) It is based on the experience acquired through various IRD, INED, INSEE and DANE
surveys. M. Agier (anthropologist), O. Barbary (statistician), O. Hoffmann (geographer), P. Quintin (anthropologist), F. Urrea (sociologist) and H.F. Ramírez (statistician) contributed to its development.
(14) See the methodological summary recently published by the Biographical Approach
MEASUREMENT AND PRACTICES OF SOCIAL AND RACIAL SEGMENTATION IN CALI 11
questions on perceptions and opinions of the person who has participated in the biographical survey, dealing with two themes of particular interest to the study: (i) discrimination and (ii) the quality of life in the neighbour-hood and violence.
II. Early results and analytical goals
Processing of the survey started three years ago and is yielding far more information than can be summarized here(15). We present only cer-tain preliminary conclusions concerning three questions that are central to this study. How to identify and characterize Cali’s African Colombian population? What assessment can be made of social and racial segregation in the city, and its perception by the respondents? What are the main deter-minants of the answers to questions on ethnic self-perception and skin col-our asked in the census and the survey? The answers we supply, though still incomplete, lead to a set of more detailed hypotheses that will serve to guide future analysis.
1. The African Colombian population in Cali: numbers, racial mixture, mobility
For the purposes of social and demographic characterization, three definitions have been selected for the “African Colombian” population:
1. the population of African Colombian households, i.e. the popula-tion of households in which the interviewer has attributed the black or mulatto phenotype to at least one member of the main family nucleus;
2. the black or mulatto population, i.e. the population of individuals who were characterized as such by the interviewer;
3. the population of people who described their own skin as black (negra), mulatto (mulata) or dark brown (morena), i.e. those people who, in answering the question “¿Cuál es su color de piel?”, used one of the three adjectives that clearly denote, in the Cali idiom, African ancestry.
The first contribution of the survey is an estimation of the numbers in each of these categories and their complement — i.e. the “non-African Co-lombian” populations (Table 1). The most remarkable feature is the dis-crepancy between the African Colombian population estimated from
(15) The survey was wholly funded by Colciencias, the Colombian public research agency.
The first results, which were presented at an international seminar in Cali in December 1998, are in CIDSE’s “documentos de trabajo” series, nos. 38 (Barbary et al., 1999), 39 (Agudelo, Hoffmann, Rivas, 1999), 40 (Vanin, Agier, Hurtado, Quintín, 1999), 41 (Rivas, 1999), 42 (Hoffmann, Pissoat, 1999), 48 (Arboleda, Arias, Urrea, 2000), 49 (Quintin, Ramirez, Urrea, 2000) and 50 (Agudelo, Hurtado, Rivas, 2000).
12 O. BARBARY census data and that observed in the survey. We knew that the proportion established by the census (10.5%) was greatly underestimated, but our highest hypotheses (about 16%) proved to be far below reality — in the survey sample it is actually about 30% for the population of African Colombian households. The figures for individuals characterized as black o r m u l a t t o ( 2 5 % ) a n d f o r t h o s e w h o i d e n t i fi e d t h e m s e l ve s a s s u c h (17.6%) — the latter figure is to be compared with the 0.5% rate registered by the ethnic question in the census in Cali — reveal the extent of the invisibility of the urban African Colombian population in the existing Colombian statistical system. A second survey using the same methodol-ogy and conducted one year later for the World Bank and the Cali munici-pal authority roughly confirms these figures. In June 1999 the population of African Colombian households in Cali comprised 769,000 people (37% of the total population) and the population characterized as black or mu-latto was 606,000 (31%). The difference with the 1998 survey is accounted for by the much higher figure for the mulatto population (19% as against 10% in the CIDSE/IRD survey), at the expense of the mixed-race popula-tion (22% as against 28%). The discrepancy illustrates the importance of the interviewers’ training and of a semantic consensus about the pheno-typic categories. Once these results were known, the Colombian National Statistics Bureau included a social exclusion module in the most recent household survey covering the 14 largest cities in the country; this con-tained a statement by the respondents themselves on their skin colour, established by reference to a set of four photographs they were shown (ENH, DANE, 2001). Cartagena is the only city in which a majority of the population self-identified as black and mulatto (50%), whereas in Cali a proportion of 26.5% was registered for the photographs corresponding to these two phenotypes together — a figure close to that obtained in our sur-vey using external characterization by the interviewers. The mean figure for all 14 towns was 17.9%, a figure that again should be compared with the 3.3% national average obtained from the ethnic question in the census. We believe that this set of results provides strong a posteriori validation of the options chosen for the survey.
Another significant finding, displayed in the second panel of Table 1, is the extent of racial mixing among the populations of Cali — this affects both the African Colombian and the control households, and is observed both in its “biological” dimension (the proportion of mulatto and mixed-race populations) and in household composition (the frequency of inter-racial unions). By the interviewers’ characterization, only 48% of the indi-viduals were black in the African Colombian households, and 63% were white in the non-African Colombian ones. The respondents’ answers con-firm the importance of the phenomenon by showing the diversity of the individuals’ “phenotypic position”, and hence the need to treat with cau-tion the classificacau-tion of households made by the interviewer. Respondents select the “racially tainted” colours (negra, morena, mulata, blanca) less often than the corresponding external classifications (negro, mulato,
MEASUREMENT AND PRACTICES OF SOCIAL AND RACIAL SEGMENTATION IN CALI 13
blanco); the largest disparity is for the “blanco” category (46% of the interviewers’ characterizations for all the households, as against 30% of the respondents’ statements). In fact, a majority of respondents (53%) opted for mixed-race colours (canela, trigueña, castaño, café, etc).
A third important finding concerns the migration structure of the African Colombian population, which again diverges from that obtained by the census. First, African Colombian households contain twice as many Cali natives (57%) as expected(16)— a figure close to that observed in the
TABLE 1.– POPULATIONESTIMATES BY PHENOTYPICCHARACTERIZATION
Population by interviewers’ characterization of households(1)
Interviewers’ characterization Households Individuals in households Numbers % Numbers % African Colombian households 106,085 29.8 460,873 29.7 Control households 249,581 70.2 1,091,743 70.3 Total 355,666 100.0 1,552,616 100.0
Distribution of individuals by interviewers’ characterization(2)
Interviewers’ characterization Negro Mulato Indígena Mestizo Blanco Otro Total African Colombian households
(%) 47.9 33.2 0.6 11.5 6.7 0.1 30.4 Control households (%) 0.3 0.5 1.0 35.1 63.2 0.0 69.6 Total (%) 14.7 10.4 0.9 27.9 46.1 0.0 100.0 Numbers 191,126 134,912 11,237 361,674 596,928 303 1,296,180
Distribution of individuals by respondents’ self-characterization(3)
Respondents’ self-characterization Negra and assim. Morena, Mulata(4) Canela and assim.(5) Trigueña and assim.(6) Blanca and assim. Other answers Total African Colombian households
(%) 32.4 19.8 8.2 33.1 4.5 2.0 29.8 Control households (%) 0.7 2.1 10.2 40.0 40.4 6.6 70.2 Total (%) 10.2 7.4 9.6 38.0 29.7 5.2 100.0 Numbers 36,146 26,303 34,021 135,085 105,641 18,470 355,666
(1) The numbers of households and individuals are extrapolated to the whole population covered by the
survey—355,666 households and 1,552,616 individuals, i.e. about 78% of the total population of the city (1,982,000), as estimated by projection of the census population to 30 June 1998.
(2) The distribution is that observed among individuals visually characterized by the interviewers: 7,022 of
the 8,250 people included in the sample, or 85%. These data are weighted by the survey’s extrapolation fac-tors.
(3) The distribution is that observed among individuals who answered the open-ended question on skin
colour (1,824 out of the 1,880 people who were asked the question), and who can then be considered to be representative of the population aged 18 and over (“biographic” sub-sample). The answers were classified using the adjectives mentioned, used alone or with other words. These data are weighted by the survey’s extrapolation factors.
(4) Dark-skinned, mulatto; (5) Cinnamon; (6) Literally “wheat-coloured”, usually translated as light brown or
olive.
Source: CIDSE/IRD survey, June 1998.
(16) This occurred because, as noted, a large proportion of the Cali-born descendants of
migrants could not be included in the census estimate of the population “of African Colombian origin”, strictly on the basis of place of birth.
14 O. BARBARY control households (59%), thereby giving the lie to the connection often made in the literature between the black population and recent migration. In addition the places of origin of African Colombian migrants to Cali are surprisingly varied(17). The Pacific region is of course confirmed as the foremost place of origin (42% of the total), but the urban and rural hinter-land of Cali (the northern part of the Cauca departamento and other
muni-cipios of the Valle) makes a large contribution (33%). And above all, the
volume of medium- and long-distance migration from regions outside the area with a majority of black population — mainly the altiplano of the Cauca and the Nariño, the coffee plantations area, the Antioquia and Bogota — accounting for 25% of the total, far exceeds earlier hypotheses. Such diversity of geographic origins attests to the high mobility that char-acterizes the recent history of Colombia’s black populations and is doubt-less associated with a rich variety of migration itineraries, the details of which can be established from the analysis of the biographical data gath-ered in the survey.
2. Segregation and discrimination: Leads for the analysis... and the respondents’ point of view
As a corollary of inter-racial unions and diversity of origins and migration histories, we expect the African Colombian population to be very heterogeneous with respect to social and economic conditions. Analysis of the results produces detailed conclusions, of which only a summary can be presented here.
The survey has confirmed a generally accepted view — namely that the social and spatial segmentation of the Cali urban space coincides with segregation of the black population(18). The phenomenon is observed both at the residential level, with a relative concentration of this population in the city’s poorest areas (Barbary et al., 1999, pp. 37-41, 71-76), and in the living conditions of the households, with wide disparities, always to the detriment of African Colombian households, on such indicators as over-crowding of housing, access to public services, and home appliances (ibid. pp. 53-61). More detailed analysis, however, shows that the process behind such situations is complex and that its intensity varies greatly depending on other factors of spatial or socio-economic segmentation. Bruyneel and Ramirez, for example, have shown that for overcrowding of the home, the relative disadvantage of African Colombian households is the same at all points on the social scale (ibid. p 56), whereas for access to
(17) For a detailed analysis of migration flows and their recent dynamics, see Barbary et al.,
1999, pp. 41-49.
(18) According to detailed statistical measurements of spatial segregation (dissimilarity and
square root indices, Hutchens, 2001) which cannot be described in detail here, the degree of seg-regation of the black population in Cali is still far below that in US cities (see Dureau, Barbary et al., 2002). There the index values are 5–10 times higher, to judge from the extensive American lit-erature on the theme, a good methodological and empirical summary of which is given in Massey and Denton, 1988, and updated in Massey, White and Phua, 1996.
MEASUREMENT AND PRACTICES OF SOCIAL AND RACIAL SEGMENTATION IN CALI 15
services and household appliances, it is concentrated in its middle range, the poorest and richest households having parity with their non-African Colombian counterparts (ibid. pp. 58, 59). Moreover, these segmentation mechanisms cannot be analysed simply as an endogenous product of a social order segregated on racial lines; they are also the result of the strat-egies and opportunities specific to the migration networks of the popula-tions with different geographical and social origins (ibid., pp. 41, 49, 87 and 88). Those origins are extremely important as a factor of differentia-tion of the African Colombian populadifferentia-tion but also of internal heterogene-ity. Accordingly, the geographic, economic and cultural segmentation of the complex set of origins and itineraries that determine social and spatial segregation in Cali is of central interest for analysis.
Despite this heterogeneity, the diagnosis that emerges from the sur-vey population’s perceptions and opinions regarding discrimination is unequivocal: the majority opinion in Cali, among people of all skin
col-ours and social conditions, is that discrimination does exist, in
employ-ment and in other situations, usually against blacks, but also against Indians, the poor, the elderly, women, etc. Of the people interviewed, 65% r e p l i e d “ y e s ” t o t h e q u e s t i o n o n t h e ex i s t e n c e o f d i s c r i m i n a t i o n a t work — 60% among control households, 77% among African Colombian households, and rising to 82% among those women who were character-ized as black. Moreover, over one-third of the people who believe that dis-crimination exists think it is frequent (believing it to be practised by many if not most employers). The respondents clearly identify the two major reasons for occupational discrimination as racial identity and social class: 55% mentioned blacks as the largest category of population experiencing it, and 24% the poor and the uneducated. The elderly (5%), women (3%), the young (2%), and Indians (0.5%) come far behind. Likewise, over half the members of the sample believe that blacks are treated less well by the police and in the workplace, and about 30% believe the same is true in hospitals and health centres, in primary and secondary schools, in public transportation and in dealings with officialdom. The only exception con-cerns the existence of racial discrimination at the neighbourhood level, which was rarely mentioned (18%). Lastly, 32% of the black population said that they had personally suffered discrimination, compared with only 15% of the mulatto population and 10% of the white population. Such sit-uations are even more frequent in certain segments of the population, almost always in employment contexts: black women employed as domes-tic servants, black persons discriminated against in company recruitment, particularly in the retailing sector. Skin colour is again given as the prime reason for discrimination( 1 9 ), with social class and sex only coming next(20), though explicit references to both types of factors are quite
fre-(19) “por ser negra(o)”, “por negra(o)”, “por el color de piel”... “because I’m black”, “as a
black person”, “because of my skin colour”, etc.
(20) “por no haber estudiado”, “por ser pobre, a uno lo tratan mal”, “por vivir en el
dis-trito”, “por ser mujer”... “because I’m not educated”, “when you are poor, you are ill-treated”, “because I live in the district”, “as a woman”, etc.
16 O. BARBARY quent(21). The respondents thus give a timely reminder that the racial and social motors of discrimination operate in parallel, by intensifying biolog-ical and socio-cultural differences, usually without distinguishing between them.
Significant variations(22) do of course occur in the perception of dis-crimination. For example, the data show women to be more aware of it, their frequency of “yes” answers being usually higher than men’s, which is explained by the cumulative impact of the risks of racial, social and gender discrimination. In the same logic of exposure to risk, a phenotype-based gradient is also observed, though not running strictly from clearest to darkest skin colour. Frequencies generally increase in the following order: Indians, Mixed-race, Whites, Mulattos, Blacks. In his study on the population of Medellin, P. Wade (1997) gives a good analysis of the con-struction of racial identity among the mixed-race majority and of how it is used socially and culturally in the paisa region, the symbolic heart of the Colombian melting pot. The same “whitening-up” strategies he observes and that he links to “the racial order” established by the Creole elites, are probably also at work in Cali, “the black city”. They would account for the relatively low levels of racial discrimination reported by the indigenous and mixed-race population.
Having said that, the diagnosis given by the white and mixed-race population is consistent with that of African Colombians, and sometimes equally harsh, as for example concerning police prejudice against blacks or the frequency of discrimination at work. This is the first element that qualifies the picture drawn so far of racial inequality in Cali — the black population is not alone in finding its condition shocking, and high levels of awareness and solidarity are observed in white and mixed-race public opinion. Further evidence of this is the low frequency noted earlier of racial discrimination felt to exist within neighbourhoods, which is not explained by a racial and social homogeneity that seldom exists at this level. Likewise, instances of violence personally experienced by the respondents are rarely attributed to racism. This lack of a connection between racism and violence, in a country where the latter is considered endemic, contrasts with other national contexts, such as the United States and Europe, and invites in-depth analysis of the theme to uncover the sources and social effects of this “quiet Colombian-style racism”. A hypothesis can thus be formulated: although discrimination by skin colour undoubtedly exists in Cali, it would appear not to be primarily the expres-sion of common, everyday racism pervading social relations. In fact,
(21) “por ser negra y pobre”, “dis que por no ser bachiller y ser negra”, “por no tener
estu-dios y ser pobre”, “por ser pobre y vivir en Siloé”, “ser mujer pobre”... “because I’m black and poor”, “they say it’s because I haven’t been through secondary education, and because I’m black”, “because I’m uneducated and poor”, “because I’m poor and I live at Siloé”, “to be a poor woman”, etc.
(22) i.e. after the sampling error has been taken into account, usually at the 99% confidence
MEASUREMENT AND PRACTICES OF SOCIAL AND RACIAL SEGMENTATION IN CALI 17
Cali’s reputation as a welcoming city is justified, and is based on a social climate that is still calm, albeit threatened by the severe political and eco-nomic crisis affecting the country. What respondents criticize most, it seems to us, is the “institutional” discrimination in companies and public
or private services, where it is usually intertwined with class relations.
But more analyses are needed to support this thesis, as an opinion survey alone cannot provide a conclusive demonstration.
3. Variations in the assertion of a “black identity”
With the 1993 census and the 1998 CIDSE/IRD survey we possess two bodies of answers about ethnic and phenotypic self-perception. We are thus in a position to relate those answers, first with the individual social-demographic variables provided in both sources (sex, age, education, socio-occupational category), second with the descriptors of the context in which they were given — geographic location of residence, size of locality, zone of residence and migration status of the individuals interviewed in Cali. With this second group of variables, and using the resources of the bibliography, we can obtain data on the regional and local environments and their political and cultural dynamics, whose influence is expected to be significant. Lastly, in the case of the survey conducted in Cali, two more potential determinants are also available — the individuals’ pheno-types as observed by the interviewers, and the interviewers’ own charac-teristics (sex and phenotype).
What combination of these factors accounts for the variations of eth-n i c s e l f - p e r c e p t i o eth-n i eth-n t h e b l a c k p o p u l a t i o eth-n a r e a o f s o u t h - w e s t Colombia(23), and of self-perception of skin colour among the African Colombian population of Cali? What hypotheses does the analysis suggest about the process of constructing a “black” identity in Colombia and about the variations in its form depending on the context of the actors’ speech and their individual or collective characteristics? We supply some tenta-tive answers by using logistic regressions to model the effect of the explanatory variables on the two response variables(24):
1. Answers to the ethnic question in the 1993 census are coded “Yes” for persons who answered that they belong to a “black community”. 2. Answers to the question on skin colour in the CIDSE/IRD survey are coded “Yes” for persons whose answer included the adjective “black”, either alone or in an affirmative context.
(23) This is taken here to mean all the Pacific coast municipios in the departamentos of
Valle del Cauca, Cauca and Nariño, and the whole of the Chocó departamento.
(24) The procedures used are LOGISTIC and CATMOD, from SAS (version 6.08), in
which this test is based on Wald’s chi-square statistic (1943). Unfortunately the sampling design cannot be taken into account with this version. Since the test is very sensitive to sample size, we have used the unweighted data for the CIDSE/IRD survey.
18 O. BARBARY
In the Pacific region at the time of the census
Although the ethnic question in the 1993 census failed, as noted, at the national level and in the larger cities, it successfully measured at both general and local levels the assertions of black community affiliation in the Pacific region. For the whole population aged 18 and over, the fre-quency of “yes” answers was 44.5%, with large local variations, ranging from only 3% on the Pacific coast of the Valle (Buenaventura municipio), to 27% on the Pacific coast of the Nariño, 71% on that of the Cauca and 81% in all the southern and central municipios of the Chocó, and to over 95% in the north of this departamento and in its capital, Quibdó. It is tempting to see this as the influence of the emergence of the “comunidades
negras” social movement and of the economic and territorial stakes
involved. This movement actually originated in Quibdó and in the rural area north of the Chocó in the late 1980s, and shortly before the census, it obtained the passing of Law 70. Logistic regression confirms the hypothe-sis of a strong relation between this process and the self-characterization of ethnic affiliation.
In the complete model of the main effects (Table 2), the six parame-ters corresponding to the variables considered independently from one another (sex, age, education, socio-occupational category, size of locality and region of residence) are all significant(25). However, the effect of the regional context is clearly stronger than all the others. It accounts for a pro-portion of the variance in the answers ten times larger than the next two effects, which are socio-occupational category and size of locality. Sex and education, by contrast, have very small effects. All other things being equal, therefore, the residents of a municipio in the northern Chocó are three times more likely to answer “yes” than those on the Pacific coast of the Nariño, whereas on the Pacific coast of the Valle, the probability is four times smaller. Also clear is the role of socio-occupational category: the sta-tus of independent or family workers in agriculture, fishing and mining (a positive effect, particularly in the mining sector where the probability is 2.5 times greater) contrasts with that of blue-and white-collar workers and employers in all sectors (probability reduced by 5 to 10%). For the size of place of residence, the second-order interactions model (not presented in tabular form) shows that its main effect gives way to crossed effects of socio-occupational category and region of residence. The model thus iden-tifies the social and geographic “niche” where assertion of ethnic identity is strongest — among independent or family workers of the mining industry in villages with populations under 5,000 but mainly in small towns of the Chocó with populations of 5,000 to 50,000. Lastly, it should be noted that
(25) Possible interactions cannot be ruled out with this model, as the hypothesis of
inde-pendence between the variables is rejected; despite this, the adjustment of the marginal frequen-cies is quite good (standard deviation of residuals: 8%). On the other hand, the independence hypothesis can be accepted for the model that includes all second-order interactions (no higher-order crossed effects), and we discuss some of those results.
MEASUREMENT AND PRACTICES OF SOCIAL AND RACIAL SEGMENTATION IN CALI 19
in the interactions model, the assertion of ethnic identity is strong among those residents in the northern Chocó with higher education, who played a key role in the mobilization that led to constitutional reform and to Law 70. These results have to be interpreted against the “neo-communalist” background of the political birth of the African Colombian identity. As M. Agier points out:
“It was only with development-oriented policies for the Pacific region, and with the rise, on the global scale (…), of a discourse favourable to regionalism, localism, ethnic identity and environmental protection, that the Pacific African Colombian identity began to emerge, between the 1980s and the 1990s”(26).
Access to the status and subsidies instituted under Law 70 was con-ditional on the creation of a cultural and ethnic identity linked chiefly to a territory (the rural regions of the Pacific coast) and to an economic system of resource use based on small family business combining agricultural, fishing and mining activities. Since both are under threat (Agier et al., 2000, p. 18), it is not surprising that the populations most directly con-cerned by the new legal measures “conform as closely as possible” to the affirmation of a neo-ethnic identity that the constitution, in a sense, demands of them.
In this context, modelling the responses to the census question reveals an assertion of black community membership that could be described as “neo-ethnic”, and that is socially and politically instrumen-talized by a set of actors. This approach, however, does not inform about the problem of the black and mulatto populations who migrated out of the geographical area covered by Law 70 and who now form the majority. What are the implications for the processes of construction of a black identity in the cities given that, as we have seen, a neo-ethnic assertion is almost or completely non-existent in that setting? If these processes exist, on what are they based?
In Cali during the survey
The data collected in Cali provide us, in addition to the variables already considered (sex, age, education, socio-occupational category), with four new variables. These are the respondent’s phenotypic characteri-zation as observed by the interviewer, the interviewer’s sex and pheno-type(27), the residential zone in Cali(28), and the migration status(29). The
(26) Agier et al., 2000, p. 61.
(27) Four categories: black or mulatto female, black or mulatto male, white or mixed-race
female, white or mixed-race male.
(28) Four categories: working-class areas in the east of the city, middle-class areas near the
centre and in the east, working-class areas on the western outskirts, residential areas in the south of the city.
(29) Fifteen categories obtained by crossing birthplaces — Cali natives vs. migrants — with
places of origin, the latter being defined as the region where the migrants or, in the case of natives, their parents were born (in the CIDSE/IRD survey, the parents’ birthplaces were known for all the individuals).
20
TABLE 2.– EFFECTOFSIXVARIABLESONTHEPROBABILITYOF “YES” ANSWERSTOTHEQUESTION ONBLACKCOMMUNITYMEMBERSHIPINTHECENSUS (LOGISTICREGRESSION)
1. Chi-square test for variables in the model
Variables Degrees of freedom χ2 Probability
Constant 1 0.41 0.5237
Sex 1 80.08 0.0000
Age 2 209.26 0.0000
Level of education 5 1294.58 0.0000 Socio-occupational category 16 6693.06 0.0000 Size of the place of residence 4 5052.80 0.0000 Region of residence 5 57650.91 0.0000
2. Estimation of the parameters
Categories of the variables Estimated parameter Significance Estimated response (obs.-est.)Residual Marginal effect
Constant – 0.00820 n.s. 49.8% – 5.3% Men – 0.0525 *** 25.5% – 1.8% – 2.1% Women (Ref.) 0.0525 27.6% 5.6% Aged 31-50 0.00626 n.s. n.s. n.s. n.s. Over 50 – 0.1044 *** 23.7% 1.7% – 3.9% Aged 18-30 (Ref.) 0.09814 27.6% 5.6% No education or no answer 0.3710 *** 32.2% 2.2% 4.6% Uncompleted primary education – 0.1604 *** 21.8% 2.0% – 5.8% Uncompleted secondary education – 0.0536 *** 23.7% – 1.9% – 3.9% Completed secondary education – 0.1148 *** 22.6% – 5.2% – 5.0% University education – 0.1928 *** 21.2% 1.0% – 6.3% Completed primary education (Ref.) 0.1506 27.6% 5.6%
21
Non-working 0.0961 *** 33.6% – 13.6% 6.0% Students 0.1648 *** 35.1% 10.4% 7.5% Unemployed – 0.0997 *** 29.3% – 10.4% 1.8% Domestic workers – 0.3742 *** 24.0% – 10.3% – 3.6% Blue-and white-collar (B/W) workers, sector unknown – 0.1681 *** 27.9% – 5.7% 0.4% B/W, Agriculture-Fishing-Mining-Construction-Transport – 0.5120 *** 21.6% 0.5% – 6.0% B/W, Industry-Electricity-Gas-Trade-Services – 0.4247 *** 23.1% – 11.6% – 4.5% B/W, Financial and Housing, Public Sector 0.00113 n.s. n.s. n.s. n.s. Status unknown, Agriculture-Fishing-Mining-Construction-Transport 0.3415 *** 39.2% 7.5% 11.7% Status unknown, other sectors 0.0162 n.s. n.s. n.s. n.s. Self-employed and family workers (SE/FW), sector unknown 0.3187 *** 38.7% 0.5% 11.1% SE/FW, Agriculture and Fishing 0.3445 *** 39.3% 25.4% 11.7% SE/FW, Mining 1.4624 *** 66.4% – 3.3% 38.9% SE/FW, other sectors – 0.1917 *** 27.5% – 13.2% – 0.1% Employer, Agriculture-Fishing-Mining – 0.3769 *** 23.9% 9.4% – 3.6% Employer, other sectors – 0.4110 *** 23.3% 76.7% – 4.2%
Homemakers (Ref.) – 0.18703 27.6% 5.6% Urban < 5,000 persons – 1.1882 *** 6.2% – 6.2% – 21.3% Urban 5,000-49,999 0.8757 *** 34.4% 12.8% 6.8% Urban 50,000-99,999 – 0.0173 n.s. n.s. n.s. n.s. Urban > 100,000 – 0.2254 *** 14.8% – 3.8% – 12.7% Rural (Ref.) 0.5552 27.6% 5.6%
Pacific Coast of the Cauca 0.1087 *** 68.3% – 8.2% 40.8% Pacific Coast of the Valle – 3.3417 *** 6.4% – 2.8% – 21.1% Southern part of the Chocó 0.6512 *** 78.8% – 9.2% 51.2% Central part of the Chocó 1.0507 *** 84.7% – 6.9% 57.2% Northern part of the Chocó 3.1589 *** 97.9% – 0.2% 70.3% Nariño Pacific Coast (Ref.) – 1.6278 27.6% 5.6%
***: significant at the 0.001 level; n.s.: not significant. Source: 1993 census of Colombia.
22 O. BARBARY population used in the regressions comprises all the persons aged 18 and over in the sample, who are of black or mulatto phenotype and who an-swered the self-perception question. Of those 1,256 persons, 41.6% re-ported that they had a black skin, or 65.4% if the adjectives negra (black) and morena (dark brown) are aggregated. In Cali, the two adjectives have different semantic meanings, depending on the social context in which they are used(30). A useful starting point for identifying some of the factors behind “socio-racial assertion” is thus to analyse those answers that use the adjective negra/o, as opposed to the others(31).
Fou r ma in var iabl es help acc ou n t f o r t h e t ot al va r i a nc e o f t h e answers: phenotype, age, occupational category and migration status, while the others do not cross the significance threshold. The respondents’ place of residence seems not to be determinant once the effect of the phe-notype is taken into account; this indicates a link between the two varia-bles and points to the “racial specialization” of residential space in Cali mentioned earlier. The first noteworthy result is the absence of interviewer effect. The interviewer/respondent relationship does not have the impor-tance one might have feared, and which anthropologists who are critical of this kind of approach often assign to it.
This four-variable model performs well in predicting individual answers (74% correct) and for estimating the contingency table frequen-cies (standard deviation of residuals: 8%). The effect of the phenotype
pre-dominates by far: it accounts for between 5 and 30 times more of the
variance than the other characteristics. Persons with a black phenotype, all other things being equal, are about four times more likely than persons of a mulatto phenotype to describe their own skin colour as black. In this model, however, the hypothesis that variables are independent is rejected. As the sample is too small to model all the interactions, we use only the saturated models in which phenotype is crossed with three other variables (Table 3).
The results lead to conclusions that contrast with those reached about the assertion of ethnic affiliation in the Pacific region. In Cali, the only origin that favours self-reporting of black skin colour to any signifi-cant degree is the Pacific coast of the Cauca. Moreover, the signifisignifi-cant coefficient is not that corresponding to migrants born in the region but that of their descendants born in Cali (probability more than twice as high as the average). Contrary to what was expected given the massive proportion of respondents in the Chocó who reported membership in the black com-munity, in Cali those born in that departamento are no more likely than people of other origins to describe their skin colour as black, given the
(30) Those meanings are discussed in detail in the French version of this article
(Popula-tion, 56(5), 2001).
(31) To take the analysis further, it would be worth repeating the exercise with the “negra”
and “morena” answers combined so as to test the opposite hypothesis, namely that in certain con-texts, the two words are semantically equivalent.
MEASUREMENT AND PRACTICES OF SOCIAL AND RACIAL SEGMENTATION IN CALI 23
same phenotypes. On the other hand, the descendants of migrants from the country’s interior, whose origins were remote from the black demographic and cultural influences, report a black skin significantly less often (proba-bility reduced by more than one third relative to the average).
TABLE 3.– SIGNIFICANTMAINEFFECTSANDINTERACTIONSOFSELECTED CHARACTERISTICSONTHEPROBABILITYOFREPORTINGONE’SSKINCOLOUR
ASBLACKINTHESURVEY (LOGISTICREGRESSIONS)
Estimated parameter Signifi-cance Estimated response Observed response Phenotype and migration status, with interaction
Constant – 0.8776 *** 29% 42%
Phenotype
Black (+) 1.2675 *** 60% 57%
Migration status
Born in Cali, origin Cali (–) – 0.3292 *** 23% 29% Born in Cali, origin Pacific Cauca (+) 1.4795 *** 65% 73% Born in Cali, origin Int. Valle, Cauca,
Nariño (–) – 0.6902 ** 17% 19% Migrants from the rest of Colombia (–) – 0.4223 ** 21% 21%
Phenotype ×××× Migration status
Black, Pacific Nariño migrants (–) – 0.7215 *** 54% 54% Black, Born in Cali, origin Pacific Nariño (–) – 1.0291 *** 55% 55% Black, Pacific Valle migrants (–) – 0.6893 ** 57% 57%
Phenotype and socio-professional category, with interaction
Constant – 1.0808 *** 25% 42%
Phenotype
Black (+) 1.3982 *** 58% 57%
Socio-occupational category
Skilled industrial workers (+) 0.6552 * 40% 55% Unskilled workers, crafts, constr., transp. (+) 0.4748 * 35% 45%
Phenotype × Socio-occupational category
Black, secretaries, admin. staff (–) – 0.6806 ** 50% 50% Black, skilled crafts (–) – 0.6680 ** 48% 48% Black, unskilled crafts, constr., transp. (–) – 0.5690 ** 56% 56%
Phenotype and area of residence in Cali (interaction not significant)
Constant – 1.0087 *** 27% 42%
Phenotype
Black (+) 1.132 *** 53% 57%
Residence in Cali
East poorer neighbourhoods (+) 0.2342 * 32% 46%
Note: significant at the: ***0.01; **0.05; *0.10 level. Source: CIDSE/IRD survey, June 1998.
24 O. BARBARY In Cali, the socio-occupational category does not play the same determining role in the assertion of phenotype that it does for the assertion of black community affiliation in the Pacific region. Only skilled industrial workers are more likely to describe their skin colour as black (probability 1.8 times higher than among the non-working population). Last, the squat-ter settlements (invasiones) on the slopes of the wessquat-tern cordillera, where the population characterized as black is smallest (under 3%, as against an average of 15%), constitute the only residential area in Cali that possibly influences the answers: given the same phenotypes, the probability of self-reporting as having black skin is only half as high(32).
To summarize, to the extent that self-characterization of phenotypes is indicative of the construction of a black identity in Cali(33), its close link with the phenotypic characterization made by the interviewer sug-gests that this identity operates primarily with reference to the racial
cate-gories used by the population, to the divisions and boundaries these categories underpin, and to the stigma or, conversely, positive connotation that they convey in various contexts. Next come geographic origins, age,
and socio-occupational category, but the pattern of those determinations differs sharply from that of the neo-ethnic identity in the Pacific region. Unlike the influence over the latter of local social and political dynamics, whether as causes or consequences of Law 70, no single principle governs the process of construction of urban “black” identity. This appears to be both more complex and more endogenous. Rather than a form of transfer to the city of a hypothetical ethnic and territorial identity derived from the region of origin, we make the hypothesis that it reflects the experience of
citizens who are subject to various types of discrimination or at least aware of this risk, faced with unequal access to urban resources (housing, employment, education, health services, etc.).
Conclusion
The argument of this article can be summed up in a single sentence:
There exists a need in Colombia, particularly in the urban settings, for a phenotypic categorization of the population (based on external categori-zation and self-perception), and for a clarification of its use for analysing the socio-racial segregation and discrimination that affects the African Colombian population, of which a majority is now urban. The first results
of the survey show that the black and mulatto population in Cali is not homogeneous with respect to socio-demographic characteristics,
particu-(32) Verifying this would require testing the interactions between age, socio-occupational
category and place of origin; the limits imposed by the sample size are reached here.
(33) It must be admitted that this hypothesis has not been completely demonstrated. To
sup-port or qualify it would require methods that offer stricter control of the various contextual effects, which as we have seen exert a powerful influence on self-perception. Contextual or multi-level analyses are potentially valuable for this.