HAL Id: hal-02984123
https://hal.archives-ouvertes.fr/hal-02984123
Submitted on 30 Oct 2020
HAL is a multi-disciplinary open access
archive for the deposit and dissemination of
sci-entific research documents, whether they are
pub-lished or not. The documents may come from
teaching and research institutions in France or
abroad, or from public or private research centers.
L’archive ouverte pluridisciplinaire HAL, est
destinée au dépôt et à la diffusion de documents
scientifiques de niveau recherche, publiés ou non,
émanant des établissements d’enseignement et de
recherche français ou étrangers, des laboratoires
publics ou privés.
based on population monitoring
Perrine Gauthier, Virginie Pons, Alessandro Fisogni, Valentina Murru, Regina
Berjano, Simone Dessena, Alfredo Maccioni, Chiara Chelo, Natasha de
Manincor, Antoine Doncieux, et al.
To cite this version:
Perrine Gauthier, Virginie Pons, Alessandro Fisogni, Valentina Murru, Regina Berjano, et al..
Assess-ing vulnerability of listed Mediterranean plants based on population monitorAssess-ing. Journal for Nature
Conservation, Elsevier, 2019, �10.1016/j.jnc.2019.125758�. �hal-02984123�
UNCORRECTED
PROOF
Contents lists available at ScienceDirectJournal for Nature Conservation
journal homepage: http://ees.elsevier.com
Assessing vulnerability of listed Mediterranean plants based on population monitoring
Perrine Gauthier
a,⁎, Virginie Pons
a, Alessandro Fisogni
a, Valentina Murru
a, Regina Berjano
a,
Simone Dessena
a, Alfredo Maccioni
a, Chiara Chelo
a, Natasha de Manincor
a, Antoine Doncieux
a,
Guillaume Papuga
a,b, John D. Thompson
aaCEFE UMR 5175, CNRS, 1919, Route de Mende, 34293 Montpellier Cedex 5, France
bConservatoire Botanique National Méditerranéen de Porquerolles, Antenne Languedoc-Roussillon, Parc scientifique Agropolis - B7, 2214, Boulevard de la Lironde, 34980 Montferrier-sur-Lez,
France
A R T I C L E I N F O
Keywords
Disturbance
Plant population dynamics Rarity
Annual versus perennial Rainfall variation
A B S T R A C T
Understanding the population dynamics of rare and endangered plant species is essential to elaborate correct management plans for their conservation. Demographic monitoring of individual species provides valuable infor-mation here. However, demographic studies are limited to species for which one can follow individuals through their life history. They are also time consuming, making it difficult to make simultaneous studies of several species with different populations in order to have a more general assessment of rare species dynamics in a given region. In this paper, we illustrate how the use of an approach based on transition frequencies allows for the si-multaneous study and comparison of trends in 32 populations of six species with very different life histories and growth forms in the Mediterranean region of the South of France. The results show significant effects of spring rainfall deficit on annual population dynamics but not for perennial species that show a delayed response, and illustrate population declines due to direct human impacts on populations in the study region. Our study illus-trates the alarming overall vulnerability of populations and is simple and rapid to apply in a multi-population and multi-species context. It could thus be used by conservation management staff to construct assessments of population vulnerability elsewhere.
1. Introduction
Many plant species show a decline in population numbers as a re-sult of habitat destruction and a decline in population viability due to habitat modification. There has thus been great interest in the monitor-ing of rare and endangered species in order to assess their status and assure their protection. There are three main approaches to monitoring that can be undertaken at different scales, each with their own particu-lar objective (Bonnet et al., 2015; Elzinga, Salzer, & Willoughby, 1998; Palmer, 1987). First, inventories of species presence show where species are present and absent in a given territory or region and thus provide information on rarity and overall threats. Second, surveys of population characteristics allow us to have basic information on num-bers of plants, flowers, sometimes seed set and also human impacts on populations and habitats. Third, detailed demographic monitoring provides information on the fates of individual plants and populations. These approaches differ markedly in their technical requirements and the time spent in the field in order to obtain informative data.
A demographic approach requires that individuals be followed through their life cycle. This allows for the estimation of population growth rates and the identification of life-cycle stages that impinge on population trends, i.e. key elements for conservation management (Schemske et al., 1994). Many studies have thus illustrated the per-tinence of a demographic approach for our understanding of the popu-lation viability of rare and endangered plant popupopu-lations (Andrieu et al., 2017; Fréville et al., 2004; García, 2003; Jacquemyn, Brys, Hermy, & Willems, 2007; Lehtilä, Syrjänen, Leimu, Begoña Gar-cia, & Ehrlén, 2006; McCauley & Ungar, 2002; Nicolè, Brzosko, & Till-Bottraud, 2005; Schleuning & Matthies, 2008). However, it is often not possible to identify and follow individual plants due to: (i) high patch density that precludes the identification of individuals and their monitoring, (ii) the fact that plants are not visible above ground during most or part of the year, (iii) clonality and the impossibility of distinguishing genetic individuals, and (iv) problems of seedling identi-fication at high density and when closely related species co-occur. For these reasons, and the time consuming nature of demographic monitor-ing, for many rare and endangered species for which management staff
⁎Corresponding author.
E-mail address: [email protected] (P. Gauthier) https://doi.org/10.1016/j.jnc.2019.125758
Received 26 March 2019; Received in revised form 23 August 2019; Accepted 25 October 2019 Available online xxx
UNCORRECTED
PROOF
require information on their conservation status, a purely demographicapproach is not possible.
In the face of these constraints, the use of frequency data based on presence / absence observations and/or classes of abundance for the yearly monitoring of plant populations provides an interesting al-ternative to obtain pertinent information to assess population trends (Berjano et al., 2013; Elzinga et al., 1998; Gauthier, Pons, Le-tourneau, Papuga, & Thompson, 2017; Joseph, Field, Wilcox, & Possingham, 2006). These authors illustrate how analyses of popu-lation transitions based on changes in frequency offer several advan-tages. First, frequency analyses can be applied concomitantly to com-pare species with different growth forms and life histories, even for clonal plants. Second, observations of presence / absence and classes of abundance in a large number of permanently marked plots can be rapidly accomplished in the field where the only decision required by the observer is to note presence / absence or a class of density. Third, such methods can be applied at different spatial scales to provide in-formation on changes in both spatial occupation and local abundance within patches and thus identify trends at population and/or patch scale. Finally, with frequency analyses, the impact of extreme meteorological events or human-induced disturbance on population transitions can be statistically identified.
Marked variability in meteorological events is typical of Mediter-ranean Type Ecosystems. Here, the regular summer drought is accom-panied by important irregularity in the amounts and timing of rain-fall from autumn to spring. This variation in the timing and amounts of spring rainfall can cause irregular fluctuations in abundance, par-ticularly for annual plants (Figueroa & Davy, 1991; Fox, 1995; Fox, Steele, Holl, & Fusari, 2006; Levine, McEachern, & Cowan, 2008). As these authors illustrate, annual species often germinate and grow in response to favourable water balance either in the autumn or spring while perennial species respond more to an overall yearly rainfall and temperature regime. In this respect, annual plant species can show marked variation across years with different spring rainfall regimes, whilst perennial species may show less variation in numbers, and thus may not achieve maximum numbers in highly favourable years. Theoretical models predict that fluctuations in rare annual species can positively affect their long-term persistence by reducing
competition with dominant perennial species in what are unfavourable years for above ground development (Levine & Rees, 2004). To our knowledge there have however been no long-term multiple comparisons of rare annual and perennial species to assess such variation and its im-plications for conservation management.
The objective of this paper is to quantify variation in population trends for rare and endangered species in Mediterranean France where populations are subject to high levels of variation in the occurrence of spring rainfall and where land-development currently impacts many populations. We show how the use of a common method to analyse tran-sitions in occupation and abundance allows us to compile information from several populations and species to provide a general assessment of population trends and vulnerability in a range of species and in a way that is useful for conservation management.
2. Material and methods
2.1. Data collection
We apply a method based on observations of presence / absence and classes of abundance in permanently marked grids at the scale of lo-cal populations and within patches to study transitions in occupation and abundance over eight to nine years in 32 plant populations of six species with contrasting life-history strategies (Table 1). All six species are listed for protection in France (under decrees of 01/20/1982 and 08/31/1995). In the study region these species all occur at the north-ern limits of their Mediterranean distribution and are all rare but to dif-ferent degrees. A large proportion of their populations (Fig. 1) occur in areas that have undergone rapid urbanisation and land-development for infrastructures and commercial enterprises in the last 50 years and the indirect factors that may influence population vulnerability are as-sessed in a separate paper (Gauthier, Bernard, & Thompson, 2019). The populations were chosen to represent a gradient of situations from populations where direct impacts were foreseeable during the nine years of our study (some were known to have part of their populations in a development programme) to secluded and low-risk zones. In each popu-lation we collected data on two spatial scales.
First, population occupation was estimated on permanent grids (marked at soil level with metal tickets and paint marks on rocks) laid
Table 1
For the six study species: Years of monitoring, number of populations, biological and habitat characteristics, and inscription to National (N) or Regional (R) conservation lists in France. Species Monitoring years Life history Peakflowering Number ofpopulations Broad habitat ConservationList
2009 2010 2011 2012 2013 2014 2015 2016 2017 Stipellula capensis (Thunb.) Röser & Hamasha
x x x x x x x x x Annual May 8 Thermophilous
grassland, garrigues
R
Ononis
mitissima L. x x x x x x x x Annual June 6 Garrigues,pastures, old
fields
R Convolvulus
lineatus L. x x x x x x Clonalperennial June 5 Garrigues,rocky pastures,
old fields R Helianthemum marifolium Mill. x x x x x x Woody
perennial June 6 Garrigues, pathedges N Allium
chamaemoly L.
x x x x x x x x Geophyte January 4 Garrigues,
rocky pastures N Astragalus
glaux L. x x x x x x x x Herbaceousperennial May 3 Garrigues,rocky pastures, old fields
UNCORRECTED
PROOF
Fig. 1. The location of the 32 monitored populations in Mediterranean France: Stipellula capensis (black squares), Ononis mitissima (white squares), Convolvulus lineatus (white cir-cles), Allium chamaemoly (black circir-cles), Helianthemum marifolium (white triangles) and As-tragalus glaux (black triangles).
out across a representative part of the population (i.e. a major patch of the population) where presence / absence of the species was noted across the whole area for perennial plants or in transects that covered areas where the species was both present or absent for annual plants. All grid cells were 0.25m2. The spatial extent of the whole grid depended
on the spatial extent of the population. This estimation of occupation at the population level was conducted annually for the annual species and at three occasions in perennial populations, i.e. in the first year of the study (2009 or 2010), again in 2013 or 2014 (the first part of the study) and in the final year (2017: the second part of the study). The number of grid cells (in each population) in which we quantified presence / ab-sence at this scale is shown in Table 2. In setting out the grid, the objec-tive was to have a large numbers of cells in which the species is present and also absent within the zone of occupation.
Second, we quantified abundance in quadrats in which the species were present at a scale adapted to the biology of each species. The size and number of individual quadrats for annual estimates of changes in abundance differed among species and populations because of differ-ences in population spatial extent and patchiness of populations and in-dividual plants that sometimes induced constraints on access to quadrats (to avoid damage to the population). Although quadrats differed in size and number they consistently produced the same type of data. For perennial species, changes in abundance were estimated using pres-ence / abspres-ence data within six to 16 quadrats (1m² or 0.25m²) divided into 100 cells (of 10×10cm or 5×5cm) in which presence / absence was quantified annually (Table 2) at the time of peak flowering. The quadrats were placed in a stratified random sample in order to encom-pass the range of local density observed in each population. There were thus quadrats at low density, intermediate density and high density for each population of each species.
For annual species we adopted a different approach because we could not place a grid to quantify presence / absence for many small
Table 2
Population locations for the six studied species and surface areas used to study population occupation and abundance in quadrats: longitude (LO), latitude (LA), area mapped (AM), number of 0.25 m²grid cells used to assess spatial occupation across the population (NO) and number of quadrats used to estimate abundance (NA).
Populaiton GPS coordinates AM (m²) NO NA LO LA Stipella capensis 1 4.80244 43.59179 56 224 224 2 4.88583 43.48026 56 224 224 3 5.02908 43.37705 56 224 224 4 5.02996 43.37622 56 224 224 5 5.02863 43.36522 56 224 224 6 5.0165 43.36353 56 224 224 7 5.04693 43.34162 56 224 224 8 5.06527 43.33712 56 224 224 Ononis mitissima 1 5.02164 43.36333 64 256 256 2 5.02459 43.37423 58 232 232 3 4.96961 43.43553 25 100 100 4 4.9888 43.42948 56 224 224 5 4.99048 43.42989 56 224 224 6 3.80534 43.46237 80 320 320 Convolvulus lineatus 1 5.00456 43.44158 215 860 6 (0.25) 2 4.86594 43.45459 180 720 6 (0.25) 3 4.88583 43.48026 145 580 6 (0.25) 4 3.6504 43.39775 330 1320 6 (0.25) 5 3.05139 43.08993 280 1120 6 (0.25) Helianthemum marifolium 1 5.02245 43.36537 104 416 12 (1) 2 5.00116 43.44993 116 464 13 (1) 3 5.05113 43.44942 142.5 570 12 (1) 4 4.96365 43.44839 79.25 317 12 (1) 5 4.96326 43.44699 109.75 439 12 (1) 6 4.95317 43.46648 165.25 661 13 (1) Allium chamaemoly 1 3.82068 43.56105 217.5 870 14 (1) 2 3.85524 43.55924 208.5 834 12 (1) 3 3.55718 43.43622 208.5 834 14 (1) 4 3.38753 43.51483 180.25 721 14 (1) Astragalus glaux 1 4.14572 43.70132 34 136 16 (1) 2 4.15323 43.70623 144 576 8 (1) 3 2.90211 42.87829 130 520 14 (1)
plots without causing major damage to the plants. We thus quantified abundance (in the same quadrats used for presence /absence) based on classes that can also be analysed by frequency analyses. As S. capensis can have extremely high individual plant densities with >1000 indi-viduals per m², changes in abundance were assessed with four classes (class 1: 1–20 plants, class 2: 21–125 plants, class 3: 126–500 plants and class 4: >500 plants) using all the cells of 0.25 m² in which the species was present in a given year. For O. mitissima abundance was quanti-fied as the number of individual plants counted annually in each cell of 0.25m² where the species was present. Again, four classes were con-structed (class 1: 1 plant, class 2: 2–3 plants, class 3: 4–8 plants, class 4: >8 plants). The maximum number of plants in a grid cell was 29 in population 2 in 2011.
Direct impacts and alterations in population habitats were assessed in the 32 monitored populations each year at the time of monitor-ing (January / February for A. chamaemoly, April - June for the other species). Some of these impacts were considered as “expected” because
UNCORRECTED
PROOF
they were planned to occur in development and industrial projects forwhich we had knowledge. Other impacts occurred in populations that were “not expected” to experience disturbance. Each year we assessed the spatial extent and the number of quadrats impacted by disturbance in each population.
To test for a relationship between changes in population occupation and spring rainfall we collected data for the study period and calculated a mean spring rainfall value for the 28year period from 1990 to 2017 from the national weather data-base for the weather station at Marig-nane in the study area (http://publitheque.meteo.fr).
2.2. Data analysis
To analyse population changes, we performed McNemar (1947) chi-squared tests with an excel spread sheet. This method is adapted to binomial frequency data that are in matched (i.e. non-independent - the same quadrats are monitored each year) pairs in a 2×2 contingency table and assesses the heterogeneity of row and column marginal fre-quencies using data on transition rates based on the number of gains and losses of presence in grid cells in two successive samples. Because we studied permanent quadrats, data from one year to another are not in-dependent. To overcome this lack of independence we were constrained to using and comparing only data that involve a gain or loss in presence, hence grid cells that show stability (i.e. either presence or absence on two successive dates) are not used in the analysis, as recommended by McNemar (1947).
We used McNemar (1947) chi-squared tests to test (1) for changes in overall population grid occupation each year in annual species and in each part of the study and across the entire study for perennial plants and (2) for changes in abundance within quadrats between each pair of successive years over the entire study in all species except C. lineatus and
H. marifolium for whom this was done only in the first part of the study.
For perennial species this was based on presence / absence data in small plots in each quadrat, and for annual species, we tested for abundance variation based on the number of abundance classes that increased or decreased in two successive years. Transitions to or from a class of zero were not taken into account because they contribute to variation in oc-cupation. If a population was totally destroyed it was removed from the analysis. Based on these analyses we determined for each transition the proportion of declining, stable or growing populations.
3. Results
Three of the 32 populations went extinct in the nine years of this study. Table 3 and Supplementary Table 1 provide the data on signifi-cant variation in occupation and abundance in the two parts of the study and across the entire study period.
3.1. Stipellula capensis (Fig. 2)
There was no global trend in inter-annual variation in spatial oc-cupation for the eight studied populations. Populations 4 and 8 were relatively stable across the overall study period with several significant year-to-year transitions in gains or losses but no trend across all years. Populations 3, 6 and 7 showed an overall decline in occupation and pop-ulations 1, 2 and 5 showed important year to year variations but no overall trend. In 2011, 2012 and 2014 a significant decrease in occupa-tion was observed in all populaoccupa-tions except populaoccupa-tion 3 in 2011, pop-ulations 2 and 8 in 2012, and poppop-ulations 3 and 4 in 2014. 2013 and 2015 were globally favourable years. The other years of study showed much annual variability with no general trend. The comparison of occu-pation in 2009 and 2017 shows that five populations decreased (3, 5, 6, 7, 8) two remained stable (2 and 4) and one increased (1).
A significant decline in abundance was observed in seven popula-tions in 2010, six populapopula-tions in 2011 and six populapopula-tions in 2016, while a significant increase in abundance was observed in five populations in 2013 and 2015. Populations 3 and 6 never showed a significant increase in abundance during the study.
3.2. Ononis mitissima (Fig. 3)
In O. mitissima, populations 2, 3, 4 and 6 showed significant year-to-year variation with a significant overall decline. In these four populations, a significant increase in occupation was observed in 2013 and in 2017. For the remaining two populations, population 1 went ex-tinct in 2014 and population 5 declined to a single plant in 2016.
We only observed five significant changes in abundance among the 36 analysed year-to-year combinations primarily the result of the loss of high density in most populations and increased abundance in some years and populations.
3.3. Convolvulus lineatus (Fig. 4)
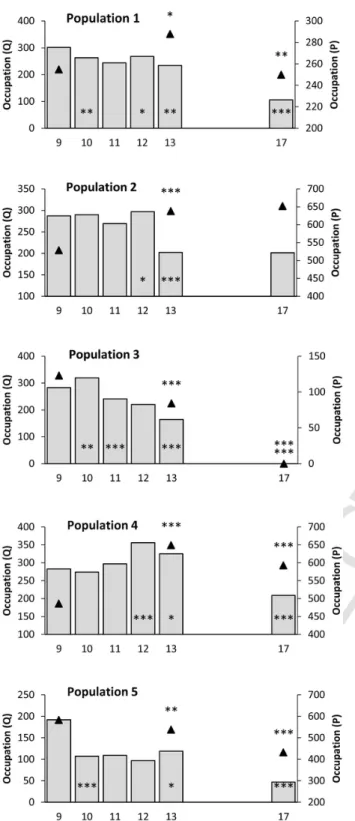
Three types of variation in population occupation were observed. First, populations 3 and 5, showed a significant gradual decrease in oc-cupation over the study period. Visits to population 3 in 2015, 2016, and 2017 revealed that this population went extinct in 2015. Second, populations 1 and 4 showed a significant increase in occupation in the first part of the study and a significant decrease in the second part of the study. The pattern was different in these two populations because of a very small decline in population 4, which significantly increased over the whole study. Third, population 2 showed a significant increase in the first part of the study followed by a non-significant increase in the second part of the study, hence a significant increase in occupation over the study period.
The populations showed contrasting patterns of annual variation in abundance during the five first years of annual monitoring albeit with a repeated significant increase in abundance in 2012 (populations 1, 2 and 4) and a subsequent decline in abundance in most populations in 2013. A further decline in abundance was observed in the second part of the study (except population 2). All populations showed a decrease in abundance through the whole study period.
3.4. Helianthemum marifolium (Fig. 5)
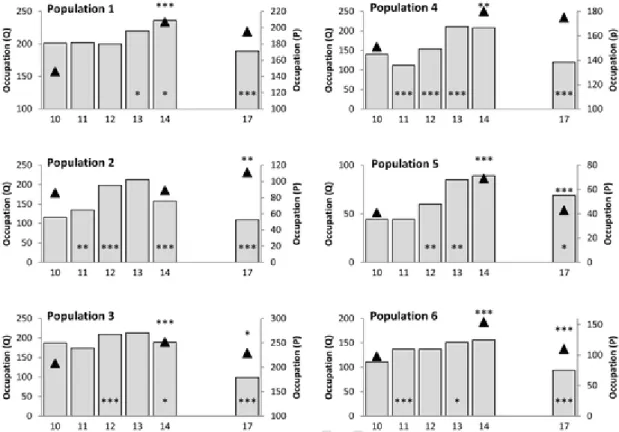
In the first part of the study, five populations (1, 3, 4, 5 and 6) showed a significant increase in occupation while in population 2 the increase was non-significant. Populations 3, 5 and 6 showed a signifi-cant decline in occupation in the second part of the study, hence they remained stable over the overall study period and population 2 showed a significant increase in occupation. As a result no populations showed a significant decline.
Although all populations showed significant or non-significant in-creases in abundance during the first part of this study, all populations decreased in abundance in the second part of the study. As a result over the overall study period, abundance was stable in populations 1, 2, 4 and 6, population 5 had a significant increase and population 3 a signif-icant decrease.
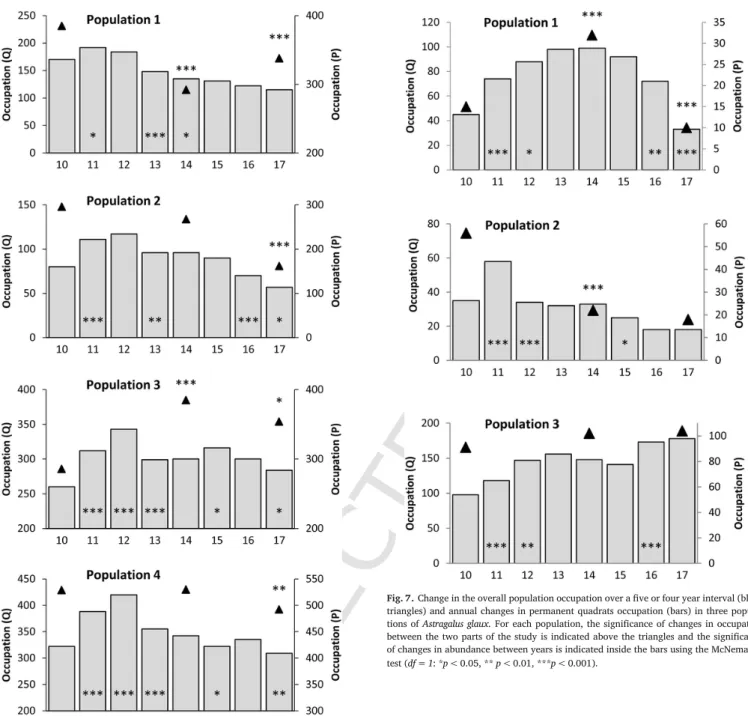
3.5. Allium chamaemoly (Fig. 6)
Overall occupation showed very different significant changes over the study period in the different populations. Three populations (2, 3 and 4) showed a significant decline in occupation during the second half of the study.
In contrast, populations showed several common significant year-to-year changes in abundance, with a generally significant increase in
UNCORRECTED
PROOF
Table 3
Values of McNemar Chi-squared tests for transitions in occupation and abundance in part 1 (i.e. between 2009 and 2013 or 2010 and 2014), part 2 (i.e. between 2013 and 2017 or 2014 and 2017) and the entire study (2009 and 2017 or 2010 and 2017). Left column contains population code numbers. An upward arrow is a significant positive transition and a downward arrow is a significant negative transition.
Population Occupation Abundance
Part 1 Part 2 Entire study Part 1 Part2 Entire study
Stipella capensis 1 31.1 *** ↑ 2.9 ns 39.4 *** ↑ 8.0 ** ↓ 5.4 * ↓ 48.3 *** ↓ 2 9.3 ** ↓ 20.0 *** ↑ 2.0 ns 3.8 ns 26.7 *** ↑ 6.4 * ↑ 3 54.1 *** ↓ 0.2 ns 45.8 *** ↓ 9.1 ** ↓ 0.0 ns 10.1 *** ↓ 4 0.5 ns 7.6 ** ↓ 3.4 ns 54.2 *** ↓ 8.2 ** ↓ 26.4 *** ↓ 5 31.6 *** ↓ 0.1 ns 24.5 *** ↓ 46.2 *** ↓ 1.0 ns 47.4 *** ↓ 6 37.0 *** ↓ 119.0 *** ↓ 158.0 *** ↓ 118.0 *** ↓ 0.0 ns E 0.0 ns E 7 7.8 ** ↓ 57.1 *** ↓ 82.1 *** ↓ 62.0 *** ↓ 6.1 * ↓ 28.0 *** ↓ 8 1.6 ns 31.2 *** ↓ 22.3 *** ↓ 90.1 *** ↓ 4.0 * ↓ 95.0 *** ↓ Ononis mitissima 1 15.1 *** ↓ 0.0 ns 15.1 *** ↓ 0.0 ns E 0.0 ns E 0.0 ns E 2 163.4 *** ↓ 88.3 *** ↑ 48.7 *** ↓ 0.8 ns 7.1 ** ↑ 1.7 ns 3 6.6 * ↓ 1.6 ns 14.2 *** ↓ 4.8 * ↓ 1.1 ns 3.5 ns 4 81.6 *** ↓ 3.9 * ↑ 57.6 *** ↓ 0.5 ns 0.0 ns 0.5 ns 5 78.7 *** ↓ 27.7 *** ↓ 130.1 *** ↓ 2.5 ns 0.0 ns 0.0 ns 6 147.8 *** ↓ 60.9 *** ↑ 37.8 *** ↓ 7.8 ** ↓ 2.1 ns 9.4 ** ↓ Convolvulus lineatus 1 6.1 * ↑ 8.8 ** ↓ 0.1 ns 22.5 *** ↓ 72.0 *** ↓ 133.0 *** ↓ 2 80.4 *** ↑ 2.4 ns 72.6 *** ↑ 34.1 *** ↓ 0.0 ns 26.0 *** ↓ 3 22.2 *** ↓ 82.0 *** ↓ 121.0 *** ↓ 55.9 *** ↓ 162.0 *** ↓ 281.0 *** E 4 115.6 *** ↑ 11.3 *** ↓ 32.6 *** ↑ 6.8 ** ↑ 35.0 *** ↓ 52.0 *** ↓ 5 9.3 ** ↓ 54.0 *** ↓ 78.9 *** ↓ 26.1 *** ↓ 45.0 *** ↓ 99.0 *** ↓ Helianthemum marifolium 1 49.3 *** ↑ 2.1 ns 23.8 *** ↑ 6.5 * ↑ 19.8 *** ↓ 2.9 ns 2 0.1 ns 6.9 ** ↑ 7.1 ** ↑ 11.8 *** ↑ 18.1 *** ↓ 0.2 ns 3 18.5 *** ↑ 4.1 * ↓ 3.5 ns 0.0 ns 38.8 *** ↓ 31.0 *** ↓ 4 9.2 ** ↑ 0.3 ns 6.0 * ↑ 22.2 *** ↑ 36.7 *** ↓ 1.7 ns 5 18.2 *** ↑ 12.0 *** ↓ 0.0 ns 27.3 *** ↑ 5.6 * ↓ 5.5 * ↑ 6 35.2 *** ↑ 18.5 *** ↓ 1.3 ns 16.3 *** ↑ 30.8 *** ↓ 3.8 ns Allium chamaemoly 1 35.7 *** ↓ 12.2 *** ↑ 7.9 ** ↓ 7.9 ** ↓ 4.9 * ↓ 17.1 *** ↓ 2 3.8 ns 52.0 *** ↓ 63.6 *** ↓ 2.7 ns 25.3 *** ↓ 5.6 * ↓ 3 50.3 *** ↑ 5.5 * ↓ 21.0 *** ↑ 9.8 ** ↑ 2.1 ns 2.6 ns 4 0.0 ns 8.7 ** ↓ 6.6 * ↓ 1.6 ns 9.2 ** ↓ 0.6 ns Astragalus glaux 1 12.2 *** ↑ 20.0 *** ↓ 2.3 ns 35.1 *** ↑ 52.8 *** ↓ 1.8 ns 2 22.7 *** ↓ 0.8 ns 27.4 *** ↓ 0.0 ns 5.9 * ↓ 5.2 * ↓ 3 1.3 ns 0.0 ns 1.5 ns 13.1 *** ↑ 14.0 *** ↑ 40.3 *** ↑ (df=1: *p<0.05, **p<0.01, ***p<0.001).
2011 followed by decreases in abundance in most populations in 2013 and 2017. In the second part of the study, three populations decreased in abundance (1, 2 and 4) and the last population (3) remained stable. For the entire study, populations 1 and 2 showed a significant decrease while the other two populations were stable.
3.6. Astragalus glaux (Fig. 7)
The three studied populations showed contrasting patterns of overall occupation. Population 1 increased significantly in the first part of the study then decreased significantly with thus an overall stability, popu-lation 2 decreased significantly then remained stable and popupopu-lation 3 remained stable during the eight-year monitoring period.
After a generally significant increase in 2011, no general pattern of change was observed for abundance. Abundance in population 1 os-cillated during the eight years of monitoring but remained unchanged over the whole study period. In population 2, abundance significantly
decreased after 2011 and again in 2015 and as a result declined signifi-cantly across the whole study. In population 3, abundance increased sig-nificantly in three years of the study, and was thus sigsig-nificantly higher at the end of the study.
3.7. Comparative trends
The three populations that disappeared in our study involved one population of the perennial C. lineatus, one population of S. capensis and one population of O. mitissima. None reappeared at the end of the study so it would appear that they are extinct. A further visit in several years may be necessary to confirm this.
In the first part of the study, almost 50% of populations (15 out of 32) showed a significant decrease in overall occupation (Fig. 8). Whereas 11 of the 14 annual species populations declined, 10 out of 18 perennial species populations showed an increase. In the second part of the study, 50% of the 32 studied populations showed a significant de
UNCORRECTED
PROOF
Fig. 2. Change in overall population occupation and abundance during nine years of monitoring in eight populations of Stipellula capensis. Abundance (number of plants per 0,25m²) was estimated in four classes: (1) 1–20 plants (white), (2) 20–125 plants (light grey), (3) 125–500 plants (dark grey), (4) >500 plants (black). For each population the significance of changes in occupation and abundance using the McNemar χ² test (df=1: *p<0.05, ** p<0.01, ***p<0.001) between years is indicated above the bars for occupation and inside the bars for abundance (or when the bars are too small under the axis). “E” represents an extinct population.
crease in overall occupation, due to a decline in 11 of the 18 popula-tions of perennial species. Over the whole study, a decline in overall oc-cupation was primarily associated with a decline in ococ-cupation for an-nual species (11 of their 14 populations). However given their anan-nual fluctuations this result (based on a comparison of the first and last year) should be interpreted with caution.
Abundance within quadrats declined during the first part of the study due to decline in nine of the 13 populations of the annual species pri-marily in 2011 and 2012 (Fig. 8). During the second part of the study, a marked decline in abundance in quadrats was observed for populations of perennial plants (15 out of 18 populations). During the overall study period of this study, 64% of the populations of the two annual species (7 out of 11 populations) and 50% of the populations of the four perennial species showed a significant decrease in quadrat abundance.
Multiple significant transitions (declines) in occupation and abun-dance of the two annual species in these years are correlated with a deficit of spring rainfall; 2011 and 2012 are the only spring periods when rainfall was well below the mean for the last 28year period (Fig.
9). While perennial species show no trends in occupation and abundance related to rainfall deficit in these years, the two annual species show a large number of significant negative transitions in occupation and abun-dance in these years (compare Table 3 & Fig. 9).
In 2011, seven of the eight S. capensis populations showed a signif-icant decline in occupation and six of the eight populations showed a significant decline in abundance. In 2012, for seven of the eight popula-tions there was either no subsequent increase or a significant decline in occupation and in abundance. In association with increased rainfall in 2013, five populations showed a significant increase in occupation and five populations a significant increase in abundance. With the decline in rainfall in 2014, six populations showed a significant decline in oc-cupation and five populations showed a decline in abundance. With in-creased rainfall in 2017, three populations showed a significant increase in occupation and three a significant increase in abundance.
Four of the O. mitissima populations showed a significant decline in occupation and one population for abundance in 2011. In 2012 four populations showed a significant decline in occupation, one population remained stable after a major decline in 2011 and occupation increased
UNCORRECTED
PROOF
Fig. 3. Change in overall population occupation and abundance during eight years of monitoring in six populations of Ononis mitissima. Abundance (number of plants per 0,25m²) was estimated in four classes: (1) 1 plant (white), (2) 2–3 plants (light grey), (3) 4–8 plants (dark grey), (4) >8 plants (black). For each population, the significance of changes in occupation and abundance using the McNemar χ² test (df=1: *p<0.05, ** p<0.01, ***p<0.001) between years is indicated above the bars for occupation and inside the bars for abundance (or when the bars are too small under the axis). “E” represents an extinct population.
in one population. With the increased spring rainfall in 2013, five of the six populations showed a significant positive transition in occupation, and one of these showed an increase in abundance. Four populations showed significant declines from 2013 to 2014 that are not related to changes in rainfall. From 2016 to 2017, four of the five remaining pop-ulations showed a significant increase in occupation that is correlated with an increase in rainfall from a previously dry spring.
Eight populations were subject to “expected” impacts prior to or dur-ing the first two years of the study. As a result, population 3 of S.
capen-sis, population 1 of O. mitissima and population 3 of C. lineatus showed
a significant decrease in both occupation and abundance, and the two latter populations disappeared. In contrast, population 2 of S. capensis, and populations 4 and 6 of H. marifolium recolonized after the impact.
A total of 13 other populations incurred some form of partial de-struction (i.e. in some quadrats) due to human activities (including graz-ing), wild boar or competition with other species. For S. capensis, popu-lations 5 and 6 (not within the perimeters of known development pro-jects) incurred either total or partial destruction, with a significant de-cline in both occupation and abundance. Population 1 was grazed oc-casionally at flowering time and showed a decline in abundance (Fig. 2). Population 6 of O. mitissima was impacted by grazing and showed a significant decline in occupation and abundance (Fig. 3). Populations 2 and 5 of C. lineatus were partially impacted by wild boars with signif-icant declines in abundance for the first one and both occupation and abundance for the second one (Fig. 4). Populations 3 and 4 of H.
mari-folium were partially impacted by woody plant clearance with a decline
in abundance (Fig. 5). Vegetation succession as a result of human ac-tivity occurred in ten populations (populations 2 and 3 in S. capensis,
populations 1 and 4 of O. mitissima, population 2 in H. marifolium, popu-lations 1, 2 and 4 of A. chamaemoly and popupopu-lations 1 and 3 of A. glaux). As a result, only 11 of the 32 populations showed no signs of any im-pact.
4. Discussion
4.1. Irregularity of rainfall and population transitions
Studies of annual plants in desert and Mediterranean type ecosys-tems have shown marked variability among species in response to an-nual fluctuations in rainfall that have important consequences for the long-term persistence of rare annual plants (Angert, Huxman, Bar-ron-Gafford, Gerst, & Venable, 2007; Figueroa & Davy, 1991; Fox, 1995; Fox et al., 2006; Gutierrez & Meserve, 2003; Levine et al., 2008; Venable, Pake, & Caprio, 1993).
Levine et al. (2008) illustrate how rare annual species in the Cali-fornian Mediterranean Type Ecosystem display large between-year vari-ation in plant density in relvari-ation to rainfall and discuss the importance of two other associated factors. First, germination cueing can be of funda-mental importance to annual fluctuations in population dynamics. Sec-ond, annual variation in rainfall may benefit the persistence of rare an-nual plants by causing reduced competition from species that do not respond to unfavourable conditions (Levine & Rees, 2004). Their re-sponse to environmental variability gives rare annual species the op-portunity to avoid unfavourable years that gradually impact perennial species while the annual species remain dormant in the seed bank. Hence, in subsequent more favourable years annual species may benefit from reduced competition and higher abundance. That reduced abun-dance in drought years may be essential for rare annual species persis
UNCORRECTED
PROOF
Fig. 4. Change in the overall population occupation over a four to five year interval (black triangles) and changes in permanent quadrat occupation (bars), i.e. local abundance, over five consecutive years and in a latter year (2017) in five populations of Convolvulus linea-tus. For each population, the significance of changes in occupation between the two parts of the study is indicated above the triangles and the significance of changes in abundance between years is indicated inside the bars using the McNemar χ² test (df=1: *p<0.05, ** p<0.01, ***p<0.001).
tence represents an idea that has not been fully appreciated in manage-ment plans.
The two annual species we studied here, O. mitissima and S.
capen-sis, both showed significant declines in spatial occupation and
abun-dance in association with extremely low spring rainfall below the mean
for the last 28-year period. Both species showed a capacity to respond to rainfall by enhanced germination and flowering in a high rainfall year after one or two years of rainfall deficit, indicative of a persistent seed bank in the soil that responds to rainfall-linked germination cues. This drought-avoidance strategy in annual plants enables them to track ma-jor changes in their germination environment and illustrates the impor-tance of maintaining a persistent seed bank through unfavourable years in a Mediterranean Type Ecosystem (Fox et al., 2006). In other an-nual plant populations in the Mediterranean, rainfall variability is sig-nificantly correlated with emergence (Baumel et al., 2009; Villellas, Berjano, Terrab, & García, 2014). In Plantago coronopus L. popula-tions of annual plants have higher seedling emergence and survival than perennial populations (that have to survive the summer drought to be-come adults) in high-rainfall years and dramatically reduced emergence in dry years thus spreading recruitment over time in an annually vari-able precipitation regime (Braza & García, 2011; Villellas et al., 2014).
Declines in population occupation and quadrat abundance of annual species were mostly observed in the first part of the study whereas pop-ulations of perennial species did not show a decline in the first part of our study and no significant annual fluctuation in relation to spring rain-fall deficits in 2011 and 2012, remaining stable across the driest years of our study. This difference between annual and perennial species was re-versed in the second part of this study, when declines in population oc-cupation and local abundance were observed in populations of perennial but not annual species (other than a decline in the dry year of 2016). This clear temporal separation between declines in annual and perennial species’ populations may positively affect the long-term presence of an-nual species. The typical strategy of endemic, perennial Mediterranean plants in dry, rocky habitats such as those studied here, is indeed, af-ter an initial bottleneck of high seedling mortality in their first summer, one of persistence and adult longevity (Thompson, 2005). It appears from our work that perennial species may however show a decline on a longer-term basis as a result of two consecutive previous years of se-vere drought stress. Hence, although our study species do not co-occur in the same sites (other than in one site), the pattern of annual variation in annual species’ populations followed by a longer term but later de-cline in perennial species populations’ fits the models described above for a drought-avoidance strategy in annuals relative to a drought-toler-ance strategy of perennial species. In annual plants it is important to avoid and not buffer unfavourable years, and critical to maximise fitness in favourable years.
4.2. Population disturbance and conservation
Land use change and modifications of human practices are a major threat to rare species populations in the Mediterranean region (Amat, Vargas, & Gómez, 2013; Andrieu, Thompson, & Debussche, 2007; Domínguez Lozano, Moreno Saiz, & Sainz Ollero, 2003; Gauthier et al., 2017; Hardion et al., 2015; Minuto, Casazza, & Profumo, 2004; Pouget, Baumel, Diadema, & Médail, 2016; Salanon, Gandi-oli, Kulesza, & Pintaud, 1994). Initially, eight populations were “ex-pected” to have some form of impact and indeed one population of each of S. capensis, O. mitissima and C. lineatus showed a significant decrease in both occupation and abundance, and the latter two populations dis-appeared before the end of the study. An important point here is that for the population of C. lineatus administrative measures were taken to avoid an impact by prevention of access to this population that, in fact, became isolated from other natural vegetation and enclosed between hangars. These measures were totally ineffective, the population went extinct in <10 years after its enclosure. In contrast, one population of
S. capensis, and two populations of H. marifolium recolonized parts of a
UNCORRECTED
PROOF
Fig. 5. Change in the overall population occupation over a four to five year interval (black triangles) and changes in permanent quadrat occupation (bars), i.e. local abundance, for five consecutive years and a supplementary year (2017) in six populations of Helianthemum marifolium. For each population, the significance of changes in occupation between the two parts of the study is indicated above the triangles and the significance of changes in abundance between years is indicated inside the bars using the McNemar χ² test (df=1: *p<0.05, ** p<0.01, ***p<0.001).
Thirteen populations also incurred direct destruction due to hu-man activities (including grazing), wild boar or competition with other species following human disturbance that had significant effects on pop-ulation transitions. As a result, 16 (50%) poppop-ulations showed a decline due to human disturbance and three populations disappeared in the 10 years that we visited sites. Although all species are listed for protection, the viability of their populations is compromised by human impacts. In a subsequent study (Gauthier et al., 2019) this vulnerability is analysed at the scale of their surrounding landscape and risk of further impacts.
4.3. Pertinence of the method
The generalised impact of human activities on the population dy-namics of the six species we studied illustrates the critical need for monitoring studies of protected plant species. Such monitoring should identify impacts on populations that affect their dynamics and make comparisons among populations and species in a given region to assess the overall effects of such impacts in relation to general environmen-tal change, as the IUCN red list recomends. This requires the simulta-neous study of a large number of sites and the examination of species with very different life forms and life histories. In the species we stud-ied here, some species are clonal, some populations have extremely high patch density whilst others have individuals that are so close together that it is not possible to discriminate them in a multi-year study. The method we used in this study based on transitions in frequency (due to either changes in occupation or classes of local abundance) with a single type of analysis, allowed us to detect significant modifications in population size and abundance in a range of annual and perennial species for which a classic demographic study would simply not be pos-sible. The field method and data analyses we present are easy to apply and the results simple to interpret; we have thus been able to present
our work to conservation management staff as a practical tool for mon-itoring rare species. This does not mean that, during such work, the im-portance of variability within and among populations or the search for new or vulnerable populations be neglected.
The main limit to this study is that we cannot identify the life history stages most impacted by environmental variation or disturbance. Study-ing presence / absence or classes of abundance only at the moment of peak flowering means that we cannot differentiate between seed to ju-venile regeneration and adult survival as causes of significant transitions among years. The regeneration of young plants is well known to be of vital importance for the viability of annual and perennial plant popula-tions in diverse situapopula-tions, as the references cited above and others (Bu-droni et al., 2014; Colling & Matthies, 2006) including the Mediter-ranean region (Matias, Zamora, & Castro, 2012; Thompson, 2005) illustrate. In addition, in typical arid Mediterranean habitats where most endemic species occur, adult survival is critical for long-term population persistence (García & Zamora, 2003; Thompson, 2005). Our method should thus be used as a basis for general studies of population dynam-ics across a landscape to guide choices for more detailed population and life-history level studies.
Acknowledgements
We thank GRT Gaz (contract 048522), GPMM(contract CT060235) and Autoroutes du Sud de la France(contract 093034) for financial support and
Thierry Bourgeois and several graduate students for help with field work: Thibault Lorin, Manon Piquenot, Ugo Shumpp, David Doblas, Laetitia de Nervo and Yoann Foulon. We thank staff at the Conservatoire Botanique National Méditerranéen de Porquerolles for help with identi-fication of species and choice of sites.
UNCORRECTED
PROOF
Fig. 6. Change in the overall population occupation over a five or four year interval (black triangles) and annual changes in permanent quadrats occupation (bars) in four popula-tions of Allium chamaemoly. For each population, the significance of changes in occupation between the two parts of the study is indicated above the triangles and the significance of changes in abundance between years is indicated inside the bars using the McNemar χ² test (df=1: *p<0.05, ** p<0.01, ***p<0.001).
Fig. 7. Change in the overall population occupation over a five or four year interval (black triangles) and annual changes in permanent quadrats occupation (bars) in three popula-tions of Astragalus glaux. For each population, the significance of changes in occupation between the two parts of the study is indicated above the triangles and the significance of changes in abundance between years is indicated inside the bars using the McNemar χ² test (df=1: *p<0.05, ** p<0.01, ***p<0.001).
UNCORRECTED
PROOF
Fig. 8. Proportion of populations that show a significant increase (white), decrease (dark grey) or no significant change indicative of stability (pale grey) for (a) overall population occupation and (b) abundance within quadrats. The left-hand column is for all 32 pop-ulations, the middle column is for the 14 annual species populations and the right-hand column is for the 18 perennial species populations. Each row is a period of the study (see text). Annual populations that went extinct were deleted from subsequent analyses.
Fig. 9. Total rainfall recorded during the spring growing season (February–April) in each year of the study period at nearby meteorological station.
References
Amat, M. E., Vargas, P., & Gómez, J. M. (2013). Effects of human activity on the distribu-tion and abundance of an endangered Mediterranean high-mountain plant (Erysimum penyalarense). Journal for Nature Conservation, 21, 262–271.
Andrieu, E., Besnard, A., Fréville, H., Vaudey, V., Gauthier, P., & Thompson, J. D., et al. (2017). Population dynamics of Paeonia officinalis in relation to forest closure: from model predictions to practical conservation management. Biological Conserva-tion, 215, 51–60.
Andrieu, E., Thompson, J. D., & Debussche, M. (2007). The impact of forest spread on a marginal population of a protected peony (Paeonia officinalis L.): The importance of conserving the habitat mosaic. Biodiversity and Conservation, 16, 643–658. Angert, A. L., Huxman, T. E., Barron-Gafford, G. A., Gerst, K. L., & Venable, D. L. (2007).
Linking growth strategies to long-term population dynamics in a guild of desert annu-als. Journal of Ecology, 95, 321–333.
Baumel, A., Affre, L., Véla, E., Auda, P., Torre, F., & Youssef, S., et al. (2009). Ecological magnitude and fine scale dynamics of the Mediterranean narrow endemic therophyte, Arenaria provincialis (Caryophyllaceae). Acta Botanica Gallica, 156, 259–272. Berjano, R., Gauthier, P., Fisogni, A., Doblas, D., Pons, V., & Thompson, J. D. (2013). Mate
limitation in populations of the endangered Convolvulus lineatus L.: A case for genetic rescue? Journal for Nature Conservation, 21, 334–341.
Bonnet, V., Fort, N., Dentant, C., Bonet, R., Salomez, P., & Till-Bottraud, I. (2015). Méthodologie de suivi des espèces végétales rares mise en place par un réseau d’ac-teurs de la conservation. Acta Botanica Gallica, 162(1), 27–36.
Braza, R., & García, M. B. (2011). Spreading recruitment over time to cope with environ-mental variability. Plant Ecology, 212, 283–292.
Budroni, M. A., Farris, E., Zirulia, A., Pisanu, S., Filigheddu, R., & Rustici, M. (2014). Evi-dence for age-structured depensation effect in fragmented plant populations: The case of the Mediterranean endemic Anchusa sardoa (Boraginaceae). Ecological Complexity, 20, 142–150.
Colling, G., & Matthies, D. (2006). Effects of habitat deterioration on population dynamics and extinction risk of an endangered, long-lived perennial herb (Scorzonera humilis). Journal of Ecology, 94, 959–972.
Domínguez Lozano, F., Moreno Saiz, J. C. M., & Sainz Ollero, H. (2003). Rarety and threat relationships in the conservation planning of Iberian flora. Biodiversity and Conserva-tion, 12, 1861–1882.
Elzinga, C. L., Salzer, D. W., & Willoughby, J. W. (1998). Measuring and monitoring plant populations. Denver, Colorado: U.S. Department of the Interior, Bureau of Land Man-agement, National Applied Resource Sciences Center.
Figueroa, M. E., & Davy, A. J. (1991). Response of Mediterranean grassland species to changing rainfall. Journal of Ecology, 79, 925–941.
Fox, L. R., Steele, H. N., Holl, K. D., & Fusari, M. H. (2006). Contrasting demographies and persistence of rare annual plants in highly variable environments. Plant Ecology, 183, 157–170.
Fox, M. D. (1995). Impact of interannual and seasonal rainfall variability on plant com-munity composition across a rainfall gradient. In Roy, J., Aronson, J., & di Castri, F. (Eds.), Time scales of biological responses to water constraints (pp. 56–70). Amster-dam: SPB Academic Publishing.
Fréville, H., Colas, B., Riba, M., Caswell, H., Mignot, A., & Imbert, E., et al. (2004). Spa-tial and temporal demographic variability in the endemic plant Centaurea corymbosa (Asteraceae). Ecology, 85, 694–703.
García, D., & Zamora, R. (2003). Persistence, multiple demographic strategies and con-servation in long-lived Mediterranean plants. Journal of Vegetation Science, 14, 921–926.
García, M. B. (2003). Demographic viability of a relict population of the critically endan-gered plant Borderea chouardii. Conservation Biology, 17, 1672–1680.
Gauthier, P., Pons, V., Letourneau, A., Papuga, G., & Thompson, J. D. (2017). Combining population trends with criteria for habitat vulnerability to assess the conservation sta-tus of populations of rare and endangered plants. Journal for Nature Conservation, 37, 83–95.
Gauthier, P., Bernard, C., & Thompson, J. D. (2019). Exploring vulnerability of listed Mediterranean plants in relation to risks of population loss. Journal for Nature Con-servation. (in press).
Gutierrez, J. R., & Meserve, P. L. (2003). El Nino effects on soil seed bank dynamics in north-central Chile. Oecologia, 134, 511–517.
Hardion, L., Barthélémy, C., Consales, J.-N., Gauthier, P., Thompson, J. D., & Verlaque, R., et al. (2015). An endangered reed, Arundo donaciformis, in a dynamic urban en-vironment: The need for interdisciplinary conservation proposals. Journal for Nature Conservation, 26, 20–27.
Jacquemyn, H., Brys, R., Hermy, M., & Willems, J. H. (2007). Long-term dynamics and population viability in one of the last populations of the endangered Spiranthes spiralis (Orchidaceae) in the Netherlands. Biological Conservation, 134, 14–21.
Joseph, L. N., Field, S. A., Wilcox, C., & Possingham, H. P. (2006). Presence–absence versus abundance data for monitoring threatened species. Conservation Biology, 20, 1679–1687.
Lehtilä, K., Syrjänen, K., Leimu, R., Begoña Garcia, M., & Ehrlén, J. (2006). Habitat change and demography of Primula veris: Identification of management targets. Conservation Biology, 20, 833–843.
Levine, J. M., McEachern, A. K., & Cowan, C. (2008). Rainfall effects on rare annual plants. Journal of Ecology, 96, 795–806.
Levine, J. M., & Rees, M. (2004). Effects of temporal variability on rare plant persistence in annual systems. American Naturalist, 164, 350–363.
UNCORRECTED
PROOF
Matias, L., Zamora, R., & Castro, J. (2012). Sporadic rainy events are more critical than in-creasing of drought intensity for woody species recruitment in a Mediterranean com-munity. Oecologia, 169(3), 833–844.
McCauley, D., & Ungar, I. A. (2002). Demographic analysis of a disjunct population of Froelichia floridiana in the mid-Ohio river valley. Restoration Ecology, 10, 348–361. McNemar, Q. (1947). Note on the sampling error of the difference between correlated
pro-portions or percentages. Psychometrika, 12(2), 153–157.
Minuto, L., Casazza, G., & Profumo, P. (2004). Population decrease of Thymelaea hir-suta (L.) Endl. in Liguria: Conservation problems for the North Tyrrhenian sea. Plant Biosystems, 138, 11–19.
Nicolè, F., Brzosko, E., & Till-Bottraud, I. (2005). Population viability analysis of Cypri-pedium calceolus in a protected area: Longevity, stability and persistence. Journal of Ecology, 93, 716–726.
Palmer, M. E. (1987). A critical look at rare plant monitoring in the United States. Biolog-ical Conservation, 39, 113–127.
Pouget, M., Baumel, A., Diadema, K., & Médail, F. (2016). Conservation unit allows as-sessing vulnerability and setting conservation priorities for a Mediterranean endemic
plant within the context of extreme urbanization. Biodiversity and Conservation, 26(2), 293–307.
Salanon, R., Gandioli, J.-F., Kulesza, V., & Pintaud, J.-C. (1994). La flore littorale des Alpes-Maritimes: évolution depuis le XIXe siècle et bilan actuel. Biocosme mésogéen, 11, 53–329.
Schemske, D. W., Husband, B. C., Ruckelshaus, M. H., Goodwillie, C., Parker, I. M., & Bishop, J. G. (1994). Evaluating approaches to the conservation of rare and endan-gered plants. Ecology, 75, 584–606.
Schleuning, M., & Matthies, D. (2008). Habitat change and plant demography: Assessing the extinction risk of a formerly common grassland perennial. Conservation Biology, 23, 174–183.
Thompson, J. D. (2005). Plant evolution in the Mediterranean. Oxford: Oxford University Press.
Venable, D. L., Pake, C. E., & Caprio, A. C. (1993). Diversity and coexistence of Sonoran desert winter annuals. Plant Species Biology, 8, 207–216.
Villellas, J., Berjano, R., Terrab, A., & García, M. B. (2014). Divergence between pheno-typic and genetic variation within populations of a common herb across Europe. Ecos-phere, 5, 1–14.