HAL Id: hal-03016639
https://hal.archives-ouvertes.fr/hal-03016639
Submitted on 20 Nov 2020
HAL is a multi-disciplinary open access
archive for the deposit and dissemination of
sci-entific research documents, whether they are
pub-lished or not. The documents may come from
teaching and research institutions in France or
abroad, or from public or private research centers.
L’archive ouverte pluridisciplinaire HAL, est
destinée au dépôt et à la diffusion de documents
scientifiques de niveau recherche, publiés ou non,
émanant des établissements d’enseignement et de
recherche français ou étrangers, des laboratoires
publics ou privés.
Extensive horse grazing improves grassland vegetation
diversity, seed bank and forage quality of artificial
embankments (Rhône River - southern France)
Cannelle Moinardeau, Francois Mesleard, Hervé Ramone, Thierry Dutoit
To cite this version:
Cannelle Moinardeau, Francois Mesleard, Hervé Ramone, Thierry Dutoit. Extensive horse
graz-ing improves grassland vegetation diversity, seed bank and forage quality of artificial embankments
(Rhône River - southern France). Journal for Nature Conservation, Elsevier, 2020, 56, pp.125865.
�10.1016/j.jnc.2020.125865�. �hal-03016639�
Contents lists available atScienceDirect
Journal for Nature Conservation
journal homepage:www.elsevier.com/locate/jnc
Extensive horse grazing improves grassland vegetation diversity, seed bank
and forage quality of arti
ficial embankments (Rhône River - southern
France)
In
fluence of extensive horse grazing on artificial embankments
Cannelle Moinardeau
a,*, François Mesléard
a,b, Hervé Ramone
a, Thierry Dutoit
aaInstitut Méditerranéen de Biodiversité et Ecologie, UMR CNRS-IRD, Avignon Université, Aix-Marseille Université, IUT d’Avignon, 337 chemin des Meinajariés, Site
Agroparc BP 61207, 84911 Avignon, cedex 09, France
bInstitut de Recherche de la Tour du Valat, Le Sambuc, 13200 Arles, France
A R T I C L E I N F O Keywords: Artificial ecosystems Extensive grazing Konik-Polski horses Seed bank Forage quality Grassland A B S T R A C T
Grazing by herds of herbivores modifies plant communities in different ways, depending on the herbivore species. Horse grazing is already known to be effective in increasing plant diversity and maintaining herbaceous vegetation, creating different types of patches and thus ensuring spatial heterogeneity. On an artificial em-bankment at the Donzère-Mondragon hydroelectric facility in the Rhône Valley, extensive grazing by a rustic horse (Konik-Polski) was introduced several years ago to control shrub encroachment and to enhance plant grassland diversity. Vegetation monitoring surveys over afive-year period (2014–2018) showed that horse grazing maintained patches of open and short grasslands and increased species-richness, in particular of annual species, some of which have heritage value. In contrast, overly-low grazing pressure led to the dominance of an unpalatable perennial grass (Brachypodium phoenicoides) at the expense of the annual species that significantly enhance the forage value of the most heavily grazed patches. Horse grazing also had a positive impact on the permanent seed bank of the soil, increasing its heterogeneity and the density of viable seeds. Extensive horse grazing thus appears to be a relevant management tool to preserve the diversity and the forage quality of the most open and short grasslands. Nevertheless, grazing pressure here remained too low to allow restoration of grasslands already colonised by woody species. Combining different livestock species might be a better alter-native to pure horse grazing, to increase heterogeneity and diversity. Our results are discussed in relation to extensive horse grazing on artificial ecosystems, such as the embankments bordering rivers and canals.
1. Introduction
Mankind today plays a major role in the widespread changes to ecosystems worldwide (Ellis, Klein Goldewijk, Siebert, Lightman, & Ramankutty, 2010). Human activities are generating 'new ecosystems' unconnected with earlier ones (Harris, Hobbs, Higgs, & Aronson, 2006;
Murcia et al., 2014;Root & Schneider, 2006). Despite having lost part of their biodiversity, functions and ecosystem services, these ecosys-tems are nonetheless able to reorganise themselves. However, the new combinations of species are difficult to predict, because of ongoing changes worldwide (climate, land-use, biological invasions), and be-cause the current typologies lack analogues on which to base predic-tions of their trajectories.
These 'new ecosystems' challenge the concepts and practices in the
ecology of conservation and restoration that have proved relevant to existing or earlier assemblages, but which do not take into account the new sites’ potential. In Europe, many of the 'new ecosystems' result from the construction of dams, embankments and channels (Jensen, Trepel, Merritt, & Rosenthal, 2006). There is a need for suitable man-agement practices which promote successional trajectories and enhance biodiversity, ecosystem functions and services associated with these often young and highly artificial habitats. In addition, it is largely un-clear whether methods commonly employed to manage pioneer her-baceous plant formations, such as extensive grazing or mowing, can be effective within these new ecosystems, as has been demonstrated for many other semi-natural ecosystems (Carboni, Dengler, Mantilla-Contreras, Venn, & Török, 2015).
It has been widely demonstrated that moderate grazing can induce a
https://doi.org/10.1016/j.jnc.2020.125865
Received 8 November 2019; Received in revised form 9 June 2020; Accepted 10 June 2020
⁎Corresponding author.
E-mail address:cannelle.moinardeau@gmail.com(C. Moinardeau).
1617-1381/ © 2020 Elsevier GmbH. All rights reserved.
spatial heterogeneity favourable to plant diversity (McNaughton, 1984). Overly-low grazing intensity can lead to a decline in plant spe-cies-richness through weak control of competition (Valkó et al., 2018). In contrast, overly-high grazing pressure can result in the dominance of species highly tolerant to grazing or of unpalatable species, and the elimination of species unable to regenerate via the soil seed bank (Cousens, Dytham, & Law, 2008). The seed bank has also been re-cognised as a key compartment for community persistence, in particular where communities are exposed to regular disturbances such as grazing (Bakker, Poschlod, Strykstra, Bekker, & Thompson, 1996). However, certain species do not establish permanent seed banks in the long term, and this includes the majority of species typical of grazing herbaceous ecosystems (Milberg, 1992;Thompson & Grime, 1979).
For several decades, horse grazing in particular has been widely used for the management of semi-natural grasslands (Gilhaus & Hölzel, 2016;Köhler, Hiller, & Tischew, 2016;Loucougaray, Bonis, & Bouzillé, 2004). It enables vegetation to become structured in a mosaic of pat-ches of shorter herbaceous strata that are more conducive to new plant species. Horses preferentially select plots where biomass is high (Duncan, 1992); in winter, horses can shift to the sites offering the
highest consumable biomass, including the dead parts of plants. This selection creates a heterogeneous mosaic of patches of vegetation, ranging from very open short grasslands dominated by annual and biannual grass species, to tall grasslands dominated by perennial grass species and often dotted with thefirst shrubs heralding the closing up of the herbaceous vegetation by shrub thickets. Horses have a preference for grass, although they also consume forb species in winter (Cosyns, Degezelle, Demeulenaere, & Hoffmann, 2001;Duncan, 1992;Lamoot, Meert, & Hoffmann, 2005;Ménard, Duncan, Fleurance, Georges, & Lila, 2002).
Numerous studies have investigated the impact of horse grazing on plant communities and its potential to meet conservation management objectives (Duncan, 1992;Henning, Lorenz, von Oheimb, Härdtle, & Tischew, 2017; Köhler et al., 2016). However, there has been little research on horse grazing in a highly artificial ecosystem (Lindenmayer et al., 2008), and such studies have rarely examined two compartments (above-ground vegetation, seed bank) in relation to forage quality (Gilhaus & Hölzel, 2016). The present study explored the impact of extensive grazing by Konik-Polski horses on community composition, seed bank and forage value of vegetation of an artificial embankment along a tailrace channel situated in the lower Rhone Valley. We aimed, through afive-year monitoring period (2014–2018) to determine the possible feedback between these compartments and whether this management type could be used for the conservation of‘new ecosys-tems' resulting from the construction of dykes and embankments.
Thus, our main goal was to test whether grazing by horses has significant impacts on the composition and species richness on the seed bank of the mosaic of patches, and in particular whether species rich-ness and the density of seeds in the soil increases in heavily grazed patches (Saatkamp, Henry, & Dutoit, 2017;Thompson & Grime, 1979). Because horse grazing alters the competition between plant species of the above-ground vegetation and changes its structure, the quality of grass resources can vary widely over time and space in line with the pattern of consumption at the origin of feedback loops (Crawley, 1983). We also tested the hypothesis that extensive horse grazing favours an-nual plant species, which can provide good forage, thus ensuring the sustainability of the grazing system (Vulink, Drost, & Jans, 2000). Fi-nally, we sought any positive link between the impact of horse grazing on species-richness and on seed density of annual species and the im-proved quality of grass resources due to this impact, in the most heavily grazed grasslands (open short grasslands).
The following questions were addressed:
- How does extensive horse grazing affect the species richness, the associated seed bank and the heterogeneity of different vegetation patches in 'new ecosystems’?
- How is the forage quality of the vegetation (mineral content, di-gestibility) affected by extensive horse grazing?
- Is extensive horse grazing a useful and sustainable method of con-serving the herbaceous vegetation of 'new ecosystems’?
2. Materials and methods
2.1. Study site
The site (27 ha) is located along a channel of the Rhône river about 50 km north of Avignon, downstream of the hydroelectric power station of Donzère-Mondragon (N: 44°18′13.3″ E: 4°44′32.9″,Fig. 1). The dam was built in the early 1950s using millions of tons of alluvial sediment extracted during the digging of the canals; see (Moinardeau, Mesléard, & Dutoit, 2016;Moinardeau, Mesléard, Ramone, & Dutoit, 2019). The site is a part of a fauna andflora reserve named “Réserve Naturelle de Chasse et de Faune Sauvage de Donzère-Mondragon” and created in 1954 (Roux et al., 2012). The dominant vegetation is herbaceous vegetation covering 53 % of the site in 2017, including a tussock grass (Brachy-podium phoenicoides) which covered 35 % in 2017 and some annual species (Lysimachia arvensis, Filago germanica, Crepis sancta, Galium parisiense, etc.). Different shrub species (Crataegus monogyna, Cornus sanguinea, Rubus sp., etc.) had also colonised the site and covered 47 % in 2017.
For conservation purposes, four Konik–Polski mares were in-troduced in 2008 and in 2014 after two years without grazing. The horses grazed the whole site throughout the year, which represented a grazing pressure of 0.04 Livestock Unit (LU) per ha per year. In 2016, three new mares were added which represented a grazing pressure of 0.07 LU.ha. year−1.
The local climate of the area is Mediterranean, with an average rainfall of 600 mm mostly in autumn and to a lesser extent in early spring. The year 2017 was characterised by particularly low rainfall precipitation (Table 1). During thefive years of the study (2014–2018), the average temperature remained close to 15 °C, without major
inter-Fig. 1. Location of the Donzère-Mondragon study site in the lower Rhone valley in south-eastern France. Location of the study site (dashed lines), boundaries of the reserve (black lines), hydro-electric plant (light grey dots), channel (dark grey lines), the Rhone (light grey lines).
annual variation.
2.2. Vegetation monitoring
Aerial photographs were used to characterise the different vegeta-tion patches during the absence of horses in 2012 and 2013 and after their reintroduction we used. We distinguished six types of vegetation patches: open grasslands (OG) with bare zones corresponding to areas with more silt and clay deposits; short grasslands (SG) totally covered by herbaceous vegetation 10–20 cm in height; tall grasslands (TG) dominated by B. phoenicoides 20–30 cm in height; tall grasslands dotted with shrubs (TGS) of 62 % cover in 2017; shrub thickets (ST) and un-grazed tall grasslands, outside the un-grazed fenced areas, used as controls without management (C).
We monitored vegetation in permanent quadrats (five per type of patches, 5 × 6 = 30 quadrats) whose sizes (2 × 2 m) were determined for each type of patch by calculating the Minimum Area (Guinochet, 1973). We estimated the abundance of each plant species by assigning cover classes as above: 1 = less than 5% of the plot, 2 = between 5 and 25 %, 3 = between 26 and 50 %, 4 = between 51 and 75 %, 5 = more than 75 %, and + = a single individual present. Vegetation cover (%), height (cm) and bare soil cover (%) were recorded each year between 2014 and 2018 in May, when most plants are identifiable. The no-menclature of vascular plants follows (Tison, Jauzein, & Michaud, 2014).
We calculated alpha-diversity (species richness per plot, mean spe-cies number) and beta-diversity by the Bray–Curtis distance between thefive quadrats for each type of patch to compare the different ve-getation patches in terms of species-richness and composition similarity
(Borcard, Gillet, & Legendre, 2011).
2.3. Soil seed bank
We sampled the soil seed bank in three grassland patches (OG, SG, TG) and in the ungrazed tall grasslands considered as control (C) during winter 2016−2017. Ten replicates were randomly distributed for each vegetation patch. Each sample consisted of one dm3 of soil
(corre-sponding to the sample of a 25 × 25 cm quadrat) and at a depth of 15 cm. We extracted the seeds from the soil according to the sample concentration method (ter Heerdt, Verweij, Bekker, & Bakker, 1996). We dipped each sample in water during 30 min and then concentrated them by sifting under a water column through a mesh of 2−4 mm and 200μm. To prevent possible tegumental dormancy, we lightly rubbed the seeds. We spread out concentrated soil in a thin layer (< 0.5 cm) on seeding trays filled with a 2 cm layer of vermiculite coupled with compost (30 %), and covered with a sterile 2μ medical compress. The trays were placed in a greenhouse (20−25 °C) under constant condi-tions and regularly watered. We recorded and counted seedlings each week and removed them to avoid any competition. We stopped the monitoring after 6 months after observing a significant period without any germination. Seedlings were identified using the flora ofMamarot (2002),Muller (1978),Tison et al. (2014).
2.4. Forage values
Above-ground plant biomass sampling was carried out on a seasonal basis, from autumn 2016 to summer 2017 (4 seasons in October, January, May and July). We collectedfive replicates (handful size) of fresh biomass in each patch distinguished (OG, SG, TG, TGS, ST, C). Plants were cut at a height of 3 cm to avoid mineral contamination from the soil. We only collected leaves for shrub species, considering that horses mainly feed on leaves when grazing is extensive. No debarking was observed (Moinardeau, pers. obs.). On the day of collection, the samples were taken to the laboratory (Laboratoire Teyssier) for analysis to the standards used by AFNOR Paris (1985) andJarrige (1988).
The dry matter content of the samples was measured after 4 h of oven-drying at 103 °C. The mineral matter content was measured after 6 h of calcination in the oven at 550 °C. The gross cellulose content was estimated by the WEENDE method (Henneberg & Stohmann, 1864). The digestibility of the organic matter was calculated using regression
Table 1
Meteorological data for study site during period monitored. Location of weather station: Latitude 44.133, Longitude 4.833, Height 55 m above sea level. Data:
www.freemeteo.fr.
Year Mean temperature (°C) Rainfall (mm)
2014 15.01 814.8
2015 14.79 770.7
2016 15.05 546.4
2017 15.15 299.2
2018 (First half-year) 12.75 525.6
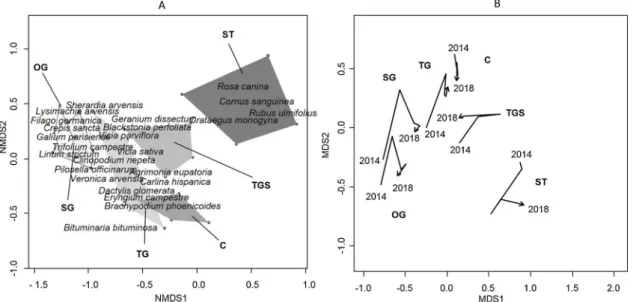
Fig. 2. NMDS ordination (NMDS stress = 0.17) based on vegetation surveys (30 quadrats x 141 species) carried out in different patches of vegetation at the study site grazed by horses.Fig. 2A showed the 2018 samples grouped by vegetation type (polygons): open grasslands with bare soil (OG), short grasslands (SG), tall grasslands (TG), tall grasslands dotted with shrubs (TGS), shrub thickets (ST) and ungrazed control (C). Only the species most closely correlated with thefirst two axes are listed.
equations. The gross protein content was gauged using the method of Kjeldhal (Kjeldahl, 1883). The main minerals (magnesium, calcium, potassium, phosphorus) were measured using an atomic adsorption spectrophotometer (Thermo Scientific Company). The Horse Forage Unit was calculated using the standard equations (Jarrige, 1988).
2.5. Statistical analyses
2.5.1. Vegetation monitoring
Composition and abundance of plant species were ordinated using non-metric multidimensional scaling (NMDS) based on Bray–Curtis si-milarity (Borcard et al., 2011). Trajectories of the centroids of the
Fig. 3. Mean and standard error for species richness per patch of vegetation and per year (2014-2018) on the study site grazed by the horses: open grasslands (OG), short grasslands (SG), tall grasslands (TG), tall grasslands dotted with shrubs (TGS), shrub thickets (ST) and ungrazed control (C), (N = 5 for each patch, each year). Histograms with common letters do not show a significant difference between vegetation types for the same year, according to ANOVA test following with Tukey's post-hoc test. P value: * < 0.05, ** < 0.01, *** < 0.001.
Table 2
Differences in species richness of each vegetation patch between each year studied. Results of the tests and their significance, as well as the mean value and standard deviation are shown in the table, significance: p < 0.05 *, p < 0.01 **, p < 0.001 ***. [Fig. 3].
Vegetation patches F value (Df = 4) p value 2014 2015 2016 2017 2018
Species richness (/ 4m²) OG 5.34 ** 26 ± 1.38 27.8 ± 2.26 30.6 ± 1.43 34 ± 1.30 35.8 ± 2.22 SG 4.58 ** 24.8 ± 1.32 25 ± 1.61 26.6 ± 2.84 26.8 ± 1.49 35.2 ± 2.35 TG 1.49 NS 19.2 ± 0.49 19.8 ± 1.77 21.8 ± 1.82 23 ± 4.58 27.2 ± 2.51 TGS 2.28 NS 20.6 ± 3.65 21.4 ± 2.94 14.6 ± 3.72 19.2 ± 1.95 27.4 ± 2.6 ST 0.81 NS 15.2 ± 3.41 17.4 ± 3.77 21.2 ± 2.33 15.4 ± 3.47 13 ± 3.89 C 1.17 NS 20.6 ± 0.50 17.2 ± 1.77 16.6 ± 1.91 15.8 ± 2.51 17 ± 1.04
polygons of the vegetation patches were analyzed to illustrate how plant community composition evolved. Comparisons of height of ve-getation, species richness and Bray-Curtis distance between vegetation patches were performed using ANOVA tests for multiple comparisons when the data were normally distributed (Shapiro-Wilk or Lilliefors tests). When a significant difference was detected, we realized a Tukey post-hoc test from the model. When the data did not follow a normal distribution pattern, a Kruskal-Wallis non-parametric test or a Mann-Whitney-Wilcoxon non-parametric test was used, with the p value ad-justed (Benjamini & Hochberg, 1995) for two-by-two comparison.
2.5.2. Soil seed bank
NMDS was performed on the mean number of seeds per sample and the mean number of seeds per species. We performed univariate ana-lyses on species richness, density of germinated seeds, Evenness and Bray-Curtis distance, using the same method as for plant samples. We calculated the similarity between species composition of the seed bank and vegetation using Sørensen index (Mueller-Dombois & Ellenberg, 1974).
2.5.3. Forage value
To compare the mineral elements and nutritive values among the different patches of vegetation and between season, a multivariate Principal Component Analysis (PCA) was performed on the major mi-neral elements (magnesium, calcium, potassium, phosphorus), cellu-lose, proteins by patches and for each season studied. Univariate ana-lyses were carried out for each of the elements per season and then for each vegetation patch per seasons. Finally, Spearman correlation tests were applied to the data from the botanical sampling carried out the same year, in spring 2017.
All statistical analyses were performed with R software version R 3.2.2 (The R Foundation for Statistical Computing). The native packages were used for univariate analyses and the additional packages ade4 and nortest (Chessel, Dufour, & Thioulouse, 2004;Dray & Dufour, 2007) for multivariate analyses (PCA and NMDS).
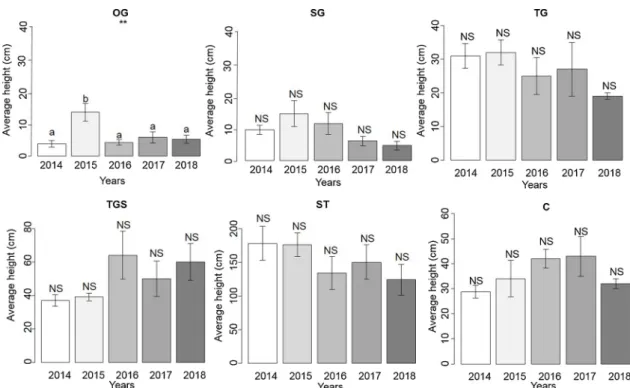
Fig. 4. Mean and standard error for mean height of herbaceous vegetation of the six vegetation patches on the study site grazed by horses (OG, SG, TG, TGS, ST and C) per year of monitoring (2014-2018), (N = 5 for each patch, each year). Histograms with common letters do not show a significant difference between vegetation types for the same year, ANOVA test following with according to Tukey's post-hoc test. P value: * < 0.05, ** < 0.01, *** < 0.001.
Table 3
Seed bank species identified for each vegetation patch sampled (open grass-lands, short grassgrass-lands, tall grassgrass-lands, non-grazed control). Number of seeds and species in the seed bank are indicated, as well as number of species in the vegetation surveys in 2017.
Type of grassland patches Soil seed bank Vegetation
Seedlings Species Species
Open grasslands (OG) 1184 33 64 Short grasslands (SG) 921 47 58 Tall grasslands (TG) 698 49 57 Non-grazed Control (C) 581 50 43
Fig. 5. NMDS ordination on seed bank data (N = 36, 90 species, NMDS stress = 0.24) collected from the study site grazed by horses. Vegetation patches studied are represented by polygons: open grasslands (OG), short grasslands (SG), tall grasslands (TG), and ungrazed control (C). For simplicity, only the plants most closely correlated with thefirst two axes are listed.
3. Results
3.1. Vegetation monitoring
Plant community composition
The NMDS analysis (stress NMDS = 0.17,Fig. 2A) performed on the vegetation monitored in 2018 (30 quadrats x 141 species, Appendix A) showed a clear gradient between the different patches identified on axis 1. The most heavily grazed grasslands (OG and SG) were not di ffer-entiated by species composition, both being dominated by the same annual species (Lysimachia arvensis, Filago germanica, Crepis sancta, Galium parisiense, etc.). A certain number of these species were reported as rare, including Limonium echioides and Ranunculus parviflorus, whose only known station in the Vaucluse area is our study site (Roux, Noble, Barcelli, & Roux, 2012)
These patches differed in composition from the tall grasslands (TG) still present in the grazed areas and from the control (C) without grazing. They possessed a common pool of species, with a pre-dominance of perennial gramineous species (B. phoenicoides, Dactylis glomerata) and of species rejected by grazing animals (Eryngium cam-pestre). While the grasslands dotted with woody species (TGS) did not possesses strictly correlated species, as might be expected they have species in common with the tall grasslands (Geranium dissectum, Blackstonia perfoliata, Vicia sativa, etc.). The shrub thickets (ST) were mainly characterised by the dominance of deciduous or semi-evergreen woody shrub species (Rosa canina, Cornus sanguinea, Rubus ulmifolius, etc.).
The 2014–2018 trajectories of the centroids of the polygons of the vegetation patches illustrate how plant community composition evolved under the effect of horse grazing (Fig. 2B). The grasslands ex-posed to the highest grazing pressure (OG and SG) showed similar trajectories. In contrast, TG, TGS, less grazed, showed trajectories close to C. ST followed a trajectory opposite to that of all the other patches.
Plant community species-richness
Five years of monitoring revealed that the species richness of OG and SG was significantly higher in 2018 than in 2014 (Fig. 3,Table 2).
Plant community height
The mean height of OG was significantly greater than those of the other patches in 2015 (F = 5.85, df = 4, p < 0.01,Fig. 4). Non-sig-nificant trends were also measured for TG regarding increased species-richness (Fig. 3), reduced mean height (Fig. 4) and differing composi-tion compared to the tall grasslands (Fig. 2A).
3.2. Soil seed bank
A total of 3384 seeds germinated, corresponding to 90 species of which 52 were annuals (Appendix B and C). The total number of
germinated seeds and the species-richness of the above-ground vege-tation showed a gradient. OG had the highest abundance of seeds (1184) and the highest above-ground vegetation species-richness (64), whereas C had the lowest seed abundance (581) and above-ground vegetation species-richness (43). This gradient was, however, not ob-servable for seed bank species-richness, where the lowest value is re-corded for the open grasslands (33) (Table 3).
In the seed bank, the most abundant species for all patches com-bined were: Erigeron sumatrensis (475 seedlings, present in 99 % of seed trays); Dipsacus fullonum (504 seedlings, present in 93 % of seed trays); and Blackstonia perfoliata (1071 seedlings, present in 92 % of seed trays).
The NMDS analysis (stress NMDS = 0.24) performed on the iden-tified seedlings from the seed banks (Fig. 5) distinguished clearly be-tween three patches: OG, dominated by small annual species such as Centaurium tenuiflorum, Catapodium rigidum, Lysimachia arvensis; SG, mainly dominated by Dipsacus fullonum or Medicago sp., and the un-grazed control, C, dominated by perennial species such as Dactylis glo-merata, Rumex crispus, Cirsium vulgare. TG patch was not clearly dis-tinguished with regard to species composition, overlapping with two other patches (SG and C) according to the NMDS (Fig. 5).
Species-richness of seed banks did not differ significantly between the different patches of vegetation studied (F = 2.315, df = 3, p > 0.05). A trend can nonetheless be observed, with the OG patch having fewer species than the other patches (Table 2). The seed bank of this patch showed the highest density of seedlings (2104.88 ± 439.32 seeds/m²), significantly different from that of the control (1032.88 ± 119.97 seeds/m²; F = 3.19, df = 3, p < 0.05;Fig. 6A). The Bray-Curtis index differed between the patches (Kruskal-Wallis chi-squared = 19.41, df = 3, p < 0.001,Fig. 6B). Evenness did not differ
significantly between patches, although OG had the highest hetero-geneity (0.87 ± 0.01). The proportion of seedlings of B. phoenicoides was significantly higher in TG and also in C, not statistically different from each other types (Kruskal-Wallis chi-squared = 9.7114, df = 3, p < 0.05,Fig. 5).
The similarity between the soil seed bank and the herbaceous ve-getation taken as a whole showed a clear gradient: 37 % for OG, 30 % for SG, 26 % for TG and only 17 % for C (Table 4). Thus the closing of the vegetation and its dominance by B. phoenicoides were correlated with a decline in the Sørensen similarity index. This pattern was ob-served more for annual species than for perennials.
3.3. Forage values
3.3.1. Seasonal variations in forage values between vegetation patches Axis 1 of the different PCAs performed for each season in the dif-ferent patches of grassland and for the leaves of shrub thickets
Fig. 6. A. Mean seed density and standard error per patch of vegetation (N = 9 for each patch) on the study site grazed by horses: open grasslands (OG), short grasslands (SG), tall grasslands (TG) and ungrazed control (C). Histograms with common letters do not show a significant difference among vegetation type, according to Tukey's post-hoc test. P value: * < 0.05, ** < 0.01, *** < 0.001. B. Mean and standard error of the Bray-Curtis index calcu-lated per patch of vegetation studied (N = 9 for each patch) at the site grazed by horses : OG, SG, TG and C. Histograms with common letters do not show a significant difference among vegetation type, according to Wilcoxon's post-hoc test. P value: * < 0.05, ** < 0.01, *** < 0.001.
systematically opposed the most closed patches (TG, TGS, C) to OG and SG, (Fig. 7). At all four seasons, the ellipse corresponding to the leaves of thickets differed from the other patches of vegetation, the most correlated common features being magnesium, calcium, potassium, phosphorus and higher protein content. On the other hand, the thicket leaves were inversely correlated with the presence of cellulose. In au-tumn and spring, the forage from OG and SG differed from that of the other patches of grassland. Thus, patches OG and SG were correlated with the presence of phosphorus, potassium and proteins. In summer and winter, there was less distinction between patches and the whole range of patches thus constituted a single pool. The univariate analyses singled out concentrations of phosphorus and proteins in autumn and spring, significantly higher for OG and SG than for the other patches studied (Table 5). Quantities of potassium were significantly higher in
the thicket leaves and the most open grasslands in spring, autumn and winter, and were lowest in TG, TGS. Magnesium and calcium con-centrations, significantly higher in the thicket leaves than in the other patches of vegetation, followed the same seasonal pattern. TGS and OG had the next highest concentrations, followed by TG and C. Magnesium was significantly higher in winter for SG, and calcium in autumn.
Over the course of the year, cellulose content was significantly lower in the leaves (ST) which had the highest digestibility rate (Table 5). OG and TGS showed similar digestibility. Significantly lower digestibility was found for TG and C, whose rates were similar. The Horse Forage Unit (HFU), or energy value of the different forages sampled, was significantly higher in the thicket leaves (between 0.73 and 0.82 ± 0.005, according to season). The digestibility rate was lowest in the tall grasslands and the controls, although in summer, the rate was not significantly different from that of the other patches (Table 5).
3.3.2. Correlations between features measured and above-ground vegetation Cellulose was negatively correlated with digestibility or dMO (r =−0.95, p < 0.001, Fig. 8). However dMO was strongly correlated with proteins (r = 0.86, p < 0.001). The digestibility of foods and their chemical composition were strongly correlated with phosphorus, cal-cium, magnesium and potassium. Magnesium and calcium were strongly correlated with each other (r = 0.95, p < 0.001), and in-versely correlated with cellulose (r =−0.92, p < 0.001 for magnesium and r =−0.90, p < 0.001 for calcium). Phosphorus, potassium and proteins were also positively correlated (r = 0.66, p < 0.001 for P and K, r = 0.66, p < 0.001 for P and proteins, r = 0.87, p < 0.001 for proteins and K). Regarding correlations between these values and some variables in the grassland patches sampled (total species-richness, richness in annual species, B. phoenicoides cover), only species-richness was positively correlated with the presence of potassium (r = 0.40, p < 0.05). Strong B. phoenicoides cover was, on the other hand, nega-tively correlated with magnesium concentrations (r = −0.36, p < 0.05) and calcium (r =−0.41, p < 0.05). The other correlations were not significant (Fig. 8).
4. Discussion
4.1. Impact of extensive horse grazing on above-ground vegetation and soil seed bank
The impact of extensive Konik-Polski horse grazing on the study site between 2014 and 2015 essentially concerns the most open patches of grassland. Their species-richness and their heterogeneity were sig-nificantly higher than those of other patches. Increased grazing pressure in 2016 due to the arrival of three new mares resulted in a drop in mean height and a parallel increase in species-richness, including in the tal-lest grass patches. Once the dominance of B. phoenicoides declined under the impact of grazing, species-richness increased, in particular due to the establishment of annual species, some of which are of heri-tage value. Thus, year-round horse grazing may be suitable for
Table 4 Comparison of species composition between seed bank and vegetation identi fi ed during vegetation surveys (open grasslands, short grasslands, tall grasslands, non-grazed control). The table gives species counted in the seed bank, in the expressed vegetation and common species. The Sørensen similarity index calculated is expressed as a percentage (%). Open grasslands Short grasslands Tall grasslands Non-grazed control Seed bank Vegetation Common Sørensen (%) Seed bank Vegetation Common Sørensen (%) Seed bank Vegetation Common Sørensen (%) Seed bank Vegetation Comm on Sørensen (%) Annuals 21 44 13 40 30 35 10 30 33 28 8 26 29 15 2 9 Perennials 12 16 6 42 15 18 4 24 14 25 5 25 17 22 5 25 Total 33 64 18 37 47 58 16 30 49 57 14 26 50 43 8 17
preventing the further spread of competitive grasses (Henning et al., 2017). Various examples of creation and maintenance of a hetero-geneous mix of open, short and tall grasslands by horse grazing have already been reported in semi-natural areas (Cosyns et al., 2001;
Duncan, 1992;Köhler et al., 2016).
Furthermore, our study showed no significant difference in species-richness between the permanent seed banks of the different patches of grazed or ungrazed vegetation, confirming the findings of a previous study (Meissner & Facelli, 1999). At our site, the 10 years of grazing that led to the different patches identified in the above-ground vege-tation was not long enough to significantly change their permanent seed bank. The most open patches showed the highest number of seeds and the highest heterogeneity, echoing the results obtained for the above-ground vegetation. This dissimilarity stems from the dominance of perennials with clonal multiplication in the less grazed or ungrazed vegetation, where it is unlikely that numerous seeds will persist in the soil due to low production at the surface (Marage, Rameau, & Garraud, 2006).
4.2. Application of extensive horse grazing and forage quality
Recurrent grazing maintains the quality of the forage at a high and relatively stable level by stimulating plant regrowth (Ringmark, Skarin, & Jansson, 2019;Wallis De Vries, Bakker, Bakker, & Wieren, 1998). Thus, when the forage supply is sufficient, herbivores tend to con-centrate on herbaceous areas that have already been extensively grazed
(McNaughton, 1984). Our analyses showing that grazing was mainly concentrated in the most open grasslands are consistent with these findings.
The thickets consist of dicotyledons, whose leaves have been found to be richer in minerals than those of monocotyledons. This is reflected in results from our site: the thicket leaves contain high concentrations of calcium and magnesium and less cellulose than the grasslands, and show higher digestibility of organic matter (dMO), (Selmi, Ben Gara, Rekik, & Rouissi, 2011). This may be explained by the greater number of cell wall constituents in the herbaceous plants.
The tall grassland patches and the non-grazed control at our site, both dominated by perennial species, have a lower digestibility rate (Gilhaus & Hölzel, 2016) than the other patches. Consequently, the energy value (Horse Forage Unit) is higher in thicket leaves and lower in tall grasslands and control. Above all, the tall grasslands are domi-nated by a perennial grass (B. phoenicoides) and are very poor in legume species (Moinardeau et al., 2016), which also explains the lower rate of proteins recorded in the non-grazed control, since legumes are richer in proteins than grasses (Wolter, 2014). The shrub dotted grasslands are a mixture of both B. phoenicoides and shrubs, and their protein content thus falls between those of the control and the thicket leaves. In the other grassland patches, the higher rates measured may be explained by the presence of rosettes of biannual plants (Centaurium erythraea, Picris hieracioides, Crepis vesicaria) where the horses had already grazed the previous year. The quantity of potassium was lower in the tall grass-lands, where B. phoenicoides was also negatively correlated with the
Fig. 7. Principal Component Analysis (PCA) based on 30 samples and 6 mineral value variables for the study site grazed by horses, per season studied in 2016-2017. A: Spring, B: Summer, C: Autumn, D: Winter. Open grasslands (OG), short grasslands (SG), tall grasslands (TG), tall grasslands dotted with shrubs (TGS), leaves (ST) and ungrazed control (C).
presence of calcium and magnesium, confirming the low concentrations of these ions in the patches rich in perennial grasses (control and tall grasslands). The phosphorus content of grasses decreases rapidly during their cycle, while that of the legume species decreases more slowly. On this embankment, a strong pattern of seasonal variation was observed, in particular for digestibility, which was distinctly higher in spring.
With the approach of winter, and the stress associated with the cold and the reduced solar irradiance, the grass growth rate declines and the senescence of the above-ground biomass increases (Wallis De Vries et al., 1998). The herbivores are then confronted with a depletion of good quality forage and must rely on forage of poorer quality or turn to other resources, such as the leaves of thickets, all semi-deciduous
Table 5
Results of tests carried out for each forage value by vegetation patches sampled: open grasslands (OG), short grasslands (SG), tall grasslands (TG), tall grasslands dotted with shrubs (TGS), leaves and ungrazed control (C). Test results and their significance, mean value and standard deviation are given for each vegetation patch. Patches with the same letters do not show a significant difference, df = 3, P value: * < 0.05, ** < 0.01, *** < 0.001.
Vegetation Statistics P Spring Summer Autumn Winter
Magnesium g kg−1
OG F = 1.44 NS 1.34 ± 0.23– 1.06 ± 0.11– 1.02 ± 0.06– 1.40 ± 0.18– SG F = 15.55 *** 1.17 ± 0.04a 0.78 ± 0.05b 1.05 ± 0.06ab 1.31 ± 0.05c TG F = 1.92 NS 0.93 ± 0.10– 0.70 ± 0.05– 0.95 ± 0.07– 0.98 ± 0.12– C χ2= 9.57 * 0.73 ± 0.02a 0.61 ± 0.02ab 0.96 ± 0.06a 0.84 ± 0.12b
TGS F = 7.47 ** 1.45 ± 0.11a 0.85 ± 0.10a 1.60 ± 0.20a 1.66 ± 0.07b Leaves χ2= 9.57 * 3.65 ± 0.35a 3.85 ± 0.26ab 5.63 ± 0.44a 4.49 ± 0.11b
Calcium g kg−1
OG F = 0.47 NS 8.82 ± 1.12– 9.62 ± 1.92– 10.77 ± 1.48– 7.93 ± 2.22– SG F = 14.94 *** 7.23 ± 0.27a 6.27 ± 0.28a 10.10 ± 0.68b 6.13 ± 0.53a TG χ2= 5.74 NS 6.37 ± 0.67– 5.85 ± 0.72– 7.27 ± 1.05– 4.78 ± 0.52–
C F = 8.68 ** 5.53 ± 0.24a 5.08 ± 0.43a 7.75 ± 0.83b 4.36 ± 0.19a TGS F = 9.36 *** 11.12 ± 1.10a 5.70 ± 0.75ab 13.08 ± 1.15a 9.18 ± 1.15b Leaves F = 20.14 *** 18.15 ± 1.46a 15.82 ± 0.69a 27.72 ± 1.52b 19.80 ± 0.59a
Potassium g kg−1 OG χ2= 16.65 *** 14.16 ± 1.34a 4.95 ± 0.56b 5.77 ± 0.29c 10.19 ± 0.37c SG F = 45.52 *** 14.82 ± 0.69a 6.42 ± 0.52b 6.4 ± 0.64c 10.53 ± 0.49c TG F = 31.37 *** 12.28 ± 0.78a 5.83 ± 0.77b 4.18 ± 0.41c 9.64 ± 0.56c C F = 32.73 *** 7.27 ± 0.76a 4.09 ± 0.28b 3.63 ± 0.42c 10.88 ± 0.72c TGS F = 15.08 *** 9.9 ± 0.83a 5.23 ± 0.85a 4.73 ± 0.23b 11.95 ± 1.35b Leaves χ2= 15.77 ** 18.21 ± 2.77a 6.89 ± 0.25b 9.57 ± 2.32c 10.35 ± 0.49c Cellulose g kg−1 OG χ2= 7.70 * 311.80 ± 14.13a 379.96 ± 23.34b 362.32 ± 6.78b 357.69 ± 6.89b SG F = 6.99 ** 330.99 ± 5.67a 345.28 ± 6.85b 372.33 ± 13.48b 379.12 ± 5.69ab TG F = 3.22 NS 344.43 ± 8.55– 377.28 ± 19.55– 406.72 ± 17.01– 379.12 ± 5.69– C F = 2.45 NS 376.82 ± 4– 367.08 ± 3.49– 392.84 ± 12.05– 378.93 ± 3.23– TGS F = 5.09 * 312.35 ± 16.44a 393.08 ± 17.79ab 382.36 ± 19.83b 338.44 ± 19.83b Leaves F = 23.86 *** 155.19 ± 10.22a 226.62 ± 5.41a 164.63 ± 1.58a 172.49 ± 5.97b
Phosphorus g kg−1 OG F = 10.46 *** 1.44 ± 0.13a 0.73 ± 0.05b 1.07 ± 0.11ab 0.84 ± 0.06b SG F = 5.79 ** 1.57 ± 0.13a 0.99 ± 0.03b 1.30 ± 0.15ab 1.04 ± 0.07b TG F = 2.37 NS 1.26 ± 0.09– 1.06 ± 0.16– 0.79 ± .012– 1.09 ± 0.11– C F = 1.95 NS 0.98 ± 0.16– 0.7 ± 0.08– 0.76 ± 0.12– 1.13 ± 0.17– TGS χ2= 14.46 ** 1.36 ± 0.04a 0.74 ± 0.10a 0.79 ± 0.07b 1.28 ± 0.09b Leaves F = 35.19 *** 2.28 ± 0.12a 1.25 ± 0.02b 1.19 ± 0.05b 1.31 ± 0.10b Proteins g kg−1 OG χ2= 16.06 *** 112.04 ± 4.72a 72.18 ± 3.90b 81.11 ± 3.93c 56.54 ± 2.61c SG F = 12.78 *** 104.41 ± 5.43a 79.62 ± 3.81b 85.89 ± 5.22C 65.55 ± 3.16bc TG F = 6.11 ** 85.33 ± 6.23a 67.64 ± 4.18b 58.80 ± 2.86b 61.1 ± 5.45b C F = 3.56 * 64.13 ± 4.02a 49.54 ± 2.06ab 55.08 ± 2.73ab 55.92 ± 3.56b TGS F = 4.51 * 76.21 ± 4.82a 57.66 ± 5.24ab 55.75 ± 1.66b 63.09 ± 4.68b Leaves F = 23.01 *** 141.07 ± 11.02a 98.44 ± 3.18bc 73.8 ± 0.87b 89.65 ± 3.37c
Digestibility
OG F = 16.46 *** 61.02 ± 1.81a 52.6 ± 0.81b 53.28 ± 0.69b 51 ± 0.62b SG χ2= 15.07 *** 58.48 ± 0.72a 54.20 ± 0.80b 53.74 ± 0.79c 50.76 ± 0.31c
TG χ2= 7.41 * 54.88 ± 1.39a 52 ± 1.14ab 50.46 ± 0.06b 50.78 ± 0.45ab
C χ2= 13.02 ** 51.22 ± 0.41a 50a 50.40 ± 0.03a 50.46 ± 0.11b
TGS χ2= 12.53 ** 57.90 ± 2.09a 50.40 ± 0.40ab 51.72 ± 0.81bc 53.16 ± 1.13c Leaves χ2= 18.48 *** 72.20 ± 1.01a 69b 78.30c 68.54 ± 0.02d HFU OG F = 14.61 *** 0.64 ± 0.02a 0.53 ± 0.01b 0.53 ± 0.01b 0.51 ± 0.008b SG F = 19.61 *** 0.61 ± 0.008a 0.55 ± 0.009b 0.54 ± 0.01b 0.51 ± 0.004b TG F = 5.62 ** 0.52 ± 0.006a 0.53 ± 0.01b 0.50 ± 0.007b 0.51 ± 0.006b
C χ2= 14.64 ** 0.52 ± 0.006a 0.51a 0.48 ± 0.004b 0.51 ± 0.002a
TGS F = 5.98 ** 0.6 ± 0.02a 0.51 ± 0.003b 0.53 ± 0.01b 0.54 ± 0.01b
shrubs. Our results highlight the importance of shrubs in providing winter food for the herd (Dutoit and Alard, 1997) and in diversifying its bolus during this season. Thus, the persistence of the full mosaic of patches identified would appear to guarantee the animals a balanced diet throughout the year.
4.3. Implications for management of the vegetation of the embankment
Between 2014 and 2018, the extensive horse grazing applied at our study site had a mainly positive impact on the most open grassland patches. This positive impact included an increase in the species-richness and the heterogeneity of the surface vegetation and a greater number of viable seeds in the seed bank. The reduction in the mean height of the vegetation via the reduction in B. phoenicoides cover also boosted forage value due to the appearance of annual species con-sidered as good forage (Trifolium spp., Vicia spp.). However, our results indicate the need to maintain the diversity of these patches of vegeta-tion so as to ensure a balanced diet for the horses year-round.
In contrast, little or no impact from grazing was found on the tall grasslands and the shrub thickets, where only the leaves are consumed (no debarking). This rate of consumption was thus insufficient to have a significant impact on shrub encroachment on our site (Rotherham, 2013). It has already been demonstrated that alternating park grazing systems might increase the animals’ impact on the vegetation and the sustainability of grasslands, subject to good management with optimum control of the herd according to the objectives targeted (Manning et al., 2017). While the traditional approaches used have produced results at local level, it is difficult to extend this to large-scale geographical areas (Duro, Coops, Wulder, & Han, 2007). At our study site, grazing pressure seems to be slightly increased. Combining several herbivorous species could also be attempted, given the potential of different breeds to ex-ploit heterogeneous environments (Edwards & Hollis, 1982;Henning et al., 2017). Goats for example, which consume woody plant species, could be mixed with a herd of horses to reduce the surface area of shrub dotted patches and thickets, poor in species, thus ensuring greater availability of light within the plant communities (Kotowski & van Diggelen, 2004; Moinardeau et al., 2019). Mixed grazing using
ruminant and non-ruminant species such as cattle, horses, sheep or donkeys is known to be an appropriate management tool (Süss & Schwabe, 2007;Henning et al., 2017).
Declaration of Competing Interest
The authors declare they have no conflict of interest. Acknowledgments
This work was supported by the Compagnie Nationale du Rhône (CNR), the owner of the site and the Office National de la Chasse et de la Faune Sauvage (ONCFS), the site manager. We also thank SFR Tersys for the grant awarded in 2014. Our thanks to Romain Brusson (CNR) and to Denis Roux (ONCFS) for facilitating access to the sites. We gratefully acknowledge the technical assistance with botanical inventories and grazing surveys received from Daniel Pavon, Chloé Malik, Bastien Tresse, Julie Chenot, Anne Aurière, Christel Vidaller, Arthur Rocher, Anouk Courtial, Bruna Romanini. We thank Marjorie Sweetko for English language revision.
This research did not receive any specific grant from funding agencies in the public, commercial, or not-for-profit sectors.
References
Bakker, J. P., Poschlod, P., Strykstra, R. J., Bekker, R. M., & Thompson, K. (1996). Seed banks and seed dispersal: Important topics in restoration ecology§. Acta Botanica Neerlandica, 45(4), 461–490.https://doi.org/10.1111/j.1438-8677.1996.tb00806.x. Benjamini, Y., & Hochberg, Y. (1995). Controlling the false discovery rate: A practical and powerful approach to multiple testing. Journal of the Royal Statistical Society, 57(1), 289–300.
Borcard, D., Gillet, F., & Legendre, P. (2011). Numerical ecology with R. New York: Springerhttps://doi.org/10.1007/978-1-4419-7976-6.
Carboni, M., Dengler, J., Mantilla-Contreras, J., Venn, S., & Török, P. (2015). Conservation value, management and restoration of Europe’s semi‑natural open landscapes. Hacquetia, 14(1),https://doi.org/10.1515/hacq-2015-0017. Chessel, D., Dufour, A. B., & Thioulouse, J. (2004). The ade4 package - I: One-table
methods. R News, 4(1), 5–10.
Cosyns, E., Degezelle, T., Demeulenaere, E., & Hoffmann, M. (2001). Feeding ecology of Konik horses and donkeys in Belgian coastal dunes and its implications for nature management. Belgian Journal of Zoology, 131, 111–118.
Cousens, R., Dytham, C., & Law, R. (2008). Dispersal in plants: A population perspective. OUP Oxford.
Crawley, M. J. (1983). Herbivory: The dynamics of animal-plant interactions. Blackwell Scientific.
Dray, S., & Dufour, A. B. (2007). The ade4 Package: Implementing the Duality Diagram for Ecologists. Journal of Statistical Software, 22(4),https://doi.org/10.18637/jss. v022.i04.
Duncan, P. (1992). Horses and grasses: The nutritional ecology of equids and their impact on the camargue. Springer Science & Business Media.
Duro, D. C., Coops, N. C., Wulder, M. A., & Han, T. (2007). Development of a large area biodiversity monitoring system driven by remote sensing. Progress in Physical Geography, 31(3), 235–260.
Edwards, P. J., & Hollis, S. (1982). The distribution of excreta on new forest grassland used by cattle, ponies and deer. The Journal of Applied Ecology, 19, 953–964. Ellis, E. C., Klein Goldewijk, K., Siebert, S., Lightman, D., & Ramankutty, N. (2010).
Anthropogenic transformation of the biomes, 1700 to 2000: Anthropogenic trans-formation of the biomes. Global Ecology and Biogeography.https://doi.org/10.1111/j. 1466-8238.2010.00540.xno-no.
Gilhaus, K., & Hölzel, N. (2016). Seasonal variations of fodder quality and availability as constraints for stocking rates in year-round grazing schemes. Agriculture, Ecosystems & Environment, 234, 5–15.https://doi.org/10.1016/j.agee.2016.03.013.
Guinochet, M. (1973). Phytosociologie. Masson.
Harris, J. A., Hobbs, R. J., Higgs, E., & Aronson, J. (2006). Ecological restoration and global climate change. Restoration Ecology, 14(2), 170–176.https://doi.org/10.1111/ j.1526-100X.2006.00136.x.
Henneberg, W., & Stohmann, F. (1864). Begriindung einer rationellen Fiitterung der Wiederkäuer, Vol. II. Schwetsehtke u. Sohn.
Henning, K., Lorenz, A., von Oheimb, G., Härdtle, W., & Tischew, S. (2017). Year-round cattle and horse grazing supports the restoration of abandoned, dry sandy grassland and heathland communities by supressing Calamagrostis epigejos and enhancing species richness. Journal for Nature Conservation, 40, 120–130.https://doi.org/10. 1016/j.jnc.2017.10.009.
Jarrige, R. (1988). Alimentation Des Bovins, Ovins & Caprins. Inra-Quae.
Jensen, K., Trepel, M., Merritt, D., & Rosenthal, G. (2006). Restoration ecology of river valleys. Basic and Applied Ecology, 7(5), 383–387.https://doi.org/10.1016/j.baae. 2006.05.008.
Kjeldahl, J. (1883). Neue Methode zur Bestimmung des Stickstoffs in organischen
Fig. 8. Matrix of correlations between measured values (Mg, Ca, P, proteins, K, cellulose, digestibility), species richness, the presence of Brachypodium phoeni-coides and annual species in the vegetation surveys conducted in the spring of 2017 on the study site. Correlation coefficients are shown as percentages. Non-significant correlations are crossed out.
Körpern. Z. Anal. Chem. 22, 366–382.
Köhler, M., Hiller, G., & Tischew, S. (2016). Year-round horse grazing supports typical vascular plant species, orchids and rare bird communities in a dry calcareous grassland. Agriculture, Ecosystems & Environment, 234, 48–57.https://doi.org/10. 1016/j.agee.2016.03.020.
Kotowski, W., & van Diggelen, R. (2004). Light as an environmentalfilter in fen vege-tation. Journal of Vegetation Science, 15(5), 583. https://doi.org/10.1658/1100-9233(2004)015[0583:LAAEFI]2.0.CO;2.
Lamoot, I., Meert, C., & Hoffmann, M. (2005). Habitat use of ponies and cattle foraging together in a coastal dune area. Biological Conservation, 122, 523–526.
Lindenmayer, D. B., Fischer, J., Felton, A., Crane, M., Michael, D., Macgregor, C., et al. (2008). Novel ecosystems resulting from landscape transformation create dilemmas for modern conservation practice: Novel ecosystems and conservation practice. Conservation Letters, 1(3), 129–135.https://doi.org/10.1111/j.1755-263X.2008. 00021.x.
Loucougaray, G., Bonis, A., & Bouzillé, J.-B. (2004). Effects of grazing by horses and/or cattle on the diversity of coastal grasslands in western France. Biological Conservation, 116(1), 59–71.https://doi.org/10.1016/S0006-3207(03)00177-0.
Mamarot, J. (2002). Mauvaises herbes des cultures. Acta.
Manning, J., Cronin, G., González, L., Hall, E., Merchant, A., & Ingram, L. (2017). The behavioural responses of beef cattle (Bos taurus) to declining pasture availability and the use of GNSS technology to determine grazing preference. Agriculture, 7(6), 45. https://doi.org/10.3390/agriculture7050045.
Marage, D., Rameau, J.-C., & Garraud, L. (2006). Banque de graines du sol et succession végétale dans les Alpes du Sud : effets des facteurs historiques et écologiques. Canadian Journal of Botany, 84(1), 99–111.https://doi.org/10.1139/b05-142. McNaughton, S. J. (1984). Grazing lawns: Animals in herds, plant form and co-evolution.
The American Naturalist, 124, 863–886.
Meissner, R. A., & Facelli, J. M. (1999). Effects of sheep exclusion on the soil seed bank and annual vegetation in chenopod shrublands of South Australia. Journal of Arid Environments, 42(2), 117–128.https://doi.org/10.1006/jare.1999.0515. Ménard, C., Duncan, P., Fleurance, G., Georges, J. Y., & Lila, M. (2002). Comparative
foraging and nutrition of horses and cattle in European wetlands. The Journal of Applied Ecology, 39, 120–133.
Milberg, P. (1992). Seed bank in a 35-year-old experiment with different treatments of a semi-natural grassland. Acta Oecologia, 13(6), 743–752.
Moinardeau, C., Mesléard, F., & Dutoit, T. (2016). Using different grazing practices for increasing plant biodiversity in the Dykes and embankments along the Rhône River (Southern France). Environmental Management, 58(6), 984–997.https://doi.org/10. 1007/s00267-016-0744-9.
Moinardeau, C., Mesléard, F., Ramone, H., & Dutoit, T. (2019). Short-term effects on diversity and biomass on grasslands from artificial dykes under grazing and mowing treatments. Environmental Conservation, 46(2), 132–139.https://doi.org/10.1017/ S0376892918000346.
Mueller-Dombois, D., & Ellenberg, H. (1974). Aims and methods of vegetation ecology. Wiley.
Muller, F. M. (1978). Seedlings of the noth-western european lowland. Springer Science & Business Media.
Murcia, C., Aronson, J., Kattan, G. H., Moreno-Mateos, D., Dixon, K., & Simberloff, D. (2014). A critique of the‘novel ecosystem’ concept. Trends in Ecology & Evolution, 29(10), 548–553.https://doi.org/10.1016/j.tree.2014.07.006.
Ringmark, S., Skarin, A., & Jansson, A. (2019). Impact of year-round grazing by horses on pasture nutrient dynamics and the correlation with pasture nutrient content and fecal nutrient composition. Animals, 9(8), 500.https://doi.org/10.3390/ani9080500. Root, T. L., & Schneider, S. H. (2006). Conservation and climate change: The challenges
ahead. Conservation Biology Journal Society Conservation Biology, 20, 706–708. Rotherham, I. D. (2013). Trees, forested landscapes and grazing animals: A European
per-spective on woodlands and grazed treescapes. Routledgehttps://doi.org/10.4324/ 9780203102909.
Roux, J. P., Noble, V., Barcelli, M., & Roux, D. (2012). Atlas de laflore de la réserve de chasse et de faune sauvage de Donzère-Mondragon (partie vauclusienne). Office National de la Chasse et de la Faune Sauvage/Conservatoire Botanique National
Méditerranéen de Porquerolles.
Saatkamp, A., Henry, F., & Dutoit, T. (2017). Vegetation and soil seed bank in a 23-year grazing exclusion chronosequence in a Mediterranean dry grassland. Plant Biosystems - an International Journal Dealing With All Aspects of Plant Biology, 152(5), 1020–1030. https://doi.org/10.1080/11263504.2017.1407375.
Selmi, H., Ben Gara, A., Rekik, B., & Rouissi, H. (2011). Effect of the concentrate feed on in vitro. Gas production and methane in sicilo-sarde sheep. American-Eurasian Journal of Agricultural & Environment Science, 10(3), 346–350.
Süss, K., & Schwabe, A. (2007). Sheep versus donkey grazing or mixed treatment: results from a 4-yearfield experiment in Armerio-Festucetum trachyphyllae sand vegetation. Phytocoenologia, 37(1), 135–160. https://doi.org/10.1127/0340-269X/2007/0037-0135.
ter Heerdt, G. N. J., Verweij, G. L., Bekker, R. M., & Bakker, J. P. (1996). An improved method for seed-bank analysis: Seedling emergence after removing the soil by sieving. Functional Ecology, 10(1), 144–151.
Thompson, K., & Grime, J. P. (1979). Seasonal variation in the seed banks of herbaceous species in ten contrasting habitats. The Journal of Ecology, 67(3), 893.https://doi. org/10.2307/2259220.
Tison, J.-M., Jauzein, P., & Michaud, H. (2014). Flore de la France méditerranéenne con-tinentale. Naturalia Publications.
Valkó, O., Venn, S.,Żmihorski, M., Biurrun, I., Labadessa, R., & Loos, J. (2018). The challenge of abandonment for the sustainable management of Palaearctic natural and semi-natural grasslands. Hacquetia, 17(1), 5–16. https://doi.org/10.1515/hacq-2017-0018.
Vulink, J. T., Drost, H. J., & Jans, L. (2000). The influence of different grazing regimes on Phragmites-shrub vegetation in the well-drained zone of a eutrophic wetland. Applied Vegetation Science, 2, 73–80.
Wallis De Vries, M. F., Bakker, J. P., Bakker, J. P., & Wieren, S. E. (1998). Grazing and conservation management. Springer Science & Business Media.