HAL Id: tel-01139846
https://hal.archives-ouvertes.fr/tel-01139846
Submitted on 7 Apr 2015
HAL is a multi-disciplinary open access
archive for the deposit and dissemination of
sci-entific research documents, whether they are
pub-lished or not. The documents may come from
teaching and research institutions in France or
abroad, or from public or private research centers.
L’archive ouverte pluridisciplinaire HAL, est
destinée au dépôt et à la diffusion de documents
scientifiques de niveau recherche, publiés ou non,
émanant des établissements d’enseignement et de
recherche français ou étrangers, des laboratoires
publics ou privés.
Viscosity: an architect for the respiratory system?
Benjamin Mauroy
To cite this version:
Benjamin Mauroy. Viscosity: an architect for the respiratory system?. Biological Physics
[physics.bio-ph]. Université de Nice-Sophia Antipolis, 2014. �tel-01139846�
UNIVERSIT ´
E DE NICE-SOPHIA ANTIPOLIS
Dossier de candidature pour
l’Habilitation `
a Diriger des Recherches
La viscosit´
e:
un architecte pour le syst`
eme respiratoire ?
Viscosity:
an architect for the respiratory system?
Benjamin Mauroy
Laboratoire J.A. Dieudonn´
e, UMR CNRS 7351,
Parc Valrose,
06108 Nice cedex 2, France.
HDR soutenue le 15 d´
ecembre 2014.
Rapporteurs
Emmanuel Grenier
Professeur, ENS Lyon
Daniel Isabey
DR CNRS, UPEC
Merryn Tawhai
Professeur, Universit´
e d’Auckland
Membres du jury
M´
ed´
eric Argentina
Professeur, UNS
Examinateur
Philippe Dantan
IR HDR, Univ. Paris Diderot
Invit´
e
St´
ephane Descombes
Professeur, UNS
Examinateur
St´
ephane Douady
DR CNRS, Univ. Paris Diderot
Examinateur
Patrice Flaud
Professeur, Univ. Paris Diderot
Invit´
e
Jos´
e-Maria Fullana
Professeur, UPMC
Examinateur
C´
eline Grandmont
DR INRIA, INRIA Rocquencourt
Pr´
esidente
Emmanuel Grenier
Professeur, ENS Lyon
Rapporteur
The most exciting phrase to hear in science,
the one that heralds the most discoveries,
is not ”Eureka!” (I found it!) but ”That’s funny...”
Table of contents
Acknowledgements 7 1 Introduction 9 1.1 Disclaimer . . . 9 1.2 Running away . . . 9 1.3 A short bibliography . . . 10 1.4 Manuscript structure . . . 112 A brief summary of the concepts and theories involved in my research 13 2.1 Oxygen in the respiratory system . . . 13
2.2 The importance of being viscous . . . 15
2.3 Evolution. . . 16
2.4 The trouble with costs functions. . . 19
2.5 Modeling . . . 20
2.6 Where are we going from here? . . . 21
3 Tree structures selection by evolution. 23 3.1 Minimizing dissipation in a tree, stability. . . 23
3.2 Stability of the tree as an optimal geometry structure. . . 24
3.3 Structure of the optimal tree. . . 25
3.4 Conclusion. . . 25
3.5 Historical background. . . 25
4 Development of the tracheobronchial tree. 27 4.1 Modeling of the development of the tracheobronchial tree. . . 27
4.2 Emergence of core properties of the tracheobronchial tree . . . 28
4.3 Conclusion. . . 31
4.4 Historical background. . . 32
5 Robustness and natural selection : cliff-edge theory 35 5.1 Cliff-edge theory . . . 35
5.2 Cliff-edge theory . . . 36
5.3 Application to the tracheobronchial tree. . . 37
5.4 Historical background . . . 38
6 Medical applications 41 6.1 Role of the tree reduction factor on pathologic bronchi remodeling . . . 41
6.2 Modeling chest physiotherapy . . . 42
6.2.1 Rigid airways [61] . . . 43
6.2.2 Deformable airways [64] . . . 44
6.3 Abstracts . . . 45
6 TABLE OF CONTENTS
7 Blood arterial network 47
7.1 Blood flows in straws . . . 47
7.2 Minimal cost for the arterial network: hypotheses . . . 49
7.3 Murray’s law extension to shear thinning/thickening fluids[66] . . . 50
7.4 Optimizing hematocrit and geometry for the optimal feed of an organ [71] . . . 51
7.5 Historical background . . . 52
8 Air/blood exchange surface 55 8.1 The camera method . . . 57
8.2 Minimal cost in capillaries . . . 58
8.3 Oxygen capture by red blood cells . . . 58
8.4 Historical background . . . 59
9 Conclusion. 63 Lexicon 65 10 R´esum´e en franc¸ais 67 10.1 Introduction . . . 67
10.1.1 Disclaimer . . . 67
10.1.2 Courage, fuyons ! . . . 67
10.1.3 Une courte bibliographie . . . 68
10.1.4 Structure du manuscrit . . . 69
10.2 Le syst`eme respiratoire . . . 70
10.3 L’arbre trach´eobronchique . . . 72
10.3.1 G´eom´etrie arborescente optimale. . . 72
10.3.2 D´eveloppement de l’arbre trach´eobronchique. . . 74
10.3.3 Robustesse et s´election naturelle : la th´eorie du cliff-edge. . . . 75
10.3.4 Applications m´edicales . . . 76
10.4 Le r´eseau art´eriel. . . 78
10.5 La surface d’´echange air/sang . . . 79
Acknowledgements
I was told that acknowledgements were the section the most read in HDR manuscript. This put really a lot of pressure on my shoulders...
I would like first to warmly thank my reviewers. Thank you Merryn for having agreed to review my manuscript, I am looking forward to come to Auckland and to visit your lab! Thank you Emmanuel and Daniel for the time you will lose because of me.
Big thanks also to all the members of my jury to have accepted to come to Nice to spend the afternoon in the conference room (which is in the basement).
Of course, many thanks to all my collaborators and students, all this work has been possible only because of you.
I would like to thank Philippe for teaching me how to look grumpy so people leave you alone. I am still learning the theory though. And thank you Philippe for everything else, there are so many reasons to thank you I cannot list them here. I would like to thank Patrice also, he has always been here to support me in my struggling into research and he was always available. He has also taught me that being late was not so serious, after all.
Annemiek, St´ephane and baby Anand: thank you for being so nice, so smart and so fun. I would like to thank Plamen for telling me that true Bulgarian yoghourt has nothing in com-mon with our Bulgarian yoghourt, Rapha¨el for all the interesting facts you taught me (especially the one about the seed on the ear), and Baptiste for his patience with me as an advisor, and for teaching me that the latex minus sign has a weird size when it is in a exponent.
Thanks to Thierry, Philippe and St´ephane for your support and advices in setting up my HDR application, and to Magali and Didier for asking me regularly where I was in my writing.
Also, a specific thank to every person I have forgotten to cite here.
Thank you Julie, B´ea and baby Simon for visiting us tomorrow, so I have to finish my manuscript once and for all.
A very huge thanks to my parents and my two sisters who were supportive from the beginning and always enthusiastic to listen to me speaking, sometimes grumbling, often babbling about my work.
Finally, thank you so much M´elo for all you are in my life, you give me everyday the spark that makes life so interesting. Thank you for the help you gave me writing my manuscript. And thank you Eliott for being there, with your unending list of questions and for inevitably asking me to watch tramouettes and/or trains whenever my laptop is in sight.
Chapter 1
Introduction
1.1
Disclaimer
I see my job as an applied mathematician as using mathematics as a tool for the study of the surrounding world, biology for me. Thus my primary objectives are to give some answers to questions related to biology and not to study related mathematical aspects. So my research aims at explaining the respiratory system functioning and its evolution, and you will not find theorems in the usual form in this manuscript1, even though many a result could have been written in a such way. However, I think the usual presentation of mathematical results is not an easy journey for readers from other disciplines, thus I chose to present them in a more ”story telling” way. Of course, all this is a personal choice that can be discussed again and again, and I hope no one will be offended. Also, I am fully aware there are many ways to do applied mathematics, and all of them have their role to play in an equal way.
I wanted this manuscript to be personal and to describe the mood in which I do my work as a scientist... well, in the good days at least. So I tried to use this manuscript as a way to ban for a while the usual, though most often essential, sternness of scientific papers.
1.2
Running away
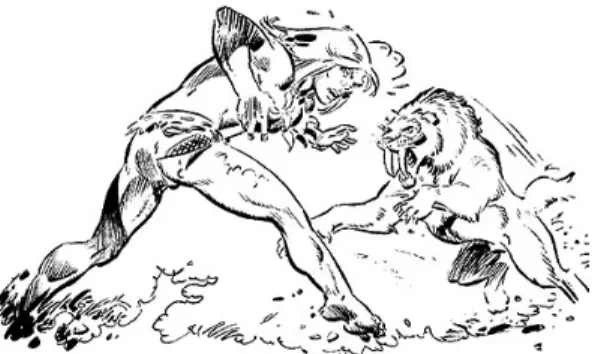
Figure 1.1: Rahan chased by a saber-tooth tiger, probably to the disappointment of the tiger (Rahan is a french comic book, the first episode was published in 1973 by Hachette edition).
When I think about human evolution, I often get the picture of a guy running away from some angry hungry predator, not unlike a saber-tooth tiger2. I was probably unconsciously inspired by
1Actually there are a few, can you find them?
2In fact, saber-tooth tiger (Smilodon) might not have been so much in chasing prey for a long time but more
in jumping from nowhere, give a death blow and wait [37, 67].
10 1.3. A SHORT BIBLIOGRAPHY the french comic character Rahan (see figure 1.1). Then the same question always pops up: will this guy escape the tiger? I have no worries for Rahan himself though, since more than a dozen episodes follow the first one. Anyway, apart from Rahan, I guess tigers are better runners that humans, so this is probably a rhetorical question if the guy is alone. But if he is not, then the tiger will be satisfied with one prey and this is were natural selection in human begins.
The success of the escape depends on many factors of course, but one of them will interest us more particularly: will the respiratory system be able to put up with the extra supply in oxygen needed by muscles and organs? Everything else being equal, if your respiratory system is a bit more efficient than the one of, say, Rahan3, then you might have better chance to escape, and
thus globally improve your success as an organism in a dangerous environment. Consequently, the efficiency of the respiratory system can be crucial for survival.
Of course the selection we speak about occurs in exercise regime, and the race with the tiger hints why the ability to undergo an exercise regime may have been selected by evolution. But it is not clear whether this means that all selection has occurred in that close-to-the-physiological-limits regime4. Of course, there may have been other activities in rest regime with less permanent fate, which affected human evolution and respiratory system in particular. To be able to supply basal metabolism with oxygen in an efficient way allows to spare energy for other means, such as reproduction.
An important feature of the respiratory system is that it uses fluids to transport oxygen: air in the lung and blood in the blood network. The circulation of air and blood has an energetic cost due to the physical property called viscosity, which is related to the friction inside the fluid. This energetic cost is the core of my work and I ask the question on how it may have influenced the evolution of the respiratory system.
1.3
A short bibliography
To my disappointment, I am not the first to study the role of viscosity on transport network efficiency. I give here a small, not exhaustive, bibliography of some of the literature I encountered in my work.
In 1926, Murray proposed the first law5 for the optimal design of blood vessels, based on a
trade-off between the power needed to make blood circulate in the vessel and the metabolic power needed to maintain blood. The law is formulated using Poiseuille’s regime in cylindrical vessels, and the optimal configuration corresponds to the blood flow rate being proportional to the cube power of the radius of the blood vessel. The well known corollary for a bifurcation states that the cube radius of the parent vessel equals the sum of the cube radii of the daughter vessels [74]. In the seventies, Zamir extended this law to account for bifurcation angles [114] and expressed Murray’s law in term of wall shear stress being constant independently on the vessel size [115]. While blood arterial macrocirculation checks Murray’s law, this is not the case for microcirculation, where wall shear stress is decreasing with the sizes of the vessels. Different hypotheses were developed to explain the shifts to Murray’s law observed with microcirculation, for example by adding smooth muscles energy costs [98]. In 2005, Alarc´on et al [2] used semi-empirical laws from Pries et al [82] and showed that wall shear stress behavior in microcirculation can be explained by phase separation effects in small blood vessels. Phase separation effects make blood viscosity become a non monotonous function of vessel radius: the F˚ahræus - Lindvquist effect [32, 33, 82, 83].
Similar researches about the lung were more recent [43, 93], in particular with the work of E.R. Weibel [107, 108] and B.J. West [110]. The links between the physics in the lung, its geometry and its efficiency were studied by the team with B. Sapoval and E.R. Weibel [25, 28, 29, 30, 57, 62, 63, 90]. A few other groups are also working on this topic, see for example [46, 51, 52]. Some interesting developments about fluid dynamics theory in lung models were performed by mathematicians and most particularly B. Maury and C. Grandmont [4, 39, 56, 96]. Studies on ventilation in
3You are probably an athlete and will participate to the next olympic games. 4See conclusion of section 8.3 for an example of close-to-the-physiological-limits. 5Actually, he developed the pioneer work of Hess [41].
1.4. MANUSCRIPT STRUCTURE 11 anatomical lung models brought important insights on structure-function relationships [42, 48, 55], in particular the work of the team of M. Tawhai [100, 101, 102, 103].
Thus, the initial formulation of the cost by Murray has been extensively used and improved. It gave rise to general theories about biological networks design [7, 8, 36, 111, 112]. For example West and his colleagues propose scenarios based on fluid viscous dissipation that ought to explain allometric laws found in mammals6[111] or in plants [112]. Other more controversial theories have
also emerged such as the optimal design theory [7].
1.4
Manuscript structure
I will start scientific work in chapter 2 by describing the concepts needed to understand the problems I intend to study. Then in chapter 3, I will explain what are the conditions for evolution to be able to select a tree structure under the hypothesis that evolution is driven by viscous costs. In chapter 4, I propose to discuss lung development and try to understand how evolution may have effectively selected some tracheobronchial tree features. Biological structures development is often submitted to a noise, as shown by our scenario from chapter 4, thus I propose in chapter 5, to study how evolution may account for this noise in the selection of an optimal strategy, with tracheobronchial tree as an application. In chapter 6, I want you to see that such fundamental work can find some practical application in the medical world. In that chapter I present two applications, one mostly about chronic obstructive pulmonary disease (COPD) diagnostic and the second about chest physiotherapy. The following chapters are dedicated to blood network efficiency relatively to its viscous dissipation. Chapter 7 develops how features of the mid level arterial network such as its fractal nature and the red blood cells concentration in blood can be deduced from an energetic cost involving viscosity. Finally, in chapter 8, we make the same study as in the previous chapter, but for capillaries where the physical phenomena are different. We show that even though the red blood cells concentration in capillaries is smaller than in large circulation, it remains optimal for a cost which is the same as in large circulation, except that it accounts for a different physics in the capillaries. In this chapter, we also studied some problems related to oxygen transfer toward the red blood cells. Chapter 9 concludes this manuscript.
The one before last chapter is a lexicon that describes a few of the technical terms used in the text. It is not really intended to be read, but only to be referred to if needed. The last chapter, chapter 10, is a summary of this manuscript in french with an integral translation of the introduction and of the conclusion.
All these studies without exception are based on mathematical and/or numerical tools applied to respiratory system modeling. These tools are based on partial differential equations theory, optimization theory, dynamical systems, population dynamics, numerical analysis or scientific computation. These tools are sometimes based on the literature and sometimes specifically devel-oped for the problem studied. Thus most of the chapter begin by a description of the models and tools used for the problem studied in the chapter. Each chapter ends with a description of the collaborations and with the abstracts of the papers (published, in preprint or in preparation) on the chapter topic.
6Amazing power-law relationships between a physiological quantity and the mass (or size) of an animal. Typical
Chapter 2
A brief summary of the concepts
and theories involved in my
research
2.1
Oxygen in the respiratory system
”I rarely use oxygen myself, sir. It promotes rust.”, Robby the robot, in the movie Forbidden Planet (MGM, 1956).
If you were a cell, you would use ATP1 molecules as a source of energy. You would have two
ways to produce and store ATP: the anaerobic and aerobic pathways. The anaerobic pathway, well named glycolysis, produces lactates, water and two ATP for each glucose molecule it can get a hand on. Good enough... Except that lactates actually still contain a lot of energy and alter blood pH, which is not good. In contrast, the aerobic pathway uses an oxidation process in the mitochondria that is able to produce thirty-six molecules of ATP from one molecule of glucose! Pretty efficient... Also its waste products are water and carbon dioxide: these are easily dealt with in the organism [107].
If you are a sensible, well educated cell, you will want to use the aerobic pathway as much as possible ... and you may even ask why bother with the anaerobic pathway? Any passing by athlete would then explain that the major drawback of the aerobic pathway is that it definitely needs oxygen, and oxygen you may lack... In which case you would then be happy to fall back on anaerobic pathway to go on with whatever energy demanding task you were performing. Moreover, some simple cells, like red blood cells, are outrageously stuck with just the anaerobic pathway.
So you will want to use oxygen, but oxygen is a resource that is present in ambient air and ambient air is obviously outside the body (luckily for us living beings, because there are many other not so friendly things in air that we want to keep at bay2). So to make things work smoothly,
we have a built-in organ whose task, among others, is to remove oxygen from air and to bring it to our cells: the respiratory system. Fortunately for us respiratory system researchers, this organ is not simple and it is quite a job to study its many aspects. The organ divides into sub-organs with different physiologies involving different physical laws, making the system look like a mess to the padawan3. But these different parts fit nicely together and are finely tuned in such a way that the organ is quite efficient.
Oxygen quietly resides in the ambient air, until some passing by, absent-minded mammal in-spires. Then an amount of air, with its oxygen molecules inhabitants, is sucked into the mammal lung. Then oxygen discovers that the lung is a tree structure with a trunk (the trachea) which
1it develops into the comely adenosine triphosphate 2pollutants, bacteria, viruses, Justin Bieber’s music, etc.
3if you really need it: Jedi’s apprentice in Star Wars movies (really?!)
14 2.1. OXYGEN IN THE RESPIRATORY SYSTEM divides into two smaller airways, and that each of these airways divide again into two smaller airways and so on. These divisions go on for about twenty-two times. Airways which accounts for the same number of bifurcations from the trunk belong to the same generation. Our friendly amount of air, with its oxygen hitchhikers, travels and spreads smoothly into the lung, its speed becoming smaller and smaller as it goes deeper into the lung. When it reaches about the seven-teenth generation, the end of the well named tracheobronchial tree, its velocity has become really small: convective transport of oxygen with air is at an end. Fortunately, like the ninja, oxygen has many ways to move and one of them is diffusion. Oxygen diffuses because of the specific lung structures it is now meeting. From the seventeenth generations to the end, the airways form what is called the acini. Airways’ walls in the acini are covered with alveoli. Alveoli look like bubbles and their walls consist in capillary beds where blood flows. The whole surface formed by the alveoli walls is the exchange surface between alveolar gas („ air) and blood, it is about a hundred square meters in humans. Blood in the lungs is poorly oxygenated and, seen from the blood point of view, oxygen concentration near the acini openings looks like Eiffel Tower during a summer day. And because blood is flowing and air regularly renewed, the gradient in oxygen concentration is maintained. Since diffusion’s motor is Brownian motion, it tends to homogenize concentrations4 5and a flow of oxygen is maintained into the acinus, towards blood in alveoli walls.
Figure 2.1: Oxygen’s adventures (lung cast by E.R. Weibel, Bern). Once oxygen reaches the
alveolo-capillary membrane, it dis-solves into the membrane, dif-fuses to the plasma and go on its diffusive motion to-wards the red blood cells. Red blood cells (or erythro-cytes) are disk-shaped cells that consist in a bilipidic membrane enclosing a cytosol that is highly concentrated with hemoglobin. Red blood cells are very deformable and take the shape of a parachute whenever they enter a vessel whose diameter is on the same size order, typically a capil-lary. Red blood cells account normally for about forty per-cent of blood. Once oxygen has been captured by the red
blood cells in the pulmonary capillaries, it travels comfortably inside the red blood cells into the confluent pulmonary venous network, then through the heart left ventricle and finally it enters the arterial systemic circulation that feeds the organs. Oxygen is then unloaded by a process that is the inverse to that of its loading, it enters the cells and is mainly consumed into the mitochondria to produce ATP and thus store chemical energy. Red blood cells maintain a low inner oxygen concentration by fixing in real-time incoming oxygen molecules on its hemoglobin molecules, thus hiding them from the sagacity of diffusion. A map depicting oxygen journey is plotted on figure 2.1.
4As discussed with colleagues in front of a bruscetta: if you take two identical, connected compartments, one
with a high number of particles and one with a low number of particles, then each particle has one chance over two to reach the other compartment, which means that half the particles of each compartment will reach the other, thus homogenizing the concentrations. This does not work with olives on bruscetta.
5Restaurant choosing has the opposite behavior: most people will often chose the crowded one, even if it stands
nearby an empty one, thus unstably crowding the first one even more, ultimately reaching a Dirac distribution (probably for good gastro-intestinal reasons).
2.2. THE IMPORTANCE OF BEING VISCOUS 15
2.2
The importance of being viscous
As you may have noticed, oxygen uses moving fluids as transportation systems: it starts its jour-neys within air and ”jumps”, in a graceful diffusive motion, into blood as soon as air transportation has brought it far enough. In lung or in blood networks, the fluids are flowing inside tube-like structures that bifurcate regularly.
The thing with fluids in cylinders, or at least with those we are looking at here, is that when they are viscous, they are clinging to the walls and stop moving as soon as you stop pushing them through. For a fluid, being viscous means that it is submitted to friction and, by definition, friction opposes any relative motion by converting motion energy into heat. A consequence is that friction wants the fluid to move everywhere with the same velocity. But in a tube, there is a wall and the wall is unmoving, so the fluid near the wall will stubbornly remain unmoving, because of friction and of wall rugosity. Consequently, a viscous fluid in a tube will want to stop, unless you continue to push it through the tube tirelessly, which is lung muscles and heart are doing all days long in many animals, including mammals. Whatever the way you push the fluid inside the tube, the fluid near the wall will not move. This unmoving layer will slow down the upper layer which will in turn slow down slightly less the next layer and so on, thus creating layers of fluid which are moving at different velocities: friction lurks everywhere! And the thinner the tube, the more friction you get.
Figure 2.2: Fluid layers race: viscosity and wall rugosity make the layers near the wall slower.
Flows in straws.
Figure 2.3: Viscosity (added to gravity here) can make sip-ping through a straw a diffi-cult business (photo credit: Saul Loeb/AFP/Getty Images). Who never ordered a fancy drink and discover dreadfully it
had to be drank with a straw so thin even light has trouble to go through6? Drinking through such a straw always ends up
with people making funny faces7. Fortunately, fluid mechanics
and the work of J.L.M. Poiseuille in the nineteenth century [97] make us able to quantify the power needed to keep the fluid in motion within the straw8. This power actually compensates
viscous dissipation, i.e. the power converted to heat by fric-tion. Let us assume our drink is incompressible, isotropic and Newtonian. Incompressible means that the volume of the fluid cannot change, luckily for us. Isotropic Newtonian means that the viscous constraints τ inside the fluid are proportional to the gradients of the velocity u, τ “ µˆp∇u `t∇uq, with µ the (dy-namic) viscosity, a constant and intrinsic property of the fluid; in other words, whatever the difference in velocity between two layers of fluid, the heat dissipated is always proportional to that difference. Typical Newtonian fluids are water or air; blood is not a Newtonian fluid although it can be approximated by a
6and undoubtedly this drink is dressed up with a small colorful paper umbrella.
7I always wondered if this was some kind of private conspiracy from some bartenders secret society.
8By saying this, we neglect gravity. This is reasonable only if the straw is tight enough, in which case viscosity
effects overcome gravity effects. Typically the power needed to drink water with a straw whose diameter is smaller than 2-3 millimeters is dominated by viscous effects at normal drinking rates.
16 2.3. EVOLUTION. Newtonian fluid under certain conditions. Anyway, we will talk about blood later (who drinks blood anyway?9).
For such isotropic Newtonian incompressible fluids, the hydrodynamic resistance R of the tube relates the power we need to compensate with our jaws muscles - and the level of deformation of our jaws, see figure 2.3 - to the geometry of the straw and the viscosity µ of the fluid. If l is the straw length and r its radius, the power P needed to make a fluid flow F go through the tube can be deduced from Poiseuille’s law10 [79]:
P “ RF2
with R “ 8µl
πr4 (2.1)
The power P depends on the radius in 1{r4: a straw twice times tighter needs sixteen times the power... The conclusive philosophy is thus to never ever accept a thin straw.
From straws to oxygen transport.
What applies to straws can be extended to bronchi or blood vessels, which also belong, with some approximations11, to the happy family of cylinders. We saw earlier that making fluid go
through cylinders costs energy, the exact amount of energy depending on the cylinders’ geometry and most particularly on their radii. Lung and blood network can be seen as cascades of cylinders: oxygen transport implies an energy cost due to viscous dissipation in those structures. Interest-ingly, oxygen transport is used to bring oxygen to the cell to produce energy for the metabolism, but this transport costs energy itself: the balance between oxygen gain and oxygen cost has to be positive in order for the transport system to have any efficiency. But how can efficiency emerge? This is a difficult question and, luckily, we have the privilege to live after Charles R. Darwin [21] and Alfred R. Wallace [106] who gave us the answer in the mid nineteenth century, when they discovered evolution and natural selection.
2.3
Evolution.
”For animals, the entire universe has been neatly divided into things to (a) mate with, (b) eat, (c) run away from, and (d) rocks”, Equal Rites, Terry Pratchett. Natural selection and mutations
Evolution is the transformation along the generations of heritable characteristics in a popu-lation. Evolution is influenced by several forces [26]. We will focus most particularly on two of these forces: natural selection [21], which is the origin of environment adaptation, and genetic variations (typically mutations) [26]. In a simple way, natural selection is the dynamical system consisting in the interactions between the organisms in their ressource limited environment. Indi-viduals with an advantage in resource exploitation reproduce more efficiently. Thus, their relative number in the population increases and they leave less resources to the individuals which have not this advantage. Typically, such an advantage is gained through a genetic mutation that shifts the phenotypes of the individual and of its offsprings. This phenomenon forms the basis of natural selection, and it is based on surprisingly simple mathematical concepts.
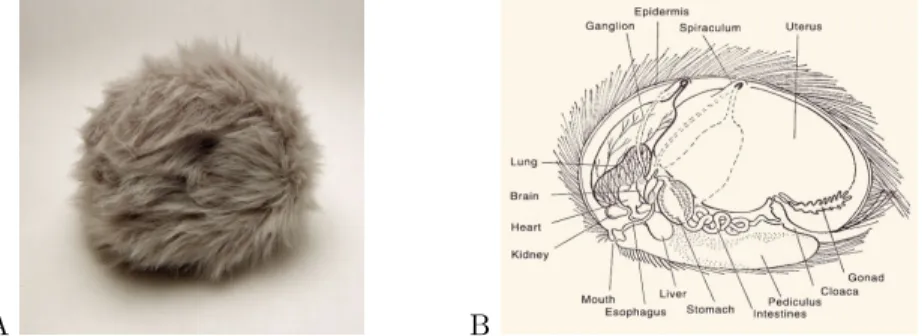
The trouble with tribbles.12
Although imaginary, tribbles make a very good example to illustrate evolutionary dynamics. Tribbles are an imaginary alien species from Star Trek13 which have two main characteristics:
they are able to reproduce very quickly, and they are cute (fluffy balls that purr, see figure 2.4A). According to Mr Spock, the high reproduction rate is a consequence of the high predation they
9Vampires, but they are not as dangerous for humanity as their diet fellows the mosquitos. 10or the ”never get laughed at again by a bartender formula”
11Bronchi and blood vessels are depressingly not perfect cylinders, but they can be approximated as such. 12If you are interested in evolution and in the weird paths evolution has taken, you must read the excellent book
The selfish gene by Richard Dawkins [22]
2.3. EVOLUTION. 17 suffer on their home-world, planet Iota Geminorum IV14. And indeed, a high reproduction rate is a frequent strategy of our earthly insects that also suffer high predation - typically mosquitos. Tribbles are thus submitted to a strong selective pressure on their reproductive rate, and indeed they do have a relatively large uterus that can accommodate many fetuses at once, see figure 2.4B. Let us assume the tribbles have a reproducing rate rx ą 0 (one tribble gives birth to a
A B
Figure 2.4: A: a tribble is an imaginary animal from the Star Trek series which has a high reproducing rate. B: tribble anatomy, notice the large uterus at the origin of their high reproductive rate, image from Star Fleet Medical Reference Manual [78].
mean of rxtribbles at each time unit) and that a mutation occurs and improves the capacity of a
tribble to reproduce more with a rate ry, larger than rx. But as all living organisms, tribbles live
in a resource limited environment which can support only K tribbles. In that case the effective reproductive ratio will be weighted by the resources left in the environment: p1 ´ px ` yq{Kq, where x is the number of ”normal” tribbles and y the number of ”mutants” tribbles. The tribbles suffer predation and they disappear at a rate p ą 014. This dynamic is reflected by the following equations: $ ’ ’ ’ ’ ’ ’ & ’ ’ ’ ’ ’ ’ % dx dt “ rxp1 ´ x ` y K q x ´ p x dy dt “ ryp1 ´ x ` y K q y ´ p y
xp0q “ N (the number of tribbles when the mutation occurs) yp0q “ 1 (one tribble gets the mutation at time t “ 0)
(2.2)
The mathematics of these equations are very classical and doing a stability study [75], we have the following results:
Lemma. The tribbles do not go extinct, i.e. limtÑ`8xptq ą 0 or limtÑ`8yptq ą 0 if and only
if ry{p ą 1 (more tribbles are born than eaten). If they do not extinct, then limtÑ8xptq “ 0 and
limtÑ8yptq “ k
´ 1 ´ rp
y
¯
, i.e. only the mutant tribbles will remain at the end.
Mutant tribbles invade the environment because they have an advantage in the exploitation of their environment: for the same resource quantities they are able to get more offspring. Because the resources are limited, their relative number increases regularly with time until they fill the environment. Actually the ratio between predation and reproduction rates p{r is very important and represents a cost: the higher its value, the lower the tribbles population. If this cost is larger than 1 then tribbles population goes extinct. If this ratio is decreased by any mutation, then the mutants will invade the population. Thus if predation p is high, birth rate r must also be high for the population to be maintained. You now get an idea on why Captain Kirk and his crew went into trouble when some tribbles found their way into grain storage where they could eat at will
14and according to Dr McCoy, they are pregnant before they are even born. Actually, this behavior does exist
in the real world in some insects, such as aphids [47].
18 2.3. EVOLUTION.
Figure 2.5: Mutants tribbles have an improved reproducing rate: they invade the environment and replace their cousins with lower reproducing rate.
with no predators...
Energetic costs.
Figure 2.6: Tribbles: the cost p{r as a func-tion of the litter size. The optimal value is about 11 (already pregnant) tribbles per litter.
We defined a cost from the ratio of the predation rate over the birth rate: p{r. The number of indi-viduals in the tribbles population without predation would be k, but predation removes a number kp{r in-dividuals from the population. Consequently, if the cost is distributed evenly to all individuals, then each tribble pays a price p{r, lost to predation. This cost corresponds to a direct loss of energy spent in repro-duction. In the preceding paragraph, we saw that if a tribble got a mutation that makes the cost lower, for example by increasing the birth ratio r, then its off-spring will eventually invade the tribble population.
An organism can alter its ways to interact with the environment through what is called a trait. In biology, a trait is a characteristic of an organism. The energy cost we defined for the tribbles will be affected by several traits that will alter either the birth rate r or the predation rate p. Let us focus on the birth rate of tribbles, and on the following trait: the litter size of a tribble (number of offsprings). It seems obvious
that the larger the litter size, the larger the birth rate15, and increasing the litter size can be achieved by increasing the uterus size of the tribble, see figure 2.4B. However, if the uterus is too large, then the size and mobility of the tribble are altered and predation is increased. Thus the cost is a convex function of litter size, see figure 2.6.
Consequently, the level of adaptation to environment of a trait can be represented with a cost that measures directly or indirectly an amount of energy allocated to the trait. Evolution will select phenotypes with costs smaller and smaller, ultimately selecting the phenotype with the lowest cost [26]. Notice that another measure of adaptation is often used: the fitness that measures the number of mature offspring produced over the lifetime of an individual. While evolution minimizes costs, it maximizes fitness.
15Litter size can be larger if offsprings are smaller, in which case their survival may be lower [49]; for tribbles
2.4. THE TROUBLE WITH COSTS FUNCTIONS. 19
2.4
The trouble with costs functions.
”Your assumptions are your windows on the world. Scrub them off every once in a while, or the light won’t come in.”, Isaac Asimov.
In the previous section, we had enough fluffy animals for years16, but with their reluctant help, we were able to connect evolution with the notion of costs. Evolution adapts traits expression to minimize the related costs, which arise from the interactions between the organism and its environment. In a more general way, any energetic cost is related to traits and faces evolution that may affect these traits in order to spare energy, in the limit of physiologically compatible step by step changes17.
Let us go back to the respiratory system, we saw that viscosity implies an energetic costs for oxygen transport due to viscous dissipation. With the example of straws, we also saw that the amount of viscous dissipation is dependent on the geometry of the transport network. Conse-quently, traits related to respiratory system geometry may have been submitted to selection and affected in such a way viscous dissipation is not too high or even minimized. This brings us to the first of the two core hypotheses I made about evolution. This first hypothesis allows us to search for the phenotypes that minimize the costs. Typically, we will search for geometries that minimize viscous dissipation in the respiratory system.
Hypothesis 1. Evolution convergence.
We assume that the quantities we are studying have reached a stationary state for evolution (convergence): we consider that today’s organisms configuration related to the respiratory system minimizes the costs on which they have been selected.
The second hypothesis is related to the environment dynamics. You probably recall that evolution of an organism is linked to its interaction with its environment and environment may change during the process of evolution, thus altering its trajectories. For the respiratory system which is an organ embedded in an organism, environment has a wide meaning, since it includes also the other organs with which it interacts.
Hypothesis 2. Environment stability.
We assume that the environmental quantities affecting the respiratory system did not change much, thus allowing us to approximate the environment with today’s environment and to assume the dynamic came only from the respiratory system.
Although seemingly strong, these two hypotheses are globally compatible with the theory of
punctuated equilibria in evolution [38] which suggests that the evolution process is quick relatively
to environment changes. Even with those hypotheses, (at least) two main reasons make it almost impossible to build the real costs from biological data. The first one is that traits are most of the time intrinsically tangled together18and the change in the expression of one trait may change
the expression of other traits and thus affect various energy costs. The second reason is that we can only observe the adapted organisms, since they are the ones that remain, leaving us with one single point to draw our cost function... scarcely enough to build a curve or, worst, a n-dimensional surface. Fortunately, modeling is our way out of these apparent dead-ends. Indeed, modeling allows to mimic traits that never existed or that do not exist any longer. With a model, we can estimate the costs of such ghost traits and compare them to the cost of the traits that have been selected. My goals were thus to build costs that include enough information to remain pertinent, while keeping the complexity in a minimal state. When such configuration is possible, then we may be able to understand the underlying mechanisms involved in the adaptive process. Consequently, one of the challenges I met in my research was to build pertinent approximations of cost functions for the respiratory system. And this is where we need the process called modeling.
16My cat disagrees with this statement.
17e.g. as a vertebrate, you can have either wings or front legs; this structural constraint may be a consequence
of living matter whirls in the embryo (how cool is that?), see the impressive work of Vincent Fleury [27].
18Try to put many (many) earphones in a bag for a few days: the accomplishments of DNA and evolution are
20 2.5. MODELING
2.5
Modeling
”Things that try to look like things often do look more like things than things. Well known fact. But I don’t hold with encouraging in it!”, Granny Wheatherwax in Wyrd
Sisters, Terry Pratchett.
Miss Wheatherwax is a witch from the Ramtops, a far far away region in Terry Pratchett’s Discworld. As a witch, she is known, respected and, let us face it, quite feared for her stern common knowledge. What she meant by this saying is that we often picture a thing differently as the thing itself. Specific features are being put forth while others are put back or not even accounted for, in a way that seems unrelated to the real features of the thing. Such behavior, if made consciously and scientifically, meets the modeling process: some features of the object we want to model play an important role in the phenomenon we are studying, while others are only influencing details of that phenomenon. This repartition is obviously very dependent on the phenomenon studied. We can put this in perspective through examples from the respiratory system modeling. If you plan to study the fluid mechanics of air inside the lungs, then you can neglect the molecular exchanges between air and blood: these exchanges have little influence on the mechanical properties of air inside the bronchial tree. On the contrary, if you study the oxygen flow through the exchange surface, you can probably neglect the air flow in the tracheobronchial tree, since oxygen concentration near the exchange surface can be considered unchanging (under certain conditions).
Our goal is to approximate the energetic costs that may have affected the evolution of the respiratory system. This goal drives the modeling process. The first step is to extract from the biology and physiology of the organ the traits involving potential largest energetic costs (e.g. for tribbles such traits were hinted by Mr. Spock: the reproductive and predation rates). Generally, such traits are linked together through one or several structural parameters we want to optimize (e.g. the tribbles size). These parameters can control the geometry, the physics, the mechanics or the chemistry affecting the organ; moreover they can be constrained by the organ function. Actually, constraints are more specific to organs because as a subpart of an organism, they fulfill a function for this organism. It constrains the parameters range into domains compatible with the function: typically oxygen flow rate in the respiratory system is constrained (i.e. blood flow rate in arterial network or air flow rate in the lung). The links between parameters and traits are made through the modeling of the organ, involving several physical or/and chemical processes. The optimal parameters determine the optimal phenotypes corresponding to the identified traits. The optimal configuration is then a compromise between the traits, it is called a trade-off in evolutionary ecology.
My scientific approach was to develop models with minimal complexity that are able to predict behaviors compatible with the respiratory system physiology. These predictions are either qual-itative, like the upholding of a tree structure by evolution, or quantqual-itative, like the prediction of red blood cells concentration in blood. By using minimal complexity, we keep a reasonable under-standing of the behavior of the interacting phenomena, and clearly extract the core phenomena that drives the mean behavior of the system.
An example with mammals lung.
The air flow in mammal tracheobronchial tree implies an energetic cost because of viscosity, this energetic cost is measured with an hydrodynamic resistance of the tree, built from the resistance of each airways, see section 2.2 about straws. Hydrodynamic resistance is the first trait. Metabolic function of the lung is to bring oxygen to blood through the exchange surface. The exchange surface lies in the lung and thus shares lung volume with the tracheobronchial tree. Under the hypothesis that lung volume is constrained, the larger the tracheobronchial tree is, the smaller the exchange surface is, and thus the fewer oxygen molecules are transferred in blood. This reflects a cost, through the reduction in oxygen flow for the metabolism. Thus, the second trait would be the volume of the tracheobronchial tree. Both traits are related through a structural parameter of the lung: the bronchi sizes. Thus the optimization process is made on bronchi sizes and we showed
2.6. WHERE ARE WE GOING FROM HERE? 21 that the optimal configuration corresponds to a tracheobronchial tree whose bronchi sizes decrease after each bifurcation with a size ratio of 2´1{3 „ 0.79 [57, 63]. This ratio, often represented by
the letter h, is called the tree reduction factor.
2.6
Where are we going from here?
In this chapter, I described how the different knowledges about respiratory system, viscous fluids, evolution and modeling assemble together to form a theoretical framework for my research. This framework fits a recent wider theory introduced by George C. Williams and Randolph M. Nesse in early 90’s known as Darwinian medicine or evolutionary medicine. This theory aims at under-standing health and diseases through the eyes of evolution, see for example [113] or the excellent book Why we get sick? [76].
The mammal respiratory system is a complex multi-scale system whose scales range from the centimeter (large bronchi or blood vessels diameters) down to a few microns (red blood cells, blood capillaries), covering all intermediate sizes. The physical and chemical processes driving the system thus depend on the scale: air and blood fluid mechanics (high or low Reynolds number, i.e. with or without inertia); tissue mechanics; convection, diffusion and chemistry of oxygen and hemoglobin. I have studied more specifically sub-organs of the respiratory system where dissipation is the strongest: the tracheobronchial tree, that conducts ambient air and thus its oxygen toward the exchange surface; the systemic arterial network in which oxygen is transported by blood to the organs; and the exchange surface itself in which oxygen crosses the alveoli-capillary membrane and reach the red blood cells and the hemoglobin.
All the questions we raise about respiratory system are formulated as if viscous dissipation were the main driver of evolution. We will see that with this sole hypothesis, we are able to draw interesting predictions, often compatible with the actual physiology. We will begin with a first simple, but central question: why has a tree structure been selected by evolution? There are obvious reasons, like a tree is handy for distributing a product on a large surface. While this is true, we show that such an assertion can be reformulated like this: the tree structure has to be stable for the dynamic process evolution. This is the topic we will study in chapter 3. Once we know the tree structure is stable for evolution, we will focus in chapter 4 on how a tree structure can develop in mammals, with a specific focus on tracheobronchial tree. We will also show how this development process can select a tree that would be efficient in adults. As a collateral effect, the development scenario we propose induces biological noises that interfere with the achievement of an efficient tree. The role of (environmental) noise on optimal strategy is actually a general process. We show in chapter 5, through a model for Mountford’s cliff-edge theory [73], that environmental noise can be a selective pressure for evolution and by thus alter the optimal strategies. This theory is then applied for the tracheobronchial tree. The next chapter, chapter 6, describes two applications linked to the previous results on tracheobronchial tree properties, one about COPD and one about chest physiotherapy. The last two chapters are dedicated to blood arterial network and its adaptation to viscous dissipation, chapter 7 focuses on the blood arterial tree network itself, while chapter 8 focuses on the pulmonary capillaries. Each of these questions brings forth the development of a specific model, based on mathematical tools, either from the literature or specifically developed for the study.
Chapter 3
Tree structures selection by
evolution.
The best way to distribute a product from a source to a volume is to use a tree structure, this is common knowledge and I am pretty sure even Miss Wheatherwax1 is aware of that. Many
biological systems indeed rely on tree structures to capture external products, from the tree (the real one, the plant), the lung, the blood network, jelly fish circulations, etc. Tree structures are per se dissipative and induce an energetic cost due to that dissipation. Consequently, to be maintained by evolution, such a cost must be outweighed by a gain, which is most probably linked to the organ function.
3.1
Minimizing dissipation in a tree, stability.
Figure 3.1: Artistic view of the typical tree model we use in this chapter. The quantity h measure the decrease in size of the branches after each bifurcation. The alveoli form the air/blood exchange surface of the
lung. They are connected to ambient air via the tra-cheobronchial tree. The size of the exchange surface, a hundred square-meters, ensures an oxygen flow in blood that is compatible with the metabolism. One of the func-tions of the tracheobronchial tree is to convey air, and thus oxygen, from the outside environment to the acini. As a first approximation, the tracheobronchial tree can be described with a dyadic tree with a cascade of sixteen successive bifurcations (i.e. seventeen generations), see figure 3.1.
Similarly, the arterial system forms a transport struc-ture between heart and blood microcirculation. Blood microcirculation is an exchange surface with tissues. Al-though very different in details, see section 7, the arterial system is also a tree structure in which a fluid is flowing. The flow of a viscous fluid in a tree dissipates energy as heat, eventually stopping all fluid motion. Thus, the energy loss has to be compensated for the fluid to stay in motion. As we already explained in our straws section 2.2, dissipation is highly dependent on the sizes of the branches, which raises the question: how does
dissipa-tion interfere with the selecdissipa-tion of a tree structure and some of its properties? Our goal was to give some answers to this question and we studied the behavior of a tree geometry made with successive
1the most serious witch from the Ramtops, see section 2.5
24 3.2. STABILITY OF THE TREE AS AN OPTIMAL GEOMETRY STRUCTURE. bifurcations and crossed by a Newtonian fluid. The tree branches were assumed cylindrical and the volume of the tree bounded. We modeled the function of the organ as a constraint on the fluid flow in the tree. Next, we determined the optimal configuration that minimizes the viscous dissipation of the fluid flow.
3.2
Stability of the tree as an optimal geometry structure.
A B C
Figure 3.2: A: initial configuration of the bifurcation before optimization; inlet is the left tube, outlets are upper and right tubes. Total fluid flow and volume of the bifurcation are given. The colors correspond to the local relative amplitude of deformation needed to reduce dissipation (shape gradient). B: optimal configuration if pressures constraints are applied at outlets. C: optimal configuration if fluid flow constraints are applied at outlets.
We studied mathematically the optimization process using a discrete framework, i.e. with a number of parameters that is finite (the unknowns are the branch diameters). We used low regime hypothesis to model air fluid mechanics (Poiseuille’s regime) [23, 65]. Natural boundary conditions for the tree leaves are either to impose the flow in the leaves2or to impose the pressures
on leaves outlets3. Our work shows that the tree structure is optimal for two configurations:
when the air flow through the leaves of the tree are constrained (and non zero); or when the pressures on leaves outlets are all exactly identical. However, if there is at least two different pressures on the leaves then the optimal tree is degenerated: it becomes a simple tube. This shows instantly that any disturbance on pressures on leaves when all are identical drives irremediably the optimal configuration towards a tube: identical pressures on leaves outlets is unstable. With shape optimization tools, we studied numerically these phenomena in a continuous frame, i.e. with an infinite number of parameters (the entire tree wall is unknown). Our codes were developed using Comsol Multiphysics and FreeFem++ [23, 84]. Our simulations showed that these results were still true for two and three-dimensional trees with two generations (bifurcations) in which flows an incompressible fluid in laminar regime (checking Stokes or Navier-Stokes equations). With these numerical calculations, we were able to determine exactly the shape of an optimal bifurcation in 2D and 3D.
For the tracheobronchial tree, the stresses applied to the leaves of the tree are the result of a complex process of active regulation that combines the effects of respiratory muscles, the mechanical response of the tissue and the effects of the smooth muscles, which stand on the walls of the small airways (the role of smooth muscles remains unclear [5, 56]). Actually, it is not clear whether the system is controlled by the flow rates, the pressures or other conditions that would combine both. However, the conclusions from the previous paragraph applied to the lung allow us to propose, within the limits of our modeling assumptions, that to maintain the tree structure of the lung along evolution, the regulation system has to constrain in some way the amount of air flowing through the small airways. Indeed, for the tree structure to have been selected with pressure constraints on the leaves, our results indicate that these pressures must be regulated in such a way that they are perfectly identical. However, the fact that the configuration is both unstable and submitted to variability - see section 5 - makes an evolutionary
2Dirichlet conditions for the fluid
3.3. STRUCTURE OF THE OPTIMAL TREE. 25 cost appear: if descendants are unable to maintain identical pressures, then the evolution of the tracheobronchial tree for these descendants will tend to select geometries more and more tubular that could eventually not irrigate correctly the exchange surface: this branch of descendants would probably become extinct. Consequently, at equal maximum dissipation, a stable optimal configuration is more likely to be selected than an unstable configuration: evolution will always bring straying descendant back to the configuration compatible with the physiology. Moreover, one could imagine that any ”mistake” on the bronchial geometry that makes it deviate from the optimal configuration could be offset by an active flow control in the small bronchi, for example by the smooth muscles [5]. Consequently, flow regulation is compulsory in a tree-like structure where natural selection occurs mostly on minimizing dissipation.
3.3
Structure of the optimal tree.
The models we have developed are more general than those based on symmetric bifurcation trees like in [63] because they do not assume anything about the relative size of the branches in a bifurcation. They allow to work with a tree that feeds an exchange surface unevenly distributed in space. The optimal configuration corresponds to a tree whose branches have a volume proportional to the ratio between the fluid flow rate in the branch and the total fluid flow rate in the tree. The air flow in one branch is used to irrigate the exchange surface of the downstream branch, and one can assume that this rate is proportional to the exchange surface area irrigated downstream of this branch, at least for the healthy lung [107]. Given the fact that the exchange surface fills the volume of the lung, its surface is approximately proportional to the volume it occupies. Thus, our studies indicate that the size of the branch has to be proportional to the lung volume it irrigates, which is consistent with the physiology [107]. If identical flow conditions apply to all the leaves of the tree, we find that the optimal configuration is a tree with symmetric bifurcations, which is it space-filling (with fractal dimension 3), and whose properties are comparable to lung physiology from about the fifth generation until about the seventeenth.
3.4
Conclusion.
All these results show that the tracheobronchial tree tends to minimize the criterion of viscous dissipation, indicating that this criterion has probably played a role in its evolution. Comparisons of our prediction with lung’s data [102] shows there exists a small systematic deviation from the optimal predicted by our models. This shift makes the tracheobronchial tree a little too big. In the next chapters, we propose a scenario that could explain, at least partially, this shift. Although our results have been obtained for a Newtonian fluid, these results are likely to apply to large arterial network, where blood can be considered Newtonian.
3.5
Historical background.
The results of this chapter are based on two mathematics papers published in 2008 and 2011. The 2008 one was the result of my collaboration with Nicolas Meunier (MAP5, Universit´e Paris Descartes) [65]:
Abstract 1. Optimal Poiseuille flow in a finite elastic dyadic tree [65]
In this paper we construct a model to describe some aspects of the deformation of the central region of the human lung considered as a continuous elastically deformable medium. To achieve this purpose, we study the interaction between the pipes composing the tree and the fluid that goes through it. We use a quasi-static approximation to determine the deformed radius of each branch. Then, we solve a constrained minimization problem, so as to minimize the viscous (dissipated) energy in the tree. The key feature of our approach is the use of a fixed point theorem in order to find the optimal flow associated to a deformed tree. We also give some numerical results with
26 3.5. HISTORICAL BACKGROUND.
interesting consequences on human lung deformation during expiration, particularly concerning the localization of the equal pressure point (EPP).
Beyond the results about the existence of an optimal tree in the deformed configuration, this paper developed the set of mathematical tools proposed earlier in [39], most particularly the mathematical properties of the resistance matrix associated to a tree structure in which a low regime Newtonian fluid is flowing. Another important result of this paper is that the distribution of fluid that has the minimal dissipation inside a tree has the same pressure at each tree root outlets, whatever the sizes of the branches.
The 2011 paper is a collaboration with Yannick Privat (LJLL, Universit´e Pierre et Marie Curie) and Xavier Dubois de la Sablonni`ere (Supelec, Gif-sur-Yvette). This work extends further the mathematical tools developed in the 2008 paper and introduces new mathematical tools based on optimization theory. Moreover, an entire section of this paper deals with shape optimization theory based on Yannick Privat’s work during his PhD thesis [84].
Abstract 2. Shape minimization of the dissipated energy in dyadic trees [23]
In this paper, we study the role of boundary conditions on the optimal shape of a dyadic tree in which flows a Newtonian fluid. Our optimization problem consists in finding the shape of the tree that minimizes the viscous energy dissipated by the fluid with a constrained volume, under the assumption that the total flow of the fluid is conserved throughout the structure. These hypotheses model situations where a fluid is transported from a source towards a 3D domain into which the transport network also spans. Such situations could be encountered in organs like for instance the lungs and the vascular networks. Two fluid regimes are studied: (i) low flow regime (Poiseuille) in trees with an arbitrary number of generations using a matricial approach and (ii) non linear flow regime (Navier-Stokes, moderate regime with a Reynolds number 100) in trees of two genera-tions using shape derivatives in an augmented Lagrangian algorithm coupled with a 2D/3D finite elements code to solve Navier-Stokes equations. It relies on the study of a finite dimensional op-timization problem in the case (i) and on a standard shape opop-timization problem in the case (ii). We show that the behaviours of both regimes are very similar and that the optimal shape is highly dependent on the boundary conditions of the fluid applied at the leaves of the tree.
In this last paper, we studied how the optimal geometry of a rigid tree is affected by viscous dissipation when the volume of the tree and the fluid flow inside the tree are constrained. We showed that a tree structure can be optimal only if a fluid flow is constrained into the leaves of the tree. This highlights the role of the function of the tree-like organs. Indeed, if only the total fluid flow in the tree is constrained, then the optimal structure is almost always a simple tube.
Chapter 4
Development of the
tracheobronchial tree.
The scenario we propose in the previous section to justify the selection of the geometry of the tracheobronchial tree takes into account cost and functional constraints that are related to the amount of oxygen that is transmitted to the blood. We considered the organ in its final adult state, regardless of the fact that he went through a stage of development. Development can have important consequences, especially on the geometry of the tree, which would be difficult to interpret outside the context of development.
The most cited recent scenario for lung development [68] is based on an architectural algorithm hard-coded in the genome and based on elementary processes. However this scenario remains unsatisfactory: it relies on non identified genes that control branching modes in a cryptic way, it is partially not compatible with data (repeated errors) and thus is assumed to be regulated, and finally it needs a huge amount of information encoded in the genome. The scenario we propose in this section, inspired by [104], represents a new paradigm on bronchial tree development and, more generally, on the role of physics in development. Our scenario is based on a simple property of diffusion, related to Saffman-Taylor instability [87]. It requires very few genetics, thus being very parsimonious and is compatible with most of the experiments and data1.
We derive from our scenario several consequences concerning the geometrical properties of the tracheobronchial tree and related to its efficiency with dissipation. This scenario is based on typical chemical pathways that are very similar to other branched organs such as kidney or salivary glands, thus our scenario is actually general and can be applied to any of those.
4.1
Modeling of the development of the tracheobronchial
tree.
The biochemistry involved in the tracheobronchial tree development is complex and accounts for many biochemical species. Almost all of these species play a subtle role on the shape, number and fine organization of the bronchi [14] but without actually altering the overall properties of the tracheobronchial tree: being a self-avoiding tree. Roughly, only the FGF10 protein (FGF = fibroblast growth factor) seems to ”contain” the branching pattern information. The usual role of this protein is to induce cell proliferation and thus tissue growth. Experiments have shown that cells respond to the flow of FGF10 they receive. Moreover, without FGF10 the tree can no longer form [14]. We can model the distribution of FGF10 during lung development as the result of a process of steady diffusion. In this diffusion model, the outer wall of the organ is the source of FGF10, which is consumed by the epithelial cells on the bronchial tree wall. Steady state diffusion can be used because the diffusion rate of FGF10 is much larger than the tissue
1I guess Guillaume d’Ockham would have been proud of our scenario.
28 4.2. EMERGENCE OF CORE PROPERTIES OF THE TRACHEOBRONCHIAL TREE growth rate. The concentration of FGF10 protein in the tissue is then the solution of a Laplace equation with Dirichlet boundary conditions at the edges. Bronchi cells respond to the local FGF10 concentration gradient (the flux is proportional to the gradient). The gradient is stronger where the curvature of the bronchi wall is larger (tip effect) and/or where the distance to the source of FGF10 is small. The consequence is then that the bronchi wall is unstable: a cell located on a small protrusion of the wall receives a slightly larger flow of FGF10 than its neighbors and thus proliferate slightly faster, thus the protrusion is amplified, becomes bigger and bigger and eventually becomes a tube. Because it is growing, the tube also becomes prone to irregularities on its tip, which gives rise to a bifurcation. The typical bronchus size at which those irregularities appear depends on the mechanical properties of its wall, and most particularly on its surface tension. Given the time scales, tissue growth is dominated by viscous effects. The tissue can therefore be seen as a viscous fluid whose mass increases gradually as the cells proliferate in the tissue. This proliferation is also a function of the local flow of FGF10.
We have studied this model in 2D [16, 18] and 3D [19]. Our study is based on an high-end numerical method based on homogeneous remeshings and smoothings of surfaces that deform in space (FreeFem ++ GMSH, [3, 99]). The diffusion of FGF10 proteins interacts with the geometry of the two surfaces formed by the bronchi wall and the organ wall. From these mere interactions, a dyadic self-avoiding tree emerges in a robust way. Figure 4.1 shows side by side 3D reconstructions of the lung of mouse embryos by Pierre Blanc (A) [9] and a realization of our model (B) [19]. The statistics of the geometric properties of the trees built with our model are very similar to those of the adult lung as shown on figure 4.3 and 4.4. For example, we studied the distribution of the branching asymmetry factor, which represents the size ratio between two branches stemming from a bifurcation. The distribution of the asymmetry factor is close to that of the adult lung, see figure 4.4. Adult lung’s data come from Raabe and collaborators data set [86]. The average asymmetry ratio predicted by our model is about 0.8, which is in accordance with lung data [102]. Our
A B
Figure 4.1: A: Series of reconstruction of right cranial lobe of mouse embryo lung between em-bryonic days 11 and 12, scale bar 100 µm, adapted from [9]. B: Typical tree resulting from our growth model.
scenario has a few corollaries. First, the many other proteins involved in lung development, or at least a part of them, are used to finely tune the bronchi characteristics. For example they can play a role on their geometry: by regulating the growth response of cells to FGF10 flux, or by affecting bronchi maturation during development, typically cells differentiation (to smooth muscles cells). Next, this model easily relates adult lung geometric properties with lung development parameters and in the next section, we will show how our scenario can explain two of them: the multi-scale structure of the tracheobronchial tree and the branching asymmetry in bifurcations.
4.2
Emergence of core properties of the tracheobronchial
tree
In our scenario for the development of the tracheobronchial tree, we have neglected the fact that the embryo grows globally. In our previous model, the sizes of the branches do not depend on


![Figure 4.1: A: Series of reconstruction of right cranial lobe of mouse embryo lung between em- em-bryonic days 11 and 12, scale bar 100 µm, adapted from [9]](https://thumb-eu.123doks.com/thumbv2/123doknet/15048557.693887/29.918.196.719.622.788/figure-series-reconstruction-right-cranial-embryo-bryonic-adapted.webp)
![Figure 4.3: Relative branch size distributions from [18]) - normalized by their corresponding mother branch](https://thumb-eu.123doks.com/thumbv2/123doknet/15048557.693887/31.918.279.630.718.838/figure-relative-branch-distributions-normalized-corresponding-mother-branch.webp)