Sodium Intake of
Canadians in 2017
2
Health Canada is the federal department responsible for helping the people of Canada maintain and improve their health. Health Canada is committed to improving the lives of all of Canada's people and to
making this country's population among the healthiest in the world as measured by longevity, lifestyle and effective use of the public health care system.
Également disponible en français sous le titre : L’apport en sodium chez les Canadiens en 2017
To obtain additional information, please contact:
Health Canada Address Locator 0900C2 Ottawa, ON K1A 0K9 Tel.: 613-957-2991 Toll free: 1-866-225-0709 Fax: 613-941-5366 TTY: 1-800-465-7735 E-mail: hc.publications-publications.sc@canada.ca
© Her Majesty the Queen in Right of Canada, as represented by the Minister of Health, 2018
Publication date: July 2018
This publication may be reproduced for personal or internal use only without permission provided the source is fully acknowledged.
Cat.: H164-233/2018E-PDF ISBN: 978-0-660-26265-9 Pub.: 180025
3
Table of Contents
Highlights ... 4
Background ... 4
Sodium and health ... 4
Sodium reduction in Canada ... 5
Health Canada's actions to date ... 5
Education and awareness ... 5
Sodium in the food supply ... 6
Results ... 6
Sodium intakes of Canadians ... 6
Top food sources of dietary sodium ... 8
Impact of voluntary sodium reduction in processed food on sodium intake of Canadians ... 9
Discussion... 9
Conclusion and Next Steps... 10
Annex – Methods ... 12
Differences in the pre- and post- data collection between the 2004 and 2015 Canadian Community Health Survey ... 12
4
Background
Sodium and health
Sodium is an essential nutrient found in salt and many foods, mainly processed food. Our bodies need a small amount of sodium to be healthy, but too much can lead to high blood pressure, an important risk factor for stroke and heart disease.1 Heart disease and stroke are the leading causes of death in Canada, after cancer.2
Approximately 25% of Canadians over the age of 20 have been diagnosed with high blood pressure.2 Many others have high blood pressure without knowing it, since it develops slowly and without obvious symptoms.
Highlights
The average daily sodium intake of Canadians is currently estimated at 2760 milligrams (mg), which is higher than the established goal of 2300 mg per day.
This means that Canadians are still consuming too much sodium, putting them at higher risk of high blood pressure, and therefore heart disease and stroke.
A closer look shows that 58% of Canadians aged 1 year and older, and 72% of children between the ages of 4 and 13 years, still exceed recommended limits of sodium intake.
Males consume much more sodium than females. Of particular concern, more than 90% of males between the ages of 14-30 are consuming excess levels of sodium.
Bakery products, mixed dishes, and processed meats account for half of the sodium Canadians consume. Other important contributors include cheeses, soups, sauces and condiments.
The current average daily sodium intake of Canadians is lower than the 3400 mg reported in 2004. This can be attributed to improvements in the estimates of the amount of food people consumed, methodological differences between the surveys conducted in 2004 and 2015, changes in dietary habits of Canadians, and changes in sodium levels in foods.
Voluntary sodium reduction in processed foods between 2010 and 2017 accounted for a decrease of only 240 mg, or 8%, in average daily sodium intake.
These results show that efforts to reduce sodium intake to date have not been sufficient, as most Canadians, particularly children, adolescents and males continue to consume too much sodium. Continued efforts, such as those that are part of the Healthy Eating Strategy, are needed to further
5
It is estimated that over 30% of high blood pressure cases in Canada are due to high sodium intake.3 High dietary sodium has also been linked to an increased risk of osteoporosis, stomach cancer and severity of asthma.4
Health Canada recommends that most Canadians consume 1500 milligrams (mg) per day and not exceed 2300 mg per day, which is the equivalent of just over one teaspoon of salt.5 These recommendations were established by Canadian and American scientists through a review process overseen by the National Academy of Medicine.4
Sodium reduction in Canada
In 2007, the Minister of Health established a Sodium Working Group to develop a strategy for reducing sodium intake in Canada. In 2010, the Working Group published their recommendations for sodium reduction.1 The strategy included recommendations directed at various levels of government, non-governmental organizations, consumers, the food industry, and other relevant stakeholders. The recommendations focused on four areas:
1. sodium levels in the food supply;
2. education and awareness of consumers, industry, health professionals and others; 3. research related to sodium reduction; and
4. monitoring and evaluation.
In 2010, Canada’s federal, provincial and territorial ministers of health agreed on the goal to reduce the average sodium intake of Canadians by a third, from 3400 mg to 2300 mg per day by the end of 2016.
Health Canada's actions to date
Since then, Health Canada has taken several actions to help reduce Canadians' sodium intake towards the daily 2300 mg goal. These include consumer education, nutrition labelling changes, facilitating the use of sodium alternatives, and establishing voluntary sodium reduction targets for processed foods.
Education and awareness
In the area of education and awareness, Health Canada collaborated with the food industry to develop the Nutrition Facts Education Campaign. The purpose of this campaign was to help consumers make more informed food choices using the Nutrition Facts table.
As a part of the Eat Well campaign, Health Canada included messages to help Canadians understand the health effects of sodium and to help parents choose lower sodium foods at the grocery store and when eating out.
6
Sodium in the food supply
In December 2016, Health Canada introduced updates to nutrition labelling regulations as part of the Healthy Eating Strategy. These updates included standardizing serving sizes to help consumers compare the Nutrition Facts table of similar products and other changes to help make the table easier to use. To address concerns about slow approval times for sodium alternatives, Health Canada improved the efficiency of the approval process for lower sodium food additives. The use of new regulatory tools for food additives allows for more efficient approvals, once the scientific review is completed.
In 2012, Health Canada published its Guidance for the Food Industry on Reducing Sodium in Processed Foods.6 This report asked the food industry to reduce sodium to targeted levels by the end of 2016. The goal of the targets was to lower the average sodium intakes from 3400 mg to 2300 mg per day without requiring much effort from consumers. This is because 77% of dietary sodium comes from commercially processed and prepared foods, while only 11% is added by consumers; the remaining 12% occurs naturally in foods.7
On January 15, 2018, Health Canada published an evaluation of the food industry’s progress in meeting the targets.8 Results showed that sodium reductions were only modest, with most food categories not reaching the targets set for 2016.
Results
The objective of this report is to assess the current sodium intakes of Canadians in light of the recent voluntary sodium reductions in processed foods using the most recent national dietary survey, the 2015 Canadian Community Health Survey – Nutrition (2015 CCHS).
The evaluation of population sodium intakes required data on food intake of Canadians and on sodium levels in food. Details on how the analysis was conducted are provided in the Annex.
Sodium intakes of Canadians
The average sodium intake of Canadians is currently estimated at 2760 mg per day, which is still well above the recommended maximum daily intake of 2300 mg per day. Average daily sodium intakes by age and sex groups are shown in Table 1.
7
Table 1. Average daily sodium intakes (in mg) of Canadians, by age and sex group Age Groups (years)
Average Daily Sodium Intake (mg)
Children Male Female
1 to 3 1530 4 to 8 2160 9 to 13 2740 2410 14 to 18 3320 2350 19 to 30 3420 2270 31 to 50 3020 2270 51 to 70 2820 2030 71 or older 2440 1950
Figure 1 shows the percentage of Canadians who consume sodium above recommended limits for their age and sex group.
Fifty-eight percent (58%) of Canadians aged 1 year and older consume too much sodium. The percentage of Canadians consuming excess sodium increases with age during childhood, and peaks during adolescence and early adulthood before it starts to decrease after the age of 30. Also, 72% of children between the ages of 4 and 13 years eat too much sodium. Canadians over the age of 70 years
8
have the lowest consumption of sodium among Canadian adults.
Males consume much more sodium than females, especially starting in adolescence. In particular, more than 90% of males between the ages of 14 and 30 exceed recommended limits for sodium. In
comparison, less than half of the females in the same age group consume excess sodium. Males consume more sodium mainly because they consume more calories. This is because there aren’t large differences in sodium intake level per calorie consumed between males and females.
Top food sources of dietary sodium
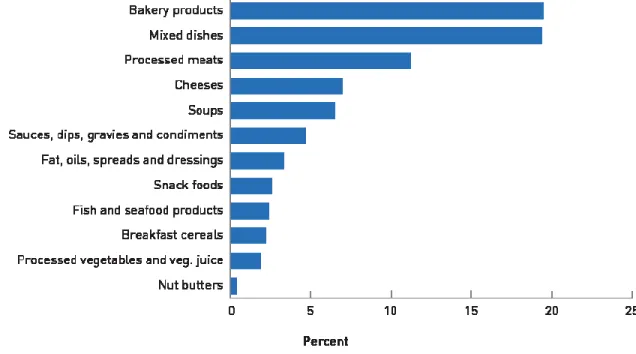
Figure 2 shows the major contributors of sodium intake in the Canadian diet.
Source: CCHS 2015, Health Canada Food Label Data 2017 and Canadian Nutrient File 2015 for top categories as classified in Health Canada’s 2012 sodium reduction targets
Many foods contribute to sodium intake. Bakery products, which include: breads, muffins, cookies, desserts, crackers, and granola bars are the top food sources (20%) of sodium. Mixed dishes such as pizza, lasagna, refrigerated or frozen entrées and appetizers, frozen potatoes and prepared salads are the second most important contributors to dietary sodium (19%), followed by processed meat products such as sausages, deli meats, canned meats, chicken wings, burgers and meatballs (11%). Together,
9
these 3 broad categories account for half of all the sodium Canadians consume. Other important contributors include cheeses (7%), soups (6%), sauces and condiments (5%), fat, oils, spreads, and dressings (3%), snacks, such as chips and pretzels (3%), and fish and seafood products (2%).
Impact of voluntary sodium reduction in processed food on sodium intake of
Canadians
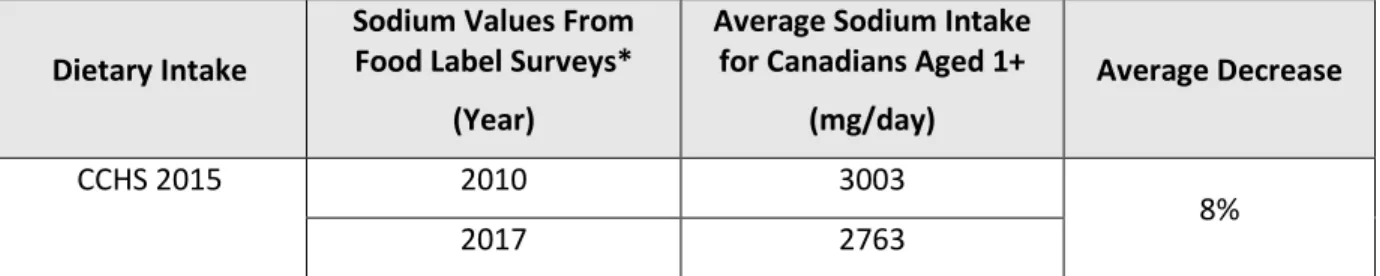
In January 2018, Health Canada published a report evaluating the food industry’s progress towards meeting the sodium reduction targets.8 The results of this evaluation were used to estimate the impact of changes in sodium levels in processed foods between 2010 and 2017 on the sodium intake of Canadians. The analysis showed that voluntary sodium reduction efforts by food manufacturers accounted for a decrease in average sodium intake of 240 mg per day, which is equivalent to an 8% decrease (Table 2).
Table 2. Changes in sodium intakes due to voluntary sodium reduction in processed foods between 2010 and 2017
Dietary Intake
Sodium Values From Food Label Surveys*
(Year)
Average Sodium Intake for Canadians Aged 1+
(mg/day)
Average Decrease
CCHS 2015 2010 3003
8%
2017 2763
*Sodium Values are sales weighted average for each of the 94 food categories (see the Annex for more information)
Data sources: 2015 CCHS, Health Canada Food Label Data (2009-10 and 2017), and Canadian Nutrient File (2015)
Discussion
In 2010, Canada’s federal, provincial and territorial ministers of health agreed on the goal to reduce the average daily sodium intake of Canadians by a third, from 3400 mg to 2300 mg by the end of 2016. The findings in this report show that this intake goal was not achieved, and that most Canadians are still consuming too much sodium.
Decreasing sodium intake requires changes in consumer eating behaviour and reductions in sodium levels in the food supply. However, achieving the intake goal of 2300 mg per day depended primarily and largely on the food industry’s voluntary sodium reduction efforts because most of dietary sodium
10
comes from processed food. The sodium reduction targets that Health Canada asked the food manufacturers to achieve by the end of 2016 were established in order to lower sodium intakes of Canadians by at least 25%.
This analysis showed that voluntary sodium reduction in processed foods between 2010 and 2017 accounted for a decrease of only 240 mg, or 8%, in average daily sodium intake. The remaining
difference in sodium intake compared to 2004 can be explained by other reasons. For example, a recent study by Statistics Canada reported that there were more under-reporters and fewer over-reporters in the 2015 CCHS than in the 2004 CCHS.9 Furthermore, improvements made to 2015 food intake
collection measurements led to better estimates of what and how much Canadians ate compared to 2004 (for more information on methodological differences between 2015 CCHS and 2004 CCHS, please see the Annex). For these reasons, the data has its limitations and caution should be exercised when comparing sodium intakes of Canadians between 2004 and 2015.
Despite not achieving the intake goal of 2300 mg per day, even a modest decrease in sodium intakes is expected to lead to improved health outcomes. It was estimated that a reduction of 400 mg sodium per day, achieved over a 10-year period, would result in up to 40,000 fewer cases of coronary heart disease and 23,000 fewer cases of stroke annually.10
Conclusion and Next Steps
The current sodium intakes of most Canadians continue to be high, particularly among males, children, and adolescents. Due to the high prevalence of high blood pressure and high sodium intakes among Canadians, sodium reduction remains a public health priority in Canada.
Health Canada’s Healthy Eating Strategy includes measures that will support additional and meaningful reductions in sodium intake. In light of the findings of this report, Health Canada will develop new or voluntary revised targets for both prepackaged and restaurant foods and monitor progress.
Furthermore, in February 2018, Health Canada proposed regulations that would require a front-of-package nutrition symbol on foods high in sodium, sugars, and/or saturated fat.11 This symbol will help Canadians make healthier food choices.
Health Canada will be introducing regulations that would restrict the marketing of unhealthy foods and beverages to children under the age of 13 years. The definition of ‘unhealthy’ will take into account the sodium content of foods and will reduce exposure to these foods. This is particularly important as the majority of children under the age of 13 years consume too much sodium.
11
The revised Guide aims to communicate dietary guidance in ways that better meet the needs of
different users. This will include ensuring that heathy eating information is communicated to Canadians in a relevant and useful manner to support them in making healthy eating choices, including in relation to sodium.
These findings come at a critical time. The Government of Canada has made an unprecedented
commitment to confronting the problem of chronic disease. This report confirms that sodium reduction continues to require the concerted efforts of all players, including all levels of government, stakeholders, and consumers.
12
Annex – Methods
Data on food intake of Canadians was obtained through the 2015 CCHS. The CCHS is a national health survey conducted by Statistics Canada. It collects self-reported information from Canadians in all provinces, excluding territories, about their eating habits and use of nutritional supplements, as well as other health factors. To determine intakes, the survey collects information about what and how much Canadians aged 1 year and older ate and drank during the previous day.12 The 2015 CCHS is the most recent national nutrition survey since 2004.
Sodium levels in food were obtained from two data sets: food labels of over 10,000 branded products collected in 2017 and covering the 94 categories for which sodium reduction targets were established,8 and the Canadian Nutrient File (version 15) for all other foods.13 Where a processed or commercially-prepared food was matched to one of the 94 categories, the sales weighted average was used as the sodium level for that food. This is because this average best reflects the sodium level of the products purchased by Canadians within each category. Because the CCHS does not account for sodium added by consumers, the average sodium intake of the whole population was increased by 10%, as was done in the 2004 CCHS.1
Health Canada repeated the same analysis described above with sales weighted averages from the same 94 categories of food collected in 2009-2010 (baseline). This was done to determine the impact of voluntary sodium reduction efforts on changes to sodium intakes of Canadians.
Differences in the pre- and post- data collection between the 2004 and 2015
Canadian Community Health Survey
The 2004 CCHS Nutrition focus survey was the first national nutrition survey in over 30 years that collected food consumption data from Canadians. Data collection tools and methods such as the Automated Multiple-Pass Method (AMPM) and the Model Booklet, developed by the U. S. Department of Agriculture and used in the U.S. National Health and Nutrition Examination Survey, were adapted and used in Canada.
For the 2004 survey, modifications of the AMPM were made to the food categories to reflect the Canadian food supply and to incorporate the metric measures; the tool was also translated to allow the field data collection in both official languages. Lessons learned from the 2004 CCHS Nutrition helped improve the data collection tools used for the 2015 CCHS Nutrition. Consequently, the 2015 CCHS Nutrition better reflects the food and nutrient intakes of Canadians than the 2004 survey.
13
Understanding and Using the Data, released by Health Canada.
There are a number of possible reasons to explain differences in energy and nutrient intakes between 2 points in time in a population-based survey, such as the CCHS. The primary ones are:
1. The result of changes in consumption patterns (type of foods selected, frequency of consumption, and/or quantity consumed);
2. Changes in the nutrient composition of foods; and 3. Changes in the pre- and post- data collection.
Changes in the pre- and post- data collection are explained by:
Models used during the interview to describe the amounts consumed
- The model booklet used in 2015 was updated. Bowls, mugs, drinking glasses and cups were updated to reflect sizing in Canada.
- In 2004, both imperial and metric units of measure were available in the model booklet which brought a lot of confusion in the sizing of foods. In 2015, no unit of measure was available, which reduced sizing error.
Data checks at interview time
- In 2004, the AMPM tool used to collect food and beverage consumption did not have any upper limit quantity control for sizing. Many recalls with large amounts of food were recorded; most of these were likely the result of data entry errors at the time of
interview.
- In the 2015 survey, the AMPM tool was updated with a warning quantity check when a large amount was entered; so that the large amount, incorrectly recorded, was revised in the presence of the respondent.
Post-data collection manual edits
- For the 2004 and 2015 surveys, quality assurance checks were conducted, and manual sizing edits were performed.
- In 2004, a total of 22,000 sizing edits had to be manually reviewed by Health Canada nutrition analysts.
- By comparison, only 68 sizing edits were done in the 2015 survey, largely due to the major quality and quantity control improvements of the AMPM screens.
14
References
(1) Sodium Reduction Strategy for Canada.
https://www.canada.ca/en/health- canada/services/food-nutrition/healthy-eating/sodium/related-information/reduction-strategy/recommendations-sodium-working-group.html Accessed March 4, 2018.
(2) How Healthy are Canadians? A trend analysis of the health of Canadians from a healthy living and chronic disease perspective.
https://www.canada.ca/en/public-health/services/publications/healthy-living/how-healthy-canadians.html Accessed March 4, 2018.
(3) Joffres MR, Campbell NRC, Manns B, Tu K. Estimate of the benefits of a population-based reduction in dietary sodium additives on hypertension and its related health care costs in Canada. Can J Cardiol. 2007;23(6):437-43.
(4) Institute of Medicine of the U.S. National Academies. Dietary Reference Intakes for Water, Potassium, Sodium, Chloride, and Sulfate. Washington (DC): National Academies Press 2005. (5) Sodium: the Basics.
https://www.canada.ca/en/health-canada/services/nutrients/sodium/sodium-basics.html, Accessed March 17, 2018.
(6) Health Canada Guidance for the Food Industry on Reducing Sodium in Processed Foods 2012
https://www.canada.ca/en/health-canada/services/food-nutrition/legislation- guidelines/guidance-documents/guidance-food-industry-reducing-sodium-processed-foods-2012.html Accessed February 20, 2018.
(7) Mattes RD, Donnelly D. Relative contributions of dietary sodium sources. J Am Coll Nutr. 1991;10:383-93.
(8) Health Canada (2018) Sodium Reduction in Processed Foods in Canada: An Evaluation of Progress toward Voluntary Targets from 2012-2016 https://www.canada.ca/en/health- canada/services/food-nutrition/legislation-guidelines/guidance-documents/guidance-food-industry-reducing-sodium-processed-foods-progress-report-2017.html Retrieved February 27, 2018.
(9) Garriguet, D. Accounting for misreporting when comparing energy intake across time in Canada. Health Reports 2018;29(5):3-12.
(10) Bibbins-Domingo K, Chertow GM, Coxson PG, Moran A, Lightwood JM, Plecher MJ, et al. Projected effect of dietary salt reductions on future cardiovascular disease. N Engl J Med. 2010;362:590-99.
(11) Regulations Amending Certain Regulations Made Under the Food and Drugs Act (Nutrition Symbols, Other Labelling Provisions, Partially Hydrogenated Oils and Vitamin D).
http://gazette.gc.ca/rp-pr/p1/2018/2018-02-10/html/reg2-eng.html Accessed April 24, 2018. (12) Canadian Community Health Survey – 2015 Nutrition.
http://www23.statcan.gc.ca/imdb/p2SV.pl?Function=getSurvey&SDDS=5049 Accessed March 14, 2018.
(13) Canadian Nutrient File. https://food-nutrition.canada.ca/cnf-fce/index-eng.jsp Accessed March 4, 2018.