HAL Id: hal-01058510
https://hal.archives-ouvertes.fr/hal-01058510
Submitted on 27 Aug 2014
HAL is a multi-disciplinary open access archive for the deposit and dissemination of sci-entific research documents, whether they are pub-lished or not. The documents may come from teaching and research institutions in France or abroad, or from public or private research centers.
L’archive ouverte pluridisciplinaire HAL, est destinée au dépôt et à la diffusion de documents scientifiques de niveau recherche, publiés ou non, émanant des établissements d’enseignement et de recherche français ou étrangers, des laboratoires publics ou privés.
Phase measurement of a microwave optical modulation:
characterisation and reduction of amplitude-to-phase
conversion in 1.5 µm high bandwidth photodiodes
Ha Phung, Mourad Merzougui, Christophe Alexandre, Michel Lintz
To cite this version:
Ha Phung, Mourad Merzougui, Christophe Alexandre, Michel Lintz. Phase measurement of a mi-crowave optical modulation: characterisation and reduction of amplitude-to-phase conversion in 1.5 µm high bandwidth photodiodes. Journal of Lightwave Technology, Institute of Electrical and Electronics Engineers (IEEE)/Optical Society of America(OSA), 2014, 32 (20), pp.3759 - 3767. �10.1109/JLT.2014.2312457�. �hal-01058510�
D. H. Phung, M. Merzougui and M. Lintz: Laboratoire ARTEMIS, Univ. Nice Sophia, Observatoire de la Cote d'Azur and CNRS, Bd de l'Observatoire, 06300 Nice, France (e-mail: michel.lintz@oca.eu).
C. Alexandre: CEDRIC/LAETITIA, CNAM, 292 Rue Saint Martin 75141 Paris Cedex 03, France (e-mail: christophe.alexandre@cnam.fr).
Abstract— High accuracy and low noise measurement of the phase of a microwave signal requires that spurious contributions are adequately dealt with. In this paper we investigate the power-to-phase coupling in two commercial high bandwidth P-I-N, near-IR photodetectors. We observe that a sudden change of the optical power induces a transient of the phase of the 20 GHz signal, at different time scales. The temperature rise of the photodetector junction is likely to be involved in this dynamical behaviour. The value of the bias voltage applied to the photodetector appears to control the size of the phase transients, as well as the optical power for which the slope of the amplitude-to-phase coupling cancels. The most efficient way to reduce amplitude to phase couplings consists in implementing optical demodulation, instead of electrical demodulation, of the microwave signal.
Index Terms— Photodetectors, Phase measurement, Phase noise, Heating, Optical modulation, Microwave
frequency conversion.
I. INTRODUCTION
ICROWAVE modulation of an optical beam is becoming increasingly important for the transfer of a high frequency reference, with applications in antenna synchronisation for radio-astronomy, optical clock comparison in metrology, photonic analogue-to-digital conversion [1], ... In all these applications, where a very low phase noise is required, photodetectors are critical parts of the chain. P-I-N InGaAs photodiodes are capable of very low intrinsic phase noise [2]. However, reaching low phase noise and high accuracy in the detection process requires that any additional contribution be reduced to the desired level. The amplitude-to-phase (AM-to-PM) coupling is a known problem [3] because it exacerbates phase noise as soon as the optical power varies, and can place stringent limits to the relative intensity noise of the laser source. This has been studied in the framework of microwave optical links, as the amplitude noise cannot exceed the desired phase noise divided by the AM-to-PM conversion factor. In the case of mode-locked lasers the AM-to-PM coupling has been related to the distortion and broadening of the photodetection pulses, recorded with a high speed sampling oscilloscope [4]. In [5] the observation is made that when increasing the energy/pulse one can find conditions where the AM-to-PM slope turns to zero, thus relaxing the requirements on the laser intensity noise. The screening of the electric field accross the photodiode junction by the charges of the photocurrent, which is responsible for saturation and pulsed signal distortion [6] can be reduced by modifying the photodiode design. The modified unitravelling carrier photodiode of [7] has shown lower saturation and lower AM-to-PM coupling. In [8], the zeroes of the AM-to-PM coefficient were
Phase measurement of a microwave optical
modulation: characterisation and reduction of
amplitude-to-phase conversion in 1.5 µm
high bandwidth photodiodes
Duy-Ha Phung, Mourad Merzougui, Christophe Alexandre, Michel Lintz
explained, in the model of the triangular shape temporal response of the photodetector. In the case of a high-frequency modulated laser beam, reference [9] has also observed that the AM-to-PM coupling can change sign and cross zero at a certain optical power. The coincidence with the optical power at which the photodiode saturates was also explained through the collapse of the electric field in the photodiode junction [6]. The screening of the electric field takes place at very short time scales, typically picoseconds (Fig. 1 in [8]). It can be considered as instantaneous in what we discuss in this paper. Ref. [10] has reported a ≈1/f frequency dependence of the AM-to-PM coefficient when the power of sub-ps pulses was modulated at audio frequencies. The method consisted in modulating the current in the pump diode of the (free running) mode-locked laser and in using a spectrum analyser to observe both the amplitude and the phase modulations in the photodiode signal. But the normalized conversion ratio reported ([10], figure 3 and figure 4-c) does not change when inserting optical attenuators before the photodiode, which suggests that the phase modulations reported in [10] do not originate in the photodiode.
Thermal processes are known to be involved in the runaway failure of photodiodes, due to the combination of the Joule power dissipated in the junction and the decrease of the thermal conductivity of the substrate with increasing temperature [11]. Addressing this problem, other studies [12] have brought quantitative insight into thermal management of photodiodes. In particular, by observing the responsivity change caused by the thermal bandgap redshift in the junction material, [13] has indirectly measured the junction temperature rise of photodiodes submitted to strong illumination, and confirmed that the heating power is equal to the product of the photocurrent and the reverse bias voltage. Temperature is also known to affect carrier mobility [12]. Thermal processes can give rise to time scales much longer than the ps-scale photodetector response time. Nevertheless, none of Refs [5-9] considers self-heating of photodiodes illuminated by a strong laser power as relevant to the problem of AM-to-PM coupling.
In order to identify the conditions for optimal rejection of noise and systematic deviations in optical microwave links, we perform a systematic study of the phase of the RF signal, and of its dependence on the two prominent parameters, optical power and applied reverse bias. This is done with two P-I-N, InGaAs, 20 and 25 GHz bandwidth, commercial photodiodes. After a sudden change of the optical power in the measurement channel, we observe transients on the measured phase. Time constants of the order of 10 µs are measured, in agreement with the time dependence expected for the heating of the junction in contact with the InP substrate. Not only the applied bias appears to control the phase vs amplitude dependence, and hence the value of the optical power for which the AM-to-PM cancels, but it also controls the amplitude of the transient behaviour. In Sect. VII we show that optical demodulation of the microwave signal allows rejection, by several orders of magnitude, of AM-to-PM coupling in the photodetector.
These points are important for applications in which the phase has to be measured with high accuracy while the optical power is varied by significant factors at short time scales. They are particularly critical in recent developments in high accuracy absolute laser ranging [14] where a beam carrying a 20 GHz modulation has to be measured, both in phase and amplitude, with an accuracy of 10-4 radian, and 5 10-5, respectively. The difficulty
arises from the variations of the amplitude of the optical 20 GHz signal, associated with the ranging measurement sequence [14]. These large variations (from - to +50%) at the microsecond time scale give rise to spurious phase shifts well above the required accuracy for the phase measurement. The present work results from the need to understand, characterize, and finally reduce the AM-to-PM related phase systematic error and noise in the ranging measurement.
II. EXPERIMENTAL METHOD
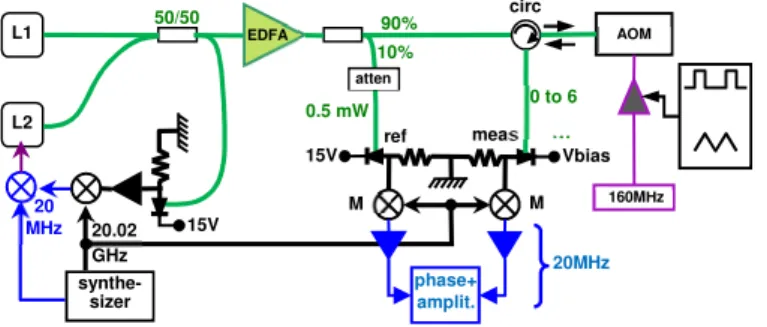
The beat-note of two narrow-bandwidth fibre lasers at 1.55 µ m (Fig. 1), phase-locked to a frequency offset of 20.00 GHz [15], is used to generate the optical signal. The optical power is kept constant in the reference channel. The reference and measurement 20 GHz photodiode signals are converted to 20 MHz, intermediate frequency signals by two double balanced mixers (Miteq, model DM0520-LW1), then amplified in two Stanford SR445A amplifiers.
Fig. 1. Measurement set-up. L1, L2 : single-mode lasers, phase-locked to a frequency offset of 20.00 GHz. EDFA: 150 mW fibre optical amplifier. M : mixers. AOM : 160 MHz, double pass acousto-optic modulator, used to modulate optical power. Atten : fixed optical attenuator. Circ: optical circulator. Ref (meas) : high bandwidth photodiodes for the reference (measurement) signal. Phase + amplit.: signal data acquisition (during 10 µs, every 15 µs) followed by the calculation of the two amplitudes and relative phase.
For the measurement of the static AM-to-PM coupling in the measurement channel, the signal generator applies a slow (3 Hz) triangular signal to drive the power of the 160 MHz (fixed frequency) signal applied to the AOM (acousto-optic modulator). We first tried to use an integrated Mach– Zehnder electro-optic modulator (MZEOM) to drive the optical power, but, due to a slight coupling between transmission and transmitted polarization, changing the transmission of the MZEOM clearly resulted in phase offsets related to mode dispersion (PMD) in the polarization-maintaining fibers of the MZEOM. No such coupling occurs between the diffraction efficiency in an AOM and the polarization of the diffracted beam, so that when an AOM is used to drive the optical power, PMD is not an issue.
As opposed to static measurements, transients are obtained after a gated signal drives the optical power from a low to a high value in less than a microsecond. The instantaneous response is followed by a delayed phase change of smaller amplitude.
The phase meter has been designed for high accuracy laser ranging with a microwave-modulated laser beam [14]. The two 20 MHz, intermediate frequency, sinusoidal signals are sampled during 10 µs using the two 245 MS/s, 14 bit analogue-to-digital converters of an FMC150 interface board. In separate measurements, we observe that the AM-to-PM coupling in the FMC150 board is less than 2x10⁻³
radian (static) and 3x10⁻⁵ radian (transient). Inside a Virtex-6 FPGA (field programmable gate
array) the signals are then translated from 20 MHz to 0 Hz, low-pass filtered and decimated. The resulting complex values are used to compute the two amplitudes and the phase difference. Phase data obtained with noiseless 20 GHz optical signals show a resolution of 4
3.10− radian, which improves
as 1/ 2
t−
≈ with the integration time. Each set of elementary data is corrected for a cross-talk of about 10-3 between the two measurement chains. The four cross-talk coefficients (two amplitudes and two
phases) are determined in separate measurements. A new elementary data set is delivered every 15 µs, which allows us to study temporal evolution of the phase at time scales ranging from 10 µs to 1 s.
In refs [8], [5], no time dependence was observed, except for the sampling oscilloscope sub-nanosecond records, showing the picosecond-scale temporal dynamics related to the charge carriers. In these works, measurements of the AM-to-PM coefficient were mainly done by the bridge method, that is by demodulating the optical microwave signal down to zero frequency [5] or to intermediate frequency [8]. Then the AM-to-PM characteristics were recorded by measuring the RMS phase change while the optical power was modulated using an AOM, at low frequency (30 Hz, [8]) or at audio frequency (20 kHz, [5]). In [8], the authors have looked for a change in the AM-to-PM coefficient when the modulation frequency is scanned from 10 Hz to 1 kHz, but did not observe any.
meas L1 L2 EDFA AOM 160MHz synthe-sizer phase+ amplit. 20MHz 50/50 10% circ M M ref 90% 15V Vbias 0.5 mW 0 to 6 mW atten 15V 20.02 GHz -20 MHz
Here we characterize two InGaAs commercial photodiodes. Table I gives some data provided by the manufacturers.
TABLE I
MANUFACTURER DATA FOR THE TWO PHOTODETECTORS UNDER TEST
Photodetector New Focus 1417 EM4 EM169
Bias voltage Vbias 4.1 V fixed bias up to 25 V
Junction diameter 25 µm 32 µm
Substrate dimensions (µm) N/A 450x450x152
Back illuminated yes N/A
Bandwidth 25 GHz 20 GHz
Fibered no yes
Wavelength range 950-1650 nm 1280-1620 nm Max. safe DC opt. power 5 mW 20 mW
Max. peak opt. power 100 mW N/A
Linear operation range 2 mW 6 mW
Responsivity 0.7 A/W 0.9 A/W
III. THE RF PHASE VS OPTICAL POWER DEPENDANCE
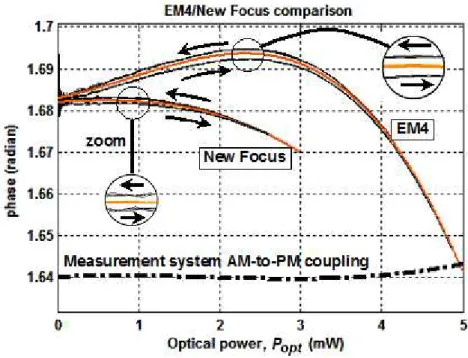
Fig. 2 shows typical recordings of the measured phase as a function of the optical power Popt, with
the two photodiodes. Contrary to results presented in [5], [8], where all data presented are absolute values Φ , the phase difference values Φ ≡ϕmes−ϕref presented in this paper refer to the expression
( )
sin(2πt×20GHz−ϕmes ref ) for the microwave signal from the photodiode under test, and the reference
photodiode, respectively. Phases are given in radian throughout the paper. Phase offsets are due to cable lengths and components.
To confirm that the observed effects originate in the photodiode and not in the measurement system, we have inserted a 14 dB attenuator between the photodiode
Fig. 2. RF phase versus optical power for the two photodiodes. Bias voltage: 15 V (EM4), 4.1 V (New Focus). Each data point has been averaged over 100 elementary data. The measurement channel optical power is scanned at a frequency of 3Hz. One of the two recordings has been translated so that the phase offsets coincide. The cubic fits (see Table II) apply to the middle of the up and down curves.
and the mixer. A 14 dB gain is added in the intermediate frequency amplifier, so that the size of the 20 MHz signal fed to the A-to-D converters is essentially the same. As expected due to the attenuation of the signal, we observe a slight increase of the noise, but the change in the phase data (black dashed line) shows that the contribution from the measurement system to the AM-to-PM coupling is negligible. The fact that the AM-to-PM effects are related only to the optical power that reaches the photodiode is confirmed in separate experiments where no AOM is used (and the power of the microwave modulated beam is constant), but an extra beam, provided by a diode laser is used to raise the power dissipated in the photodiode. Same results are obtained, particularly the behaviour observed in Fig. 4 and 5, when the diode laser is switched ON or OFF.
TABLE II COEFFICIENTS OF THE CUBIC FIT
Photodiode a b c
EM4 3.6 10-3 2.86 10-3 -1.05 10-3 New Focus 1.2 10-3 -7.3 10-4 -3.37 10-4 Unit radian/mW radian/mW2 radian/mW3
Coefficients of the cubic fit (y = ax + bx2 +cx3 + offset) of the phase-vs-power curves in Fig. 2, for the two photodetectors under test.
In [9], figure 11 shows a power-to-phase coefficient of ≈ 4 10-2 radian/mW which turns to zero and
changes sign when the optical power reaches 9 ∼ 10mW, which is also the power at which the photodiode under test saturates. With the EM4 photodiode biased at 15V, we observe a similar behaviour, except that the small signal power-to-phase coefficient of 3.6x10⁻³ radian/mW turns to zero at 2.3 mW optical power, whereas the photodiode shows no sign of saturation up to 6 mW. At 6mW the AM-to-PM slope reaches -0.076radian/mW (-0.6ps/mW, if converted to a time delay). The New
Focus photodetector shows a similar behaviour, although the coefficients of the cubic fit (see Table II) are about 3 times smaller than with the EM4 photodetector.
Although small compared to the overall phase variation, a hysteresis is clearly observable on Fig. 2: at the scan rate of 3 Hz, the "up" and "down" curves do not coincide. Sections V and VI will address more systematically the time dependence of the AM-to-PM coupling.
IV. THE RF PHASE VS APPLIED REVERSE BIAS
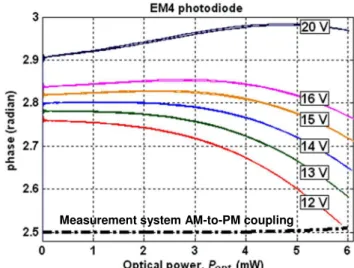
This study was not possible with the New Focus photodiode, which operates at a fixed value Vbias of the bias voltage. With the EM4 photodiode the Φ(Popt) dependence has been plotted in Fig. 3 for
different values of Vbias. One remarkable effect of changing Vbias is to continuously shift the optical power at which the AM-to-PM slope vanishes, from zero (at 13 V) to 5 mW (at 20 V). Thus, contrary to [9], obtaining a zero amplitude-to-phase coefficient does not imply reaching saturation of the photodiode.
Fig. 3. Static AM-to-PM characteristics at bias voltages of 12, 13, 14, 15, 16 and 20 V. EM4 photodiode. Data are not corrected for cross-talk.
As a temperature increase reduces carrier mobility [12], the temperature transient that, due to the Joule heating, follows an increase of the optical power is expected to give rise to phase increase of the microwave signal. This is what is observed in Sections V and VI, on the microsecond and millisecond transients that follow a change in optical power.
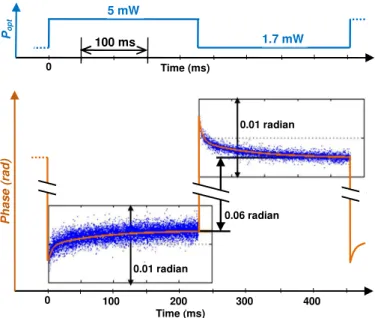
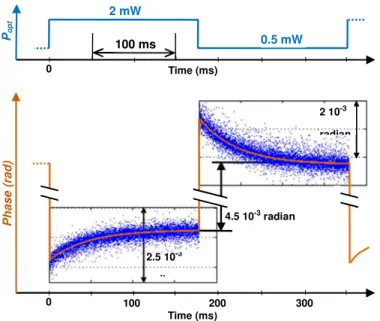
V. DYNAMICS OF THE AM-TO-PM COUPLING AT THE MILLISECOND TIME SCALE When the optical power is switched in less than 1 µs from low to high, both the EM4 and New Focus photo-detectors show
- an immediate phase change, as expected from the very fast shielding of the bias electric field by the charge carriers in the junction [3-8]
- "slow" (millisecond) phase transients revealing the junction's thermal evolution.
Fig. 4.Phase transient after a sudden change of the optical power. EM4 photodetector biased at 15 V. One data (blue point) is plotted every 15 µs, and corresponds to the phase value over a 10 µs time slot, averaged over 100 successive 450 ms cycles. In yellow: fitting curves, see below.
A. EM4 photodetector
With the EM4 photodiode the transients (Fig. 4) cannot be accurately described by a single exponential. As shown in Fig. 5 where the time scale is logarithmic, a better fit is obtained with
two exponential time constants. Note that in Fig. 5 data points before 50 µs are not accurate, as the data acquisition timing is not controlled to better than 15 µs. For quantitative data at the 10 µs time
scale, see Section VI.
Fig. 5. Blue: phase transients with the EM4 photodetector (same data as Fig. 4, with logarithmic time scale). Upper: rising; lower: falling optical power. In yellow: fitting curves with two exponential time constants. Dashed line, fitting curve with a single exponential. Data points before 50 µs are not reliable, due to the poorly controlled timing.
0.01 radian 0.01 radian 0.06 radian Time (ms) 0 100 200 300 400 Po p t 5 mW 1.7 mW 100 ms Time (ms) 0 P h a s e ( ra d )
B. New Focus photodetector
When applying a fast power change to the New Focus photodetector, the same kind of overshoot is observed (Fig. 6), although with somewhat different values.
Contrary to the EM4 photodetector, the transients are well fitted by a single exponential of 45 ms time constant and amplitude 10-3 radian (rising) and 1.6 10-3 radian (falling optical power).
Fig. 6: Phase transient with the New Focus photodetector (blue points). In yellow: exponential fits (see text).
Simulations in Section VI show that millisecond time scales can be found in the heating of a photodiode junction, depending on the geometry of the photodiode assembly.
VI. DYNAMICS OF THE AM-TO-PM COUPLING AT THE MICROSECOND TIME SCALE
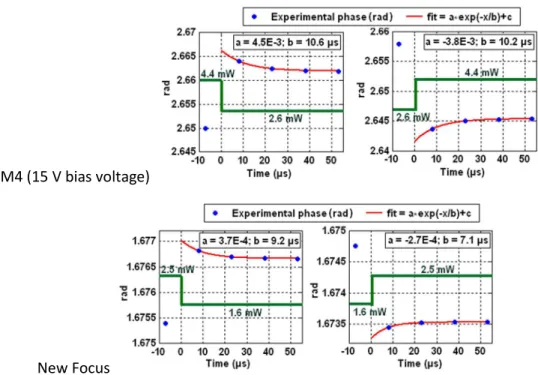
Although phase and amplitude values are acquired every 15 µs, we have been able to observe, after a sudden change of the optical power, a transient behaviour at the 10 µs time scale, shown in Fig. 7. To allow accurate and reproducible synchronization, the amplitude of the 160 MHz signal fed to the AOM is driven, not by a signal generator (as shown in Fig. 1) but by the FPGA phase meter itself.
As in the case of the static AM-to-PM (Fig. 3), the value of the applied bias voltage allows to control the amplitude of the effect. This is illustrated in Fig. 8, where the amplitude Φ53 8− , defined as the
difference between the phase data at 8 µs and 53 µs, is plotted against Vbias.
The temporal behaviour of the phase at the microsecond time scale is similar with the two photodiodes, and is similar to the transient expected for the junction temperature after the change of the Vbias×Iphoto dissipated power.
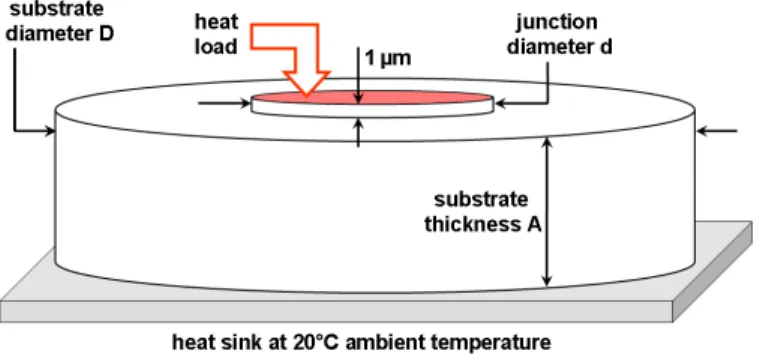
The finite element ANSYS software is used to simulate the temperature rise of the junction/substrate assembly (see the geometry in Fig. 9), assuming that the InP substrate,
2 mW 0.5 mW 2 10-3 radian 2.5 10-3 radian P h a s e ( ra d ) Po p t Time (ms) 0 100 200 300 Time (ms) 0 100 ms 4.5 10-3 radian
EM4 (15 V bias voltage)
New Focus
Fig. 7. Microsecond-scale transient behaviour of the phase after a sudden change of the optical power, for the two photodetectors under test. Data points are averaged over 4x10⁵ samples. Inset: values of the parameters of the exponential fit: amplitude (radians) and time constant (µs). Residues of the fit (RMS values) are of 1.2% and 0.4% for the EM4 and New Focus photodiodes, respectively.
with diameter 450 µm and thickness A=152 µm, is contacted with the photodiode junction, and with the photodetector case at ambient temperature. We assign the same thermal properties (conductibility and specific heat) to the junction and substrate, and calculate the temperature at different locations along the axis of the junction/substrate/heat sink assembly. We monitor the evolution of the temperature of the junction/ substrate contact, after the photocurrent Iphoto is switched on (with 500 ns rise time), for a duration of 550 µs, then switched off (with 500 ns fall time). The Joule dissipated power is assumed to be uniformly spread across the junction. A different mesh size is used in a sphere of 40 µm radius around the junction.
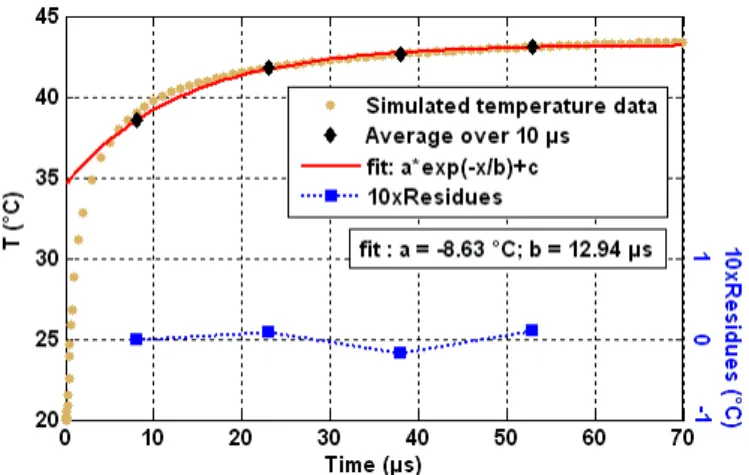
The software calculates the temperature with 1 µs time steps (smaller time steps are used for the first two microseconds). To account for the acquisition time sequence, we extract four temperature values, averaged over 10 µs time slots centred at 8, 23, 38 and 53 µs. From the exponential fit of the four data (Fig. 10) we obtain time constants of the order of 13 µs, in fair agreement with the experimental values.
Different checks have been done against possible problems with the convergence of the numerical calculations. A
Fig. 8. Dependence of the amplitude of the short time (µs) transient behaviour of the phase, measured with the EM4 photodetector, as a function of the applied bias. The optical power is switched between 3.6 and 6.0 mW.
Fig. 9: Geometry of the junction/substrate/heat sink assembly used for the simulations. Drawing is not to scale. The heat load is applied uniformly on the top side of the 1 µm thick cylinder that simulates the photodetector junction.
quantitative check of the numerical calculation is provided by the agreement, between
- the final temperature map T z r t( , , =500µs) of the values calculated by the transient solver of the ANSYS software, at a given depth z in the substrate
- the map Tstat( , )z r of the values calculated by the static configuration ANSYS solver
- and the values obtained by the formula
( , 0) ² ² ² ² ² Joule P T z r z a A a A z a κπ ∆ = = + − + + − ,
where
κ
=68 Jm-1K-1 is the thermal conductivity of InP [16], and/ 2
a=d is the radius of the junction. This formula holds on the cylindrical symmetry axis of the junction and substrate, assuming that the 450 µm substrate diameter is infinite as compared to the 32 µm junction diameter, and neglecting the 1 µm step size of the junction (see Fig. 9) and the dependence of
κ
with temperature [16]. When the 32 µm diameter junction is heated by a photocurrent of 6 mA under 15 V (heat load 112 W/mm2), thethree sets of data agree to better than 0.5 K, to be compared with the 25 K maximum temperature rise (see Table III). Other checks, based on energy conservation, also give confidence in the accuracy of the transient analysis calculations.
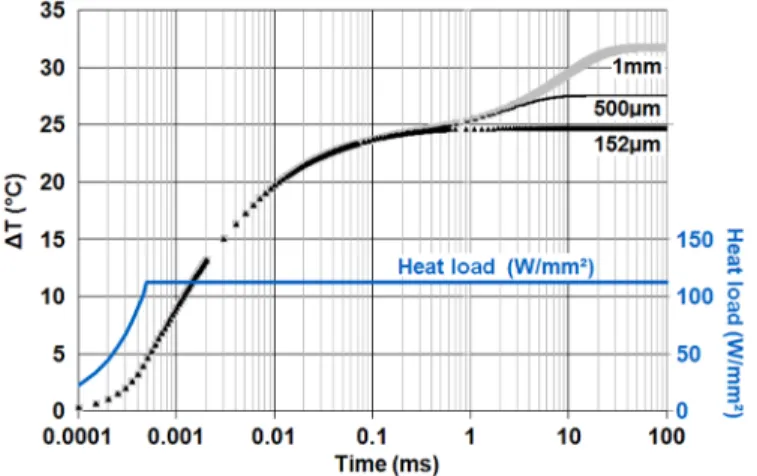
Fig. 10: results of the thermal transient simulation for the case of the EM4 photodiode, d = 32 µm, D = 450 µm, A = 152 µm (see geometry on Fig. 9), material conductivity 68 Wm-1K-1 and specific heat 0.31 Jg-1K-1. Heat load 112 Wmm-2, corresponding to a Joule power of (6 mA)x(15 V). Note the x5 factor for the right scale.
TABLE III
RESULTSOFTHESIMULATION
EM4 EM169 New Focus 1417
g e o m e tr y
exp. substrate 450 x 450 x 152 µm N/A
sim. substrate ∅ 450 µm, thickness 152 µm ∅ 450 µm, thickness 152 µm sim. junction ∅ 32 µm ∅ 25 µm Heat flux 112 W/mm² 33.4 W/mm²
Rise time, exp. 10.1 µs 7.1 µs
Rise time, simulation
Constant κ* 12.9 µs Constant κ* 12.6 µs Variable κ* 13.5 µs Variable κ* 12.6 µs
Fall time, exp. 10.6 µs 9.2 µs
Fall time, simulation
Constant κ* 13.4 µs Constant κ* 13.26 µs Variable κ* 13.2 µs Variable κ* 13.2 µs ΔTfinal (550 µs) Constant κ* 24.6 K Constant κ* 5.74 K Variable κ* 25.2 K Variable κ* 5.61 K ΔTstatic Constant κ* 24.7 K Constant κ* 5.75 K Variable κ* 25.4 K Variable κ* 5.63 K
* ’Constant κ‘: the ANSYS software solves the heat equations assuming that the conductivity κ is constant at 68 Wm-1K-1. ‘Variable κ’: the conductivity is assumed to vary with temperature according to 1.55
0 0
( )T ( )(T T T/ )
κ =κ [16].
The results depend weakly on the geometry of the junction/substrate assembly, for instance in a change from 450 to 2000 µm of the substrate diameter. Changing the substrate thickness from 152 µm to 500 µm or 1 mm does not change the temperature rise in the first 300 µs. However, calculations show (Fig. 11) that thick substrates give rise to a heating at long time scales (milliseconds). As they have the same sign as the microsecond transients, one can speculate whether the slow transients
presented in Section V are also due to thermal effects, depending on the thickness of the substrate or other element in the photodetector assembly. Lack of precise data from the manufacturers prevents from a quantitative modelling.
Fig. 11: Influence of the substrate thickness (152, 500 and 1000 µm) on the time dependence of thermal transients of the photodiode junction. Calculated for junction diameter 32 µm and substrate diameter 450 µm. Time scale is logarithmic, as in Fig. 5.
VII. WAYS TO REDUCE THE AM-TO-PM EFFECT
First, let us recall that correcting for AM-to-PM coupling can be done by numerical treatment of the data. This is a complexification of the data processing, but works quite well with static AM-to-PM, as it can be measured accurately beforehand. In the high accuracy range meter setup [14], raw measurements are severely affected by AM-to-PM coupling, which, if uncorrected for, gives rise to systematic deviations of 0.007 radian in the phase measurements for optical power variations of 0.35 mW. This appears on Fig. 13-a, where the power that reaches the photodiode changes due the variation of an interference effect. We have been able to correct for static AM-to-PM coupling to better than 3 %. For the transient effect, however, correcting the data using an exponential time dependence is not as accurate: residuals are of the order of 15 % of the systematic errors associated to the transient effect, and could not be completely eliminated in the ranging data of [14]. The residual errors and noise give rise to path length measurements which are shifted by +1 or -1 optical wavelength, as manifest on Fig. 6-b of [14]: 25% of the ranging measurements are wrong by ±1.5 µm, despite numerical correction of the data.
Thus it is important to look for ways to reduce AM-to-PM coupling, and designs for highly linear photodiodes [5, 7] have already brought significant improvement in AM-to-PM coupling in high signal strength photonic microwave generation.
Our approach follows a different idea. One has to keep in mind that, although it is called "amplitude to phase coupling", the consequence of the optical power reaching the photodiode is a time lag in the carriers generated in the junction,
- at picosecond time scales in Fig. 1 of [8] and Fig. 5 of [5], where pulsed lasers are used,
- or at the tens to hundreds of femtoseconds in our case, corresponding to phase shifts in the milliradian to tens of milliradians.
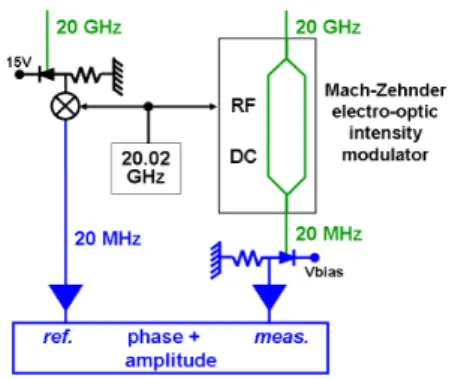
If the detection scheme involves microwave to intermediate frequency conversion using a mixer at the output of the high bandwidth photodiode, then a modification of the detection set-up allows to reduce the amplitude-to-phase coupling by the ratio of the microwave and intermediate frequencies, which is a large factor. As put forward and demonstrated in [17] in the context of optoelectronic phase lock loops, the modification consists in removing the mixer and using an intensity modulator before the photodiode (Fig. 12) to achieve the frequency transposition on the optical signal. Then the time shift remains the same (if the power reaching the photodetector is the same) but the detected modulation is at intermediate frequency. Hence the phase change is smaller by a factor which is the microwave to intermediate frequency ratio, in our case, 20GHz/20MHz = 1000.
Fig. 12: Detection set-up where optical demodulation replaces (on the measurement chain) electrical demodulation. Blue triangles: intermediate frequency amplifier.
We have checked that this detection scheme allows to strongly reduce AM-to-PM effects on the set-up of the range meter presented in [14], using the same EM4 EM169 photodiodes, with the same bias voltage. With optical demodulation, AM-to-PM coupling in the measurement photodiode was too small to be measurable. As shown on Fig. 13-b, systematic distortion of the signal was still observable, but at a level of 8×10⁻⁴ radian for a power variation of 4.1 mW. This is a reduction by almost an order
of magnitude, although the power variation is larger by an order of magnitude, as compared to Fig. 13-a. The residual phase systematic in Fig. 13-b is attributed to static AM-to-PM coupling in the intermediate frequency amplifier (blue triangle on Fig. 12) of the measurement chain, or in the data acquisition. More specifically, transient AM-to-PM coupling which was ≈ 3×10⁻³ radian in [14], was
reduced to less than 5×10⁻⁵ radian (despite the 10 times larger optical power change), a level for which
systematic correction for transient AM-to-PM is no longer required for the ranging measurements. An unexpected consequence of using optical demodulation is a lower electrical cross-talk between the reference and measurement chains (-80 dB) than with the setup of Fig. 1 (-60 dB). We believe that this is due to the absence of direct electrical link between the two measurement chains. These results confirm that the set-up of [14], with the addition of optical demodulation, is capable of high accuracy phase and amplitude measurements, as systematic errors associated with the detection chains are under control.
Fig. 13: Plot of the systematic error on the phase measurement (corrected for electrical cross-talk, but uncorrected for AM-to-PM coupling), in conditions where the optical power undergoes large variations with time, due to some interference effect. Each data point is averaged over 320 elementary data. The photodiodes are the same in the two graphs, with the same 15V bias. In (a) the setup uses electrical demodulation to convert the signal from microwave to intermediate frequency. Measurement conditions are the same as in [14], Fig. 6-a. In (b) the setup uses optical demodulation. Residual phase modulation is attributed to AM-to-PM coupling in the intermediate frequency amplifier (right blue triangle in Fig. 12). Note that vertical scales are different in (a) and (b).
By contrast, when no transposition to intermediate frequencies is possible, reduction of AM-to-PM coupling has to take advantage of the dependence on the different parameters, particularly optical power and applied bias voltage. It has been shown in Sect. IV that scanning the applied bias voltage allows to find conditions where the slope of the static AM-to-PM coupling cancels, an observation that is connected to the observations, in [5] and [8] of the influence of the applied bias when detecting mode-locked laser pulses. The transient AM-to-PM coupling can also be reduced by appropriate choice of the applied voltage, as shown in Sect. VI, Fig. 8. We have checked that a significant improvement can be obtained by switching the applied bias from 15 V to 7.5 V. We found that the systematic error associated with the static AM-to-PM coupling was reduced by a factor of 10. The transient AM-to-PM effect, however, was reduced by only a factor of 3: the improvement is real, but the residual transient AM-to-PM coupling, of the order of 3×10⁻⁴ radian for a detected power of 0.5 mW was still too large
for the goal of nanometric accuracy laser ranging [14]. This is why we implemented the optical demodulation, which proved successful, as described above.
VIII. SUMMARY
We present a quantitative investigation of the AM-to-PM characteristics of two commercial P-I-N InGaAs photodiodes, both as concerns the static and transient behaviours. The applied bias voltage appears to control the linear and quadratic coefficients of the stationary Φ vs Popt dependence, with the important consequence that one can adjust at will, through the applied bias voltage, the optical power at which the AM-to-PM slope cancels. Contrary to [9], no close link is found between the zero-slope and the saturation optical power. The multiple zeroes, expected and observed in the case of femtosecond pulses [5], [8], are not observed here. After a sudden change of the optical power, an immediate phase change occurs, followed by an opposite sign monotonous evolution of the phase at time scales between 10 µs and 1s. Qualitative agreement with results of numerical simulations suggests that the latter evolution involves the heating of the photodiode junction by the Joule dissipated power, and cooling by conduction through the InP substrate. Similar transients, known as "memory effects", have been reported in the context of the thermal management of power microwave amplifiers [18], but, to our knowledge, memory effects had not been reported previously for photodiodes. The transient effects we observe are typically an order of magnitude smaller than the static effects. This ratio is expected to be enhanced when detecting short pulses, such as in ref. [4, 5,
8]: for the same average optical power the peak power is considerably larger, which may explain why the AM-to-PM factors are larger, and why the transient effect has not been observed in [8].
Transient AM-to-PM takes place as soon as the detected optical power changes at microsecond time scales, or millisecond time scales as in "scintillation", the large intensity fluctuations that arise due to propagation over a long distance in a turbulent atmosphere. In the case where the photodiode receives, not only the microwave-modulated laser beam, but also another optical beam, we observe that any variation of the power of the latter will modulate the microwave detected phase. Both transient and static AM-to-PM effects depend on the applied bias voltage in a way which gives the opportunity to reduce the associated noise and systematics by operating at the appropriate bias voltage. Other ways to reduce the AM-to-PM effects, such as adapting the value of the optical power as suggested in [5, 8, 9], or reducing the microwave frequency may conflict with the considered application. Finally, we have modified the detection set-up to replace electronic demodulation by optical demodulation using a Mach-Zehnder electrooptical intensity modulator, placed before the photodiode. Then, static and transient AM-to-PM effects in the photodiode are reduced by the ratio of the intermediate-to-microwave frequencies, that is, by a very large factor. The systematic errors quoted in the ranging data of [14] have been considerably reduced, which confirms the validity of this detection scheme for reducing AM-to-PM. These results are important with respect to low noise and high accuracy phase measurements of microwave optical signals.
ACKNOWLEDGMENT
We thank F. Bondu for comments and suggestions.
REFERENCES
[1] G. C. Valley, "Photonic analog-to-digital converters," Opt. Express, vol. 15, no. 5, pp. 1955-1982, Mar. 2007.
[2] E. Rubiola, E. Salik, N. Yu and L. Maleki, "Flicker noise in high-speed p-i-n photodiodes," IEEE Transactions on Microwave Theory and Techniques, vol. 54, no. 2, pp. 816-820, Feb. 2006. DOI: 10.1109/TMTT.2005.863062
[3] E. N. Ivanov, S. A. Diddams, L. Hollberg, "Study of the excess noise associated with demodulation of ultra-short infrared pulses," IEEE Trans. Ultrason., Ferroelect., Freq. Control, vol. 52, no. 7, 1068-1074, Jul. 2005.
[4] M. Currie and I. Vurgaftman, "Microwave phase retardation in saturated InGaAs photodetectors," IEEE Photon. Technol. Lett., vol. 18, no. 13, pp. 1433-1435, Jul. 2006. DOI: 10.1109/LPT.2006.877552
[5] J. Taylor et al., "Characterization of Power-to-Phase Conversion in High-Speed P-I-N Photodiodes," IEEE Photonics J., vol. 3, no. 1, pp. 140-151, Feb. 2011.DOI: 10.1109/JPHOT.2011.2109703
[6] D. Kuhl D et al. "Influence of space charges on the impulse response of InGaAs metal-semiconductor-metal photodetectors," J. Lightw. Technol., vol. 10, no. 10, pp. 753-759, Jun. 1992. DOI: 10.1109/50.143074
[7] T. M. Fortier, F. Quinlan, A. Hati, C. Nelson, J. A. Taylor, Y. Fu, J. Campbell and S. A. Diddams, "Photonic microwave generation with high-power photodiodes," Opt. Lett., vol. 38, no. 10, pp. 1712-1714, May 2013. DOI: 10.1364/0L.38.001712
[8] W. Zhang, T. Li, M. Lours, S. Seidelin, G. Santarelli and Y. Le Coq, "Amplitude to phase conversion of InGaAs pin photo-diodes for femtosecond lasers microwave signal generation," Appl. Phys. B, vol 106, no. 2, pp. 301-308, Feb. 2012. DOI: 10.1007/s00340-011-4710-1
[9] D. Eliyahu, D. Seidel, and L. Maleki, "RF amplitude and phase-noise reduction of an optical link and an opto-electronic oscillator," IEEE Trans. Microw. Theory Tech., vol. 56, no. 2, pp. 449-456, Feb. 2008.
[10] K. Wu, C. Ouyang, J.H. Wong, S. Aditya and P. Shum, "Frequency response of the noise conversion from relative intensity noise to phase noise in the photodetection of an optical pulse train," IEEE Photon. Technol. Lett., vol. 23, no. 8, pp. 468-470, Apr. 2011. DOI: 10.1109/LPT.2011.2109060
[11] J. S. Paslaski, P. C. Chen, J. S. Chen, C. M. Gee and N. Bar-Chaim, "High-power microwave photodiode for improving performance of RF fiber optic links," Proc. SPIE, Photonics and radio frequency, vol. 2844, Denver CO, 1996, pp. 110-119.
[12] K. J. Williams and R. Esman, "Design considerations for high-current photodetectors," J. Lightw. Technol. vol. 17, no. 8, pp. 1443-1454, Aug. 1999.
[13] H. Chen, A. Beling, H. Pan, J. C. Campbell, "A Method to Estimate the Junction Temperature of Photodetectors Operating at High Photocurrent," IEEE J. Quantum Electron., vol. 45, no. 12, pp. 1537-1541, Dec. 2009. DOI: 10.1109/JQE.2009.2023609
[14] D. H. Phung, C. Alexandre, M. Lintz, "A two-mode interference measurement for nanometer accuracy absolute ranging," Opt. Lett., vol. 38, no. 3, pp. 281-283, Feb. 2013
[15] J. Fatome et al., "Multiple four-wave mixing in optical fibers: 1.5–3.4-THz femtosecond pulse sources and real-time monitoring of a 20-GHz picosecond source," Optics Communications vol. 283, no. 11, pp. 2425–2429, Jun. 2010. DOI: 10.1016/j.optcom.2010.01.057 [16] S. Adachi 1992, Physical properties of III-V semiconductor compounds InP, InAs, GaAs, GaP, InGaAs, and InGaAsP, pp. 55-60, (New
York: Wiley, 1992).
[17] J. Kim and F. X. Kaertner, "Attosecond-precision ultrafast photonics," Laser & Photon. Rev., vol. 4, no. 3, pp. 432-456, 2010. DOI: 10.1002/lpor.200910003
P. Roblin, D. E. Root, J. Verspecht, Y. Ko and J. P. Tessier, "New Trends for the Nonlinear
Trans. Microw. Theory Tech., vol. 60, no. 6, pp. 1964-1978, Jun. 2012. DOI: 10.1109/TMTT.2012.2193140