HAL Id: hal-00745109
https://hal.archives-ouvertes.fr/hal-00745109
Submitted on 24 Oct 2012
HAL is a multi-disciplinary open access archive for the deposit and dissemination of sci-entific research documents, whether they are pub-lished or not. The documents may come from teaching and research institutions in France or abroad, or from public or private research centers.
L’archive ouverte pluridisciplinaire HAL, est destinée au dépôt et à la diffusion de documents scientifiques de niveau recherche, publiés ou non, émanant des établissements d’enseignement et de recherche français ou étrangers, des laboratoires publics ou privés.
Indiscriminate Discrimination: A Correspondence Test
for Ethnic Homophily in the Chicago Labor Market
Nicolas Jacquemet, Constantine Yannelis
To cite this version:
Nicolas Jacquemet, Constantine Yannelis. Indiscriminate Discrimination: A Correspondence Test for Ethnic Homophily in the Chicago Labor Market. Labour Economics, Elsevier, 2012, 19 (6), pp.824-832. �10.1016/j.labeco.2012.08.004�. �hal-00745109�
Indiscriminate Discrimination: A Correspondence Test for Ethnic
Homophily in the Chicago Labor Market
∗Nicolas Jacquemet† Constantine Yannelis‡
July 2012
Abstract
Numerous field experiments have demonstrated the existence of discrimination in labor markets against specific minority groups. This paper uses a correspondence test to determine whether this discrimination is due to prejudice against specific groups, or a general preference for the majority group. Three groups of identical fabricated resumes are sent to help-wanted advertisements in Chicago newspapers: one with Anglo-Saxon names, one with African-American names, and one with fictitious foreign names whose ethnic origin is unidentifiable to most Americans. Resumes with Anglo-Saxon names generate nearly one third more call-backs than identical resumes with non Anglo-Saxon ones, either African-American or Foreign. We take this as evidence that discriminatory behavior is part of a larger pattern of unequal treatment of any member of non-majority groups, ethnic homophily.
Keywords: Correspondence testing, Discrimination, Ethnic homophily. JEL Classification: J71, J64.
1
Introduction
In both political science and economics, a growing strand of research highlights the implications of cultural heterogeneity on individual behavior and group ability to achieve efficient outcomes (e.g., Miguel and Gugerty, 2005; Putnam, 2007; Habyarimana, Humphreys, Posner, and Weinstein, 2009; Alesina and Ferrara, 2005, for a survey). The primary finding from these studies is that it is ethnic diversity per se that drives interactions between members of different ethnic groups. Economic research on ethnic diversity in the labor market has focused on identifying and accounting for
∗
This paper is an updated version of CES WP no 2011-13. We wish to thank the editor, Kevin Lang, two anonymous referees, Yannick L’horty, Phillip Oreopoulos, Amine Ouazad, Marie-Anne Valfort and participants at the Royal Economic Society meeting 2010 in Royal Holloway as well as to various seminars for their useful comments. This research was partly funded by the CEPREMAP. Jacquemet gratefully acknowledges the Institut Universitaire de France for its support.
†
Paris School of Economics and University Paris I Panthéon–Sorbonne. Centre d’Economie de la Sorbonne, 106 Bd. de l’Hôpital, 75013 Paris, France. Nicolas.Jacquemet@univ-paris1.fr.
‡
Department of Economics, Stanford University, 579 Serra Mall, Stanford, CA 94305-6072, United-States. yan-nelis@stanford.edu.
discrimination against pre-established groups with a history of discrimination, such as African-Americans in the United States (Bertrand and Mullainathan, 2004) or Asian immigrants in Canada (Oreopoulos, 2011). Most of these studies use the same methodology – correspondence testing, which is conducted by sending resumes that differ only in the name of the applicant. Strikingly, several correspondence tests targeting diverse groups in different countries have found similar levels of discrimination, with the majority of studies finding that minority groups need to send out 1.3 to 1.7 times as many resumes to generate the same number of callbacks as the majority group. As noted by Bendick (2007), this may suggest observed discrimination arises because of employers’ reluctance to hire people who differ from their “ideal”, rather than hostility towards a specific group. This paper is an attempt to empirically address this question, by assessing the role of ethnic homophily in hiring discrimination – i.e. that discrimination is directed against all non-majority groups rather than clearly identified minorities.1 We rely on a correspondence test involving three different groups of names. Anglo-Saxon and African-American names are used as controls, while our main treatment variable is a set of “Foreign” names with no clear ethnic association – such as e.g., Dziella Lousaper or Edona Sanatroug. The perceived ethnic origin of each set of names is established through a pre-experimental survey. We rule out potential gender bias by using resumes that clearly identify the job applicant as female. Three resumes, which only differ in the identified ethnic origin of the applicant, are sent to employers posting vacancies in Chicago and its suburbs – allowing a precise comparison with Bertrand and Mullainathan (2004) results.
Our main result is that Foreign names with an unknown perceived origin are almost as heavily discriminated against as African-American names, eliciting a third fewer call-backs than names identified as Anglo-Saxon. Once the sample is split according to the location of the employer, the observed discrimination appears to be larger in the suburbs (as compared to the city center), where ethnic diversity is lower due to the historical phenomenon of "white flight”. We take these results as evidence that ethnic homophily is one driving force of racial discrimination in the labor market. We conclude the paper with a discussion of open questions possibly challenging this interpretation.
2
Prior research on ethnic discrimination in the labor market
Economic models have traditionally focused on two mechanisms, taste-based discrimination and statistical discrimination.2 According to the original formulation due to Becker (1971), taste-based discrimination implies that employers have some given preference for one group over another.3 The model is taste-based in the sense that no explanation is given for employers’ inherent disutility for black labor.
The theory of statistical discrimination was initially proposed as an alternative to the theory
1
Our terminology comes from the similarity of this phenomenon to the driving forces of network formation, (e.g., Currarini, Jackson, and Pin, 2009)
2
We restrict ourselves to a brief presentation of the literature. See Lang and Lehmann (2011) for a detailed survey of both existing theories and their empirical relevance.
3
This preference can either take the form of a distaste for a particular group as in the original Becker model, or as a taste for one’s own group as in Goldberg (1982)
of taste-based discrimination. Discrimination is statistical in the sense that differences between groups are used by employers to distinguish between individuals. Arrow (1973) and Phelps (1972) formalized statistical discrimination as a response to imperfect information: employers use signals, such as race and ethnicity, to infer other individual attributes such as productivity, educational attainment or language skills. Assuming a risk neutral employer, Arrow lists three assumptions necessary for employers to discriminate: (i) employers must be able to distinguish between workers of various races at low-cost, (ii) employers must incur some cost before a worker’s true productivity is determined, and (iii) employers must have some preconception of the distribution of productivity among the categories of workers. Since beliefs about the mean qualities of various groups are then used to make statistical inference about applicants’ attributes on hiring decisions, discrimination arises. Note, employers are only concerned with hiring the best candidate, and do not have any intrinsic preference for one type of worker over another.
Our experiment does not seek to lend support to one model over another, since both could rationalize empirical evidence of ethnic homophily. In a framework of taste based discrimination, ethnic homophily would emerge if the distaste extends to anyone who does not belong to one’s own racial group. Such preferences could be imposed on the hiring process either by the employer’s themselves, or because of customer preferences. In a model of statistical discrimination, ethnic homophily happens if employers either infer bad characteristics on employees from unknown ethnic groups – because they gather those of unknown ethnic origin into a group with known mean and variance or they start with poor priors on either dimension – or are less confident about their ability to evaluate such workers. Either the aforementioned phenomenon or our analysis of ethnic homophily generalizes the empirical literature on hiring discrimination.
2.1 Empirical evidence of discrimination in the labor market
Early empirical literature used audit studies to attempt to measure racial discrimination. In audit studies, actors are thrown into real world social and economic situations, such as job interviews. Researchers observe the differences between two individuals who are nearly identical in all aspects with the exception of race, and then measure their performance. Most of these studies find that minority actors tend to perform worse in the hiring process (see Riach and Rich, 2002, for a survey of the literature). Audit studies have several major drawbacks. First, they are tremendously expensive. Second, sample sizes tend to be small. Third, since the actors know that they are in a study, there is some speculation that minority participants in audit studies would have psychological motivation to underperform (Bertrand and Mullainathan, 2004). Fourth, due to the nature of social interactions and infinite human variability, there will always be immeasurable differences between two actors other than race.
Correspondence testing, first developed in the United Kingdom by Jowell and Prescott-Clarke (1970), overcomes most of these issues. The experiment consists of sending out written requests for job vacancy listings, with variations in the applicants’ name. The method is much cheaper than audit testing and many laboratory experiments, thus allowing for larger sample sizes. It also gives the researcher nearly complete control over confounding factors in the experiment since the design
relies only on paper applications which differ in highly controlled ways. The main weakness of correspondence testing is that differences in job offers cannot be measured directly since companies generally have multistage recruiting processes, which eventually require personal interviews. Thus correspondence tests may under or overstate the level of discrimination for actual job offers, since success in job search is measured by callbacks rather than actual offers.4
To our knowledge, the first major correspondence test in the United States on discrimination is due to Bertrand and Mullainathan (2004), which elicited a wealth of similar studies. Their field experiment attempts to measure racial discrimination against African-Americans in two major American cities, using names as a marker of ethnic origin and the percentage of callback offers received as a measure of discrimination. Resumes with African-American sounding names elicit almost 50% fewer callback offers than the resumes with white sounding names. Using data on social background and name specific call-back rates, they also find little evidence of inferring social class from names.5 Last, they find a “marginally significant” but “extremely small” relationship between employers being located in postal codes with a higher percentage of African-Americans and call-backs for African-Americans. It is worth noting that this relationship is statistically significant for their data in Chicago.
Other studies find similar results in alternative labor markets. In Australia, Booth, Leigh, and Varganova (2012) rely on Anglo-Saxon, Indigenous, Italian, Chinese and Middle Eastern names, and find statistically significant evidence of discrimination. They also find significantly less prejudice against Italians, a more established immigrant group in Australia, as opposed to less established groups like Chinese and Middle Easterners. Bursell (2007) applies a similar methodology in the Swedish labor market, sending out resumes with either Arabic names or names from the Horn of Africa region, and finds that a person with similar characteristics but an Arabic or African name would have to apply to twice as many jobs in order to obtain a callback offer.
Oreopoulos (2011) conducts a field experiment with over 6,000 resumes to examine discrimi-nation against immigrants in the Canadian province of British Columbia. The resumes contrast English-named job-seekers with Canadian education and experience to similar candidates with Chi-nese, Indian, British and Pakistani names. A computer program randomizes various resume char-acteristics such as experience, time spent in Canada and the location where a bachelors degree was completed. This rich set of treatment variables leads to very detailed results relating discrimination to the social distance between applicants and the members of the dominant group. The four main results of the study are (i) English-named applicants with Canadian education are more than three times as likely to be offered an interview than Chinese, Indian or Pakistani-named applicants with foreign work experience, but there is no significant difference with British applicants, (ii) employers value experience in Canada much more than they value foreign experience, (iii) for resumes with substantial Canadian experience, whether the applicant has a Canadian degree or not has no
ef-4There are also ethical concerns, as sending out fake resumes or letters is a form of deception. See Riach and Rich
(2004) for a discussion.
5 The variance in callbacks between names is quite high in this study, suggesting that, as well as a general ethnic
effect, there is also a preference for specific names beyond unequal treatment over ethnic groups. We get back to this rather surprising result in Table 3 below.
fect on call-back offers, and (iv) Canadian applicants that differ only by name have substantially different call-back rates – English-named Canadians receive almost one and a half times as many call-back offers as those with Chinese, Indian or Pakistani names. This rate is quite similar to that found in Bertrand and Mullainathan between whites and African-Americans in the US.
Giuliano, Levine, and Leonard (2009) study the effect of manager race on the race of new hires using data from a large U.S. retail firm. They find that black managers tend to hire more blacks and fewer whites than non-black managers, and that Hispanic managers in areas with large Hispanic populations tend to hire more Hispanic workers. Giuliano, Levine, and Leonard discuss several possible explanations for the results, including the possibility that some workers have taste-based racial preferences, or nepotism, for members of their own group. In the same spirit, Duguet, Leandri, L’Horty, and Petit (2007) observe that applicants with family names of North African origin with Gallicized first names face substantially less discrimination amongst French employers than applicants with both North African first and last names, almost eliminating the difference in call-backs. Doleac and Stein (2012) also find evidence of discrimination against African-Americans in online sales using a similar test of callback responses.
Overall, field experiments show robust evidence for the existence of discrimination in the labor market against diverse ethnic groups in a wide range of countries.6 Despite the different dates, ethnic groups used and geographic regions, most studies find strikingly similar differences in callback rates between majority and minority groups – from 30% to 50% fewer callbacks for the minority group – and indicate that similar patterns of discrimination exist in various cities and countries among different groups. One possible unifying assumption is that such discrimination arises not only because of targeted unequal treatment against minorities, but also as the result of systematically different treatment of applications from outside one’s own ethnic group. Our experiment aims to test this hypothesis directly, by introducing a set of names which is clearly identified as non-majority, but is not associated with a particular ethnic group.
3
Experimental Design
We assess the existence and extent of ethnic homophily in the labor market, drawing heavily on the methodology of past experiments such as Bertrand and Mullainathan (2004) and Oreopoulos (2011). We create a bank of resumes and use them to answer job advertisements in the greater Chicagoland area. We use call-back rates as a binary measure of discrimination.
6
Some recent studies substantiate the existence of ethnic discrimination beyond the labor market. Correll, Park, Judd, and Wittenbrink (2002) use a videogame to demonstrate that subjects are quicker in deciding not to shoot an unarmed white target as opposed to an unarmed African-American target. Based on survey and audit data, Ayres, Vars, and Zakariya (2005) show that African-American cab drivers receive smaller tips than their Anglo-Saxon counter-parts. List (2004) uses evidence from the sports card trading market, and finds evidence of discrimination on both sides, although “consumer-side” discrimination is more pronounced than “seller-side” discrimination.
3.1 Set of names
The experiment relies on three sets of names. As a benchmark, we used one set of Anglo-Saxon sounding names and one set of African-American sounding names. We use different data sources in choosing first and last names for these sets. The bank of Anglo-Saxon and African-American first names is built using the names from the Bertrand and Mullainathan (2004) study which received the highest call-back rates. The frequency data for first names was taken from Chicago, measuring names given to babies born into different ethnic groups between 1974 and 1979. For the last names, we used frequency data from the US census indicating the most common last names among US racial groups to provide us with a bank of Anglo-Saxon and African-American family names. In assigning Anglo-Saxon last names we chose the most common family names for whites in the US according to the census. We also used US Census data indicating the most common African-American family names to assign African-American last names for our study, however we do not use any last names that are in the top 10 most common names for both white and African-American families.7
Our main treatment variable is the third set of names, which consists of names that are not clearly identifiable to Americans. We pick names that we believe are unidentifiable to Chicago based employers using ethnic groups that are relatively unknown in the Chicago area. To accomplish this task, a set of names is first created by randomly mixing Albanian, Armenian and Georgian first names. To create last names for this group we used male first names from the aforementioned ethnic groups. We removed any names with either a clear religious origin, such as Mari or Hidajete or which are common in the US such as Margaret or Sara. We deliberately chose groups which had a minimal presence in the Chicago area. Since these groups are quite small fractions of the population in the state of Illinois,8 we hypothesize that Chicago employers would be unable to recognize the origin of these names, and would simply determine them to be foreign and unfamiliar. With some abuse of language, we will refer to such names, that are clearly perceived as non-Anglo-Saxon but with an unknown origin, as the set of “foreign names”. Note that our experiment will not generate any reliable observations on the identity of the person in charge of hiring decisions. Our ethnic homophily interpretation of observed discrimination against this group of names thus relies on the assumption that the majority of hiring decisions in Chicago are made by whites.9
In order to ascertain that the general population does not have any prior associations with these names, a survey was conducted using Illinois college students.10 Although a survey of members of
7We used the Cook County Municipalities and Demographics survey, available from the Census Bureau at
www.census.gov.
8
In 2010, there were 7,130 Armenians and 12,111 Albanians (each representing less 0.1% of the population) and too few Georgians for publishable statistics according to the US Census Bureau’s American Community Survey (source: www.census.gov).
9 This assumption is in line with available statistics from the US census about the ethnicity of business owners:
9.5% of businesses in the state of Illinois and 16.4% of business in Cook county are owned by African-Americans in 2007.
10The students were undergraduates in the college of Liberal Arts and Sciences at the University of Illinois. Among
undergraduates, 87.1% are domestic students and 77.6% come from within Illinois, primarily the greater Chicago area (source: www.dmi.illinois.edu).
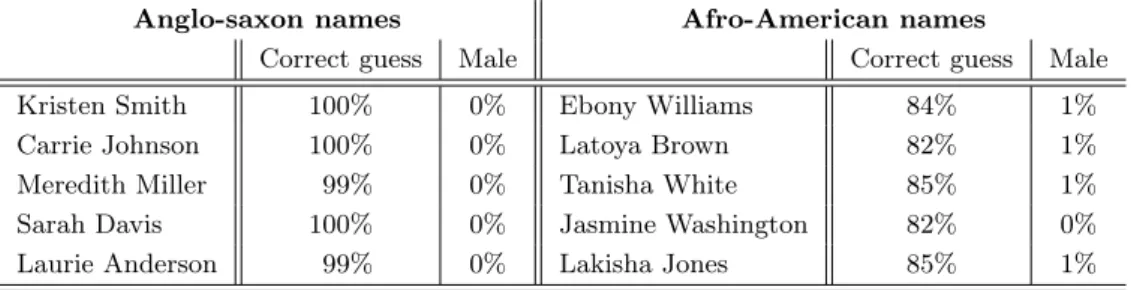
Table 1: Origins guessed from the initial survey
Anglo-saxon names Afro-American names
Correct guess Male Correct guess Male Kristen Smith 100% 0% Ebony Williams 84% 1% Carrie Johnson 100% 0% Latoya Brown 82% 1% Meredith Miller 99% 0% Tanisha White 85% 1% Sarah Davis 100% 0% Jasmine Washington 82% 0% Laurie Anderson 99% 0% Lakisha Jones 85% 1%
Foreign names
Guesses Perceived origin among guessing respondents Unknown Male Blank 1stMost Com. 2ndMost Com. 3rdMost Com. Dziella Lousaper 86% 1% 19% French 55% German 9% Spanish 9% Edona Sanatroug 85% 3% 23% German 27% Russian 10% Chinese 10% Sofiko Kushtrim 78% 23% 33% Russian 36% Indian 7% Dutch 7% Aferdita Dzaghig 75% 11% 21% Indian 17% African 6% Asian 6% Gadarine Besnik 75% 11% 19% Russian 33% Polish 27% Turkish 20%
Note. Origins elicited through the initial survey (based on 86 respondents) for the three sets of names included in the study. Upper part : share of correct guesses of both origin and gender for the Anglo-Saxon set and the African-American set.Bottom part : Results from the initial survey for the five names most often identified as from unknown origin. The first column shows the percentage of respondents leaving the field blank or filling in a question mark when asked to identify the ethnic origin of the name, the second column provides the percentage of respondents who declared that the name was female, and the third column provides the percentage of respondents who left the field blank. The ethnic group and frequency (computed among those who actually provided a guess) are displayed for the first, second and third most common guess.
human resource departments in various Chicago companies might be a more accurate measure of our sample’s biases, we use college students for two reasons. The first is ease, as it is much simpler to arrange a survey of college students. The second is that we worry about biasing the results of our experiment – it is plausible that the members of human resource departments in Chicago will see the names in the survey again at later stages of the experiment once resumes are sent out. There are several reasons why the abilities of Chicago employers and Illinois students to determine the ethnic origins of names might differ. On the one hand, employers have more time and resources (such as e.g., web searches) to find the information if they wish to elicit the origin of the names they see on applications. On the other hand, students are inserted in a more ethnically diverse environment, which is likely to make them better informed of cultural specificities. Such differences introduce some noise in our treatment variable, as actual perceptions may differ from the one we measure. Our experimental strategy relies on the assumption that there is no systematic difference between these two subsamples.
The survey mixes the Foreign sample of names with clearly identifiable Anglo-Saxon, African-American and other ethnic names. Survey respondents are asked to indicate to what group, if any, they associate the names. Respondents are also asked their guess for a gender associated with the name. One concern in identifying the names as foreign was to rule out random guesses of origins. We thus throw out for further use in the study any Foreign name for which more than a quarter of respondents identify the name with a particular group. Table 1 displays the results of the initial
survey as regards the set of fifteen names (five for each origin) used in the study. The upper part of the Table displays both perceived origin and perceived gender of Anglo-Saxon names and African-American names. In both regards and for both ethnic origins, the very high rates of correct guesses confirms ex post the strategy used to choose names: their high frequency in their corresponding origin suggests very accurate perceptions.
The bottom part of the Table provides a more detailed report of answers elicited as regards the five names most often identified as from unknown origin. For this group of names, we define as a correct guess answers either with a question mark or leaving the field blank. The first two columns show the gross results of the survey: the share of respondents that are unable to associate any origin to the name and the share that do not identify the name as female.11 A potential hazard
to our study is that in the set of foreign names, employers may be projecting their own beliefs on various names. While highly unlikely, it is not beyond the realm of possibility that in this case we are measuring extremely high rates of discrimination against other groups to which a minority of employers identify the names. To shed some light on the likelihood of this effect, the rightmost part of the table provides the guesses of respondents that did not classify the names as unknown. We observe highly diverse perceived origins for each name, with only one of them (Dziella Lousaper) being identified to the same origin by more than half the respondents who provide a guess. The Table also indicates that in general the names are not associated with non-white groups, making it unlikely that race was a factor in accounting for any observed discrimination. Based on this result, we consider that foreign names are not identified by the general Chicago population with any specific minority group.
3.2 Elicitation of employers’ responses
The experiment was carried out between August 20, 2009, and February 28, 2010, in Chicago, Illinois. We responded daily to job advertisements in the two major Chicago-area newspapers: the Chicago Sun-Times and the Chicago Tribune. Two screening rules are applied to answer advertise-ments in the study.12 First, we sought occupation categories that would not be heavily impacted by the 2008 financial crisis in order to have more call-backs. This led us to restrict offers to the fields of Health-care, Accounting and Information Technology. We moreover responded to any ad-vertisements that did not require personal appearances or telephone calls, and to which we had not already responded. We record the name of the employer, job title, the area of the company, any specific requirements indicated in the advertisement, whether or not the ad states that the company is an equal opportunity employer, whether or not the job is a government job, the date of the advertisement and where the company is based.
To design the applications, nine resumes (three for each field included in the study) of actual job seekers in the relevant geographic area – Chicago and surrounding suburbs, comprising the
11
The full results are available from the authors upon request.
12 This choice of the job posting source may induce a selection effect, if for instance ethnic minorities are less
likely to read and search for employment postings in The Chicago Sun-Times and the Chicago Tribune; or employers looking for foreign applicants rely on alternative communication devices.
greater Chicagoland area in Illinois, Wisconsin and Indiana – are submitted to job vacancy ads online.13 The resumes are modified to retain anonymity. We alter the names of various companies and educational institutions at which the job seeker has spent time, and we replace them with similar institutions in terms of standard qualitative rankings. Three resumes were sent to each advertisement: one with an Anglo-Saxon sounding name, one with an African-American sounding name and one with a Foreign name that should not be readily identifiable to the general populace. We cycle resumes – i.e., an equal number of each resume is associated with every set of names – to control for any biases in the perceived quality of the resumes. Resumes may be altered slightly to fit a particular advertisement, for example a particular skill may be added if it was requested in the advertisement. These alterations only occurred in the event that a specific skill was required in the job advertisements, and each resume sent out received the same alteration. Addresses were not included on the resumes to limit location-based inferences about the social class of the applicant. This should not lead employers to treat our applications differently, since initial correspondence for job offers is primarily done via phone and email.
Past experimental studies have indicated that substantial gender biases exist (see, e.g., Weich-selbaumer, 2004; Booth, Leigh, and Varganova, 2012; Bertrand and Mullainathan, 2004), female applicants being more likely to receive a callback offer. The effect is even more pronounced for minority applicants. To control for such biases, we seek to use only female names. However, this raises the obvious question that if the names we use are unfamiliar to Illinois residents, the same may well apply to the gender of these names. First, all of the resumes have some clear indicator of gender, such as a women’s achievement award or membership in some sort of women’s professional group. We also asked respondents of the initial survey to guess whether or not the name was male or female. For all of the names we used (Table 1), more than 90% of respondents either guessed that the name was female or left the field blank, indicating the names, although having unknown origins, appeared to be perceived as either female or unidentified.
4
Results
Overall, we sent 330 applications in response to 110 job vacancy advertisements. Roughly half, 49.4% of the jobs are located in the city of Chicago while the rest are located in the surrounding suburbs. The offers are fairly distributed across the sectors under study: 27.0% of the advertisements are in the IT sector, 32.1% in the nursing sector and the remaining 40.9% in are accounting. In this sample of employers, 3.3% mention that they are equal opportunity employers. Table 2 contrasts the callback rates we elicit with those from similar experiments, along with the ratios of callback between the socially dominant group and various minority groups.14 Two results emerge. First, we observe discrimination against foreign sounding names, which are not identified with any minority
13
We use resumes posted on www.bestsampleresumes.com.
14
Booth, Leigh, and Varganova (2012) also provide a detailed table of results from various studies not reported here, the results of which are broadly in line with other studies: the ratios range from 1.1 (Greeks in Australia in 1991) to 2.77 (Moroccans in France in 2007).
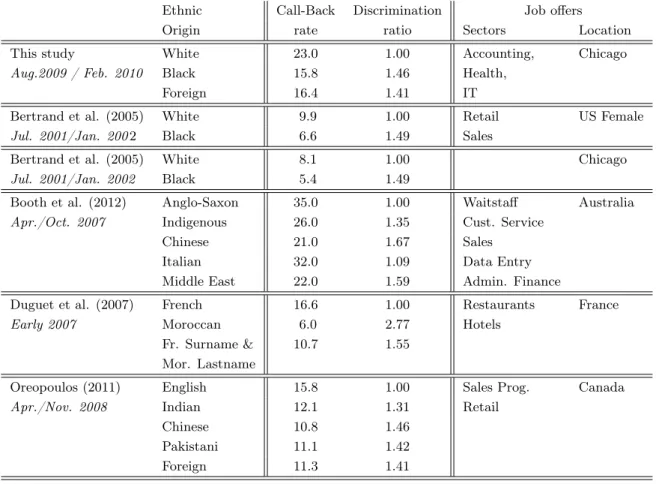
Table 2: Comparison with previously observed discrimination
Ethnic Call-Back Discrimination Job offers Origin rate ratio Sectors Location This study White 23.0 1.00 Accounting, Chicago Aug.2009 / Feb. 2010 Black 15.8 1.46 Health,
Foreign 16.4 1.41 IT
Bertrand et al. (2005) White 9.9 1.00 Retail US Female Jul. 2001/Jan. 200 2 Black 6.6 1.49 Sales
Bertrand et al. (2005) White 8.1 1.00 Chicago Jul. 2001/Jan. 2002 Black 5.4 1.49
Booth et al. (2012) Anglo-Saxon 35.0 1.00 Waitstaff Australia Apr./Oct. 2007 Indigenous 26.0 1.35 Cust. Service
Chinese 21.0 1.67 Sales Italian 32.0 1.09 Data Entry Middle East 22.0 1.59 Admin. Finance
Duguet et al. (2007) French 16.6 1.00 Restaurants France Early 2007 Moroccan 6.0 2.77 Hotels
Fr. Surname & 10.7 1.55 Mor. Lastname
Oreopoulos (2011) English 15.8 1.00 Sales Prog. Canada Apr./Nov. 2008 Indian 12.1 1.31 Retail
Chinese 10.8 1.46 Pakistani 11.1 1.42 Foreign 11.3 1.41
Note. Overview of academic studies using correspondence testing to measure ethnic discrimination. The first column indicates the author(s) of the study. The second column lists the ethnic group included. The next two columns provide the callback rates that the ethnic group received along with the ratio of callbacks between minority groups and the majority group – which is the one that appears first in the list of ethnic origins for each study. The last two columns describe the sectors the study examined and the location where the testing was performed.
group; and the callback ratio is very similar to the one we observe in the benchmark. Second, the difference in call-backs elicited between Anglo-Saxon sounding names and names associated with a clearly identified minority are in line with other experiments across the globe. In particular, our 1.46 callback ratio between black and white is very close to the one elicited by Bertrand and Mullainathan (2004), who found 1.49 – this study is in our view the best benchmark for the reliability of our design, since it focuses on the same two ethnic groups, in the same geographic area.15
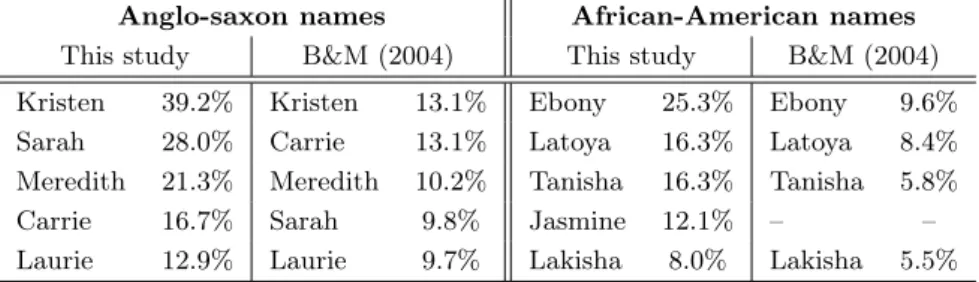
We present a more precise comparison with existing results in Table 3. We rank the first names used in our study from the highest call-back rate to the lowest, along with an extract of Bertrand and Mullainathan (2004)’s results for the first names we used as well. Our overall callback rates are higher than those of Bertrand and Mullainathan (2004), which can be attributed to the fact that we selected sectors in which there was high labor demand. Strikingly, when the same first names are used, the order in which names received callbacks is nearly the same in both studies. This holds true within both the white and black groups of names. This is even more significant given
15
Table 3: Identified origins: first names ranked by call-backs
Anglo-saxon names African-American names This study B&M (2004) This study B&M (2004) Kristen 39.2% Kristen 13.1% Ebony 25.3% Ebony 9.6% Sarah 28.0% Carrie 13.1% Latoya 16.3% Latoya 8.4% Meredith 21.3% Meredith 10.2% Tanisha 16.3% Tanisha 5.8% Carrie 16.7% Sarah 9.8% Jasmine 12.1% – – Laurie 12.9% Laurie 9.7% Lakisha 8.0% Lakisha 5.5%
Note. Call-Backs elicited by first names from “identified” origins, ranked in increasing order. The data for the Bertrand and Mullainathan (2004) (B&M) study are taken from their Table 8.
the fact that there is a statistically significant difference in the within group callbacks for several names.16 This may suggest that there exists some favouritism for certain given names beyond simple unequal treatment over ethnic groups. Such arbitrariness based on names from employers may be an important source of noise in our between groups results.
4.1 Evidence of general ethnic homophily
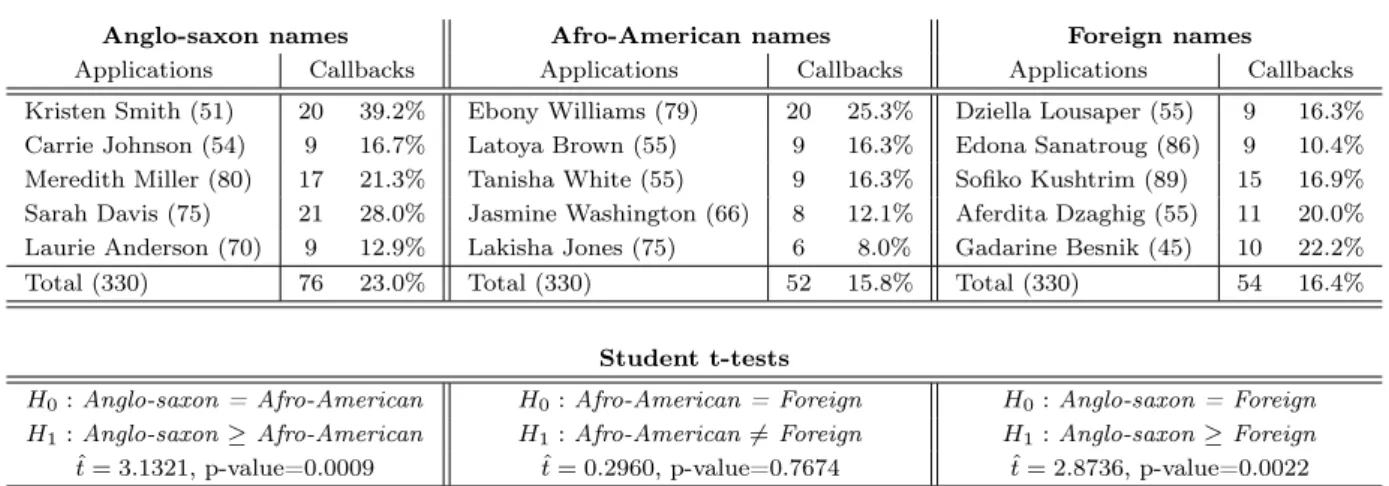
Table 4 contains a more detailed summary of the results from our experiment, providing call-back rates for each name included in the study (sorted according to the guess rates provided in Table 1), organized by ethnic origin. Overall, Anglo-Saxon names generate far more callbacks than both African-American and Foreign names. Focusing on our baseline sets of names, resumes with Anglo-Saxon names have a 23% call-back rate compared to 16% for African-American. The bottom part of the Table displays the results of t-tests of two by two callback rate comparisons. We strongly reject (with p-value equal to 0.0009) the assumption that callbacks are the same as those elicited by Anglo-Saxon names, against the alternative that applications with Anglo-Saxon sounding names have better odds of obtaining a positive answer. African-American names are very likely to be identified as such by potential employers. Foreign names, by contrast, were intentionally chosen so that they are not associated with any identified group by employers, except for the fact they clearly sound exotic. Based on observed callbacks, we confirm our hypothesis that resumes with such names do face discrimination. On average, applications from this set of names obtain a positive call-back in 16.4% of cases. Again, we strongly reject the hypothesis of equal callbacks with Anglo-Saxon sounding names (with p-value equal to 0.0022).
The callbacks elicited by African-American and Foreign names moreover appear similar. As shown in the middle column of Table 4, the data are unable to reject the assumption of same mean callbacks between the two origins (p-value of 0.7674). Of course, such statistically insignificant differences can either reflect that there is actually no difference in callbacks between the two non Anglo-Saxon origins, or that our experiment lacks the statistical power required to identify it.
16p-values of the joint chi squared-test of equal means are 0.009 for the Anglo-Saxon group, 0.0559 for the
Table 4: Experimental Results
Anglo-saxon names Afro-American names Foreign names
Applications Callbacks Applications Callbacks Applications Callbacks Kristen Smith (51) 20 39.2% Ebony Williams (79) 20 25.3% Dziella Lousaper (55) 9 16.3% Carrie Johnson (54) 9 16.7% Latoya Brown (55) 9 16.3% Edona Sanatroug (86) 9 10.4% Meredith Miller (80) 17 21.3% Tanisha White (55) 9 16.3% Sofiko Kushtrim (89) 15 16.9% Sarah Davis (75) 21 28.0% Jasmine Washington (66) 8 12.1% Aferdita Dzaghig (55) 11 20.0% Laurie Anderson (70) 9 12.9% Lakisha Jones (75) 6 8.0% Gadarine Besnik (45) 10 22.2% Total (330) 76 23.0% Total (330) 52 15.8% Total (330) 54 16.4%
Student t-tests
H0: Anglo-saxon = Afro-American H0: Afro-American = Foreign H0: Anglo-saxon = Foreign
H1: Anglo-saxon ≥ Afro-American H1: Afro-American 6= Foreign H1: Anglo-saxon ≥ Foreign
ˆ
t = 3.1321, p-value=0.0009 t = 0.2960, p-value=0.7674ˆ ˆt = 2.8736, p-value=0.0022 Note. The bottom part summarizes final results from the experiment for the Anglo-Saxon set of names (left-hand side), the African-American set of names (middle part ) and the set of Foreign names (right-hand side). For each set, the first column provides the name of the applicant along with the number of applications, the second column shows the number and share of applications that received a request for further information or a meeting. The bottom part of the Table provides t-tests testing the assumption H0of equality in mean callbacks elicited by different ethnic origins, against the alternative H1.
These results provide evidence of discrimination, since the design of the experiment guarantees that resumes are identical except for the perceived origin of the applicant’s name: in order to generate the same number of call-backs as Anglo-Saxon named applicants, potential applicants with African-American or Foreign names will have to send forty percent more resumes. While this cannot be translated directly into fewer job opportunities – since we have no data on interview success – this puts non-Anglo-Saxon job applicants at a distinct disadvantage in the labor market.
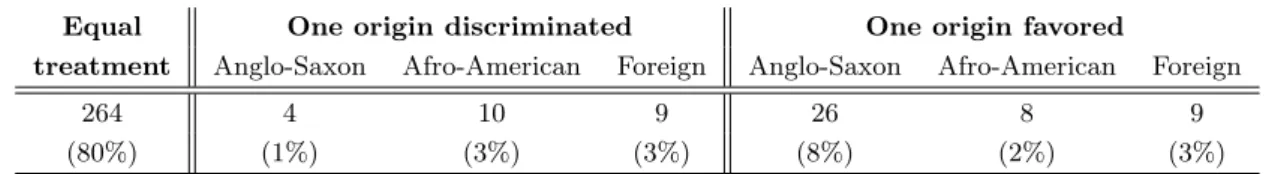
Table 5 provides a complementary look at the output from the experiment, focusing on the extent, or lack thereof, of discrimination faced by the various types of applicants. Most employers treat all three applications they received from us in the same way, either calling back all three can-didates or disregarding them all. This group of firms should not be regarded as non-discriminating, but rather as firms for which the experiment fails to provide evidence about discriminating behavior. In this group of firms, 31 (9.39% of all employers) treat our applicants equally by calling them all back – for these firms, the quality of our applications is thus attractive enough to overcome the possible will to discriminate. For the remaining 233 (70.6%), none of our applications manages to elicit a callback – which means we do not observe the forces driving decision making in these firms. The identification of discriminatory behavior in the experiment solely relies on observed unequal treatment depending on the name of the applicant. Our evidence of discrimination hence comes from 20% of all employers included in the study. Among this group, exogenous variations in the quality of the resumes should induce a uniform distribution of employers across the cells of the Table. This is not what we observe.
When only one of three resumes does not receive a callback, which occurs in 23 cases, 4 employers exclude the Anglo-Saxon applicant, 10 exclude the African-American applicant and 9 exclude the Foreign applicant. This phenomenon is much more pronounced if we look at those employers that call back only one applicant out of the three: among discriminating employers, nearly two-thirds (26
Table 5: Discrimination intensity from employers
Equal One origin discriminated One origin favored
treatment Anglo-Saxon Afro-American Foreign Anglo-Saxon Afro-American Foreign
264 4 10 9 26 8 9
(80%) (1%) (3%) (3%) (8%) (2%) (3%)
Note. The Table reports how employers treated the three applications received from us: equal treatment (callbacks or no answer for all three origins), or favoritism towards one origin (middle part ) – in the form of a call-back for only one application out of the three – or discrimination against only one origin (right-hand side) – in the sense that all names receives a callback except for one application. The first row refers to the number of employers, the second one to the share among all employers that received applications.
out of 43) give a callback to the Anglo-Saxon name only and disregard any exotic sounding name. This represents three times the number of employers that favor only either the African-American or the Foreign application. Again, we observe equal treatment of African-American and Foreign sounding names.
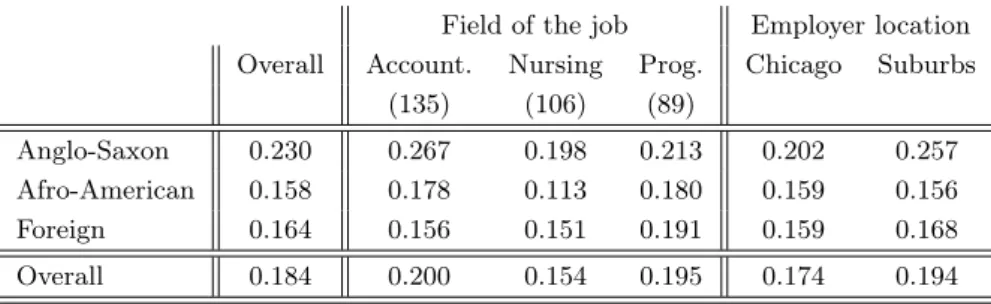
Table 6 disaggregates the results according to the field of the job and the geographic location of the employer. Since we send three resumes to each ad, we have the same number of applications from each origin in each field (the number of applications appears in parenthesis in each column’s title). Whatever the field, Anglo-Saxon applications receive the larger share of call-backs. Fields are ranked according to the discrimination ratio between the Anglo-Saxon and the non Anglo-Saxon sounding names. While the discrimination ratio is quite large in accounting, we observe almost no difference between ethnic origins for applications in programming occupations. This difference is very unlikely to be explained by differences in tightness across occupation specific labor markets.17 One difference between the programming sector and both accounting and nursing is that employees in the programming sector are less likely to be in direct contact with customers.
To explore further potential heterogeneity in employer’s behavior, the right-hand side of Table 6 distinguishes callbacks elicited by each origin depending on the location of the potential employer. Using a t-test, we cannot say that call-backs are significantly lower for Anglo-Saxons as opposed to other groups in the city of Chicago (the p-value for equal means with non-Anglo-Saxons is 0.1710), while we can say that call-backs are significantly higher for Anglo-Saxons than other groups in the suburbs – p-values of t-tests of equal means are 0.0055 against non-Anglo-Saxons, 0.0032 against African-Americans and 0.0092 against foreign names. Last, we find no statistically significant difference between African-American and Foreign applications, but we caution that the lack of a statistically significant difference may simply reflect a small sample size – the respective p-values of equal means t-tests are 0.9859 for Chicago, 0.6623 for suburbs. Once we break down the results by geographic area, nearly all of the discrimination that we see hence comes from employers in the Chicago suburbs as opposed to the city center.
17
According to the 2009 Occupational Employment Statistics from Bureau of Labor Statistics, the unemployment rate is 4% for computer programmers and interactive media developers, 2.9% for nurses and 2.2% for accountants, while it is 7% on the average for professional occupations.
Table 6: Callbacks by field, location and guesses
Field of the job Employer location Overall Account. Nursing Prog. Chicago Suburbs
(135) (106) (89)
Anglo-Saxon 0.230 0.267 0.198 0.213 0.202 0.257 Afro-American 0.158 0.178 0.113 0.180 0.159 0.156 Foreign 0.164 0.156 0.151 0.191 0.159 0.168 Overall 0.184 0.200 0.154 0.195 0.174 0.194
Note. For each origin in row, the first column recalls the overall call-back rates elicited by the corresponding applications. The next three columns provides the call-backs by field of the job vacancy advertisement (total number of applications appears in brackets in the title of the column): accounting, nursing, programming. The next two columns distinguish call-backs based on the geographic location of the potential employer. The last three columns report the correlation between call-backs and the correct guesses of origin for the corresponding name we elicited in the survey.
4.2 Summary of the results
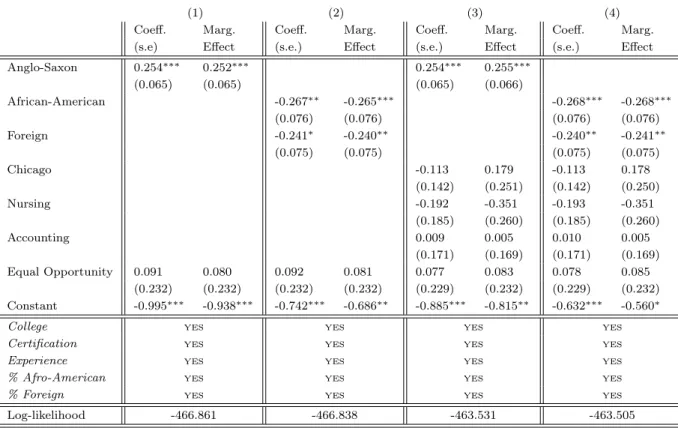
We assess the overall significance of our results using Probit regressions on callbacks. The main variables of interest are dummies for the origin of the applicant. In all estimated equations, we include controls for employers and job vacancy advertisement characteristics. We use dummy vari-ables indicating whether a bachelors degree, certification or experience is mentioned as a necessary prerequisite for the job. We also include a measure of the ethnic diversity of people living in the geographic location of the employer, through the percent of African-Americans and foreign born individuals respectively living in the geographic area in which the job is located.18 The data was col-lected at the city or town level from the US Census American Community Survey in 2009. Last, to increase the robustness of our results to possible job vacancy advertisement specificities, we cluster the standard errors at this level.
Table 7 shows the estimation results on the full sample of applications. To further condition our results on the characteristics of the employer, we also include a dummy variable indicating whether the vacancy advertisement states that the company is an equal opportunity employer.19 The first model contrasts callbacks of Anglo-Saxon sounding names with the other two origins, and the second one estimates separately the effect of African-American sounding names and Foreign sounding names. Both regressions confirm our main result. Having an Anglo-Saxon name has a positive effect on eliciting a call-back and both other origins are negatively correlated (with comparable marginal effects) with callbacks. In models (3) and (4) we further include controls for the location (city/suburb) and the sector in which the job is offered. Again, discrimination by origin appears robust to this inclusion.
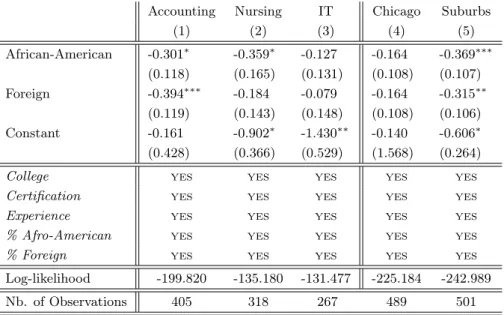
In Table 8, we explore the differences across locations and sectors, through separate estimations.
18
We caution that the share of foreign born residents is a very noisy measure of the share of unidentified minorities, as for instance roughly half (48.4%) of foreign born residents in Illinois were born in Latin America in 2007, and 22.8% were born in Europe. It is likely that employers have good perceptions of the origin of such large minorities.
19
In all specifications, we observe no difference according to this characteristic – our evidence on this point however is very weak, as only 3% of all employers included in the sample fall in this category.
Table 7: Probit regressions on callbacks
(1) (2) (3) (4)
Coeff. Marg. Coeff. Marg. Coeff. Marg. Coeff. Marg. (s.e) Effect (s.e.) Effect (s.e.) Effect (s.e.) Effect Anglo-Saxon 0.254∗∗∗ 0.252∗∗∗ 0.254∗∗∗ 0.255∗∗∗ (0.065) (0.065) (0.065) (0.066) African-American -0.267∗∗ -0.265∗∗∗ -0.268∗∗∗ -0.268∗∗∗ (0.076) (0.076) (0.076) (0.076) Foreign -0.241∗ -0.240∗∗ -0.240∗∗ -0.241∗∗ (0.075) (0.075) (0.075) (0.075) Chicago -0.113 0.179 -0.113 0.178 (0.142) (0.251) (0.142) (0.250) Nursing -0.192 -0.351 -0.193 -0.351 (0.185) (0.260) (0.185) (0.260) Accounting 0.009 0.005 0.010 0.005 (0.171) (0.169) (0.171) (0.169) Equal Opportunity 0.091 0.080 0.092 0.081 0.077 0.083 0.078 0.085 (0.232) (0.232) (0.232) (0.232) (0.229) (0.232) (0.229) (0.232) Constant -0.995∗∗∗ -0.938∗∗∗ -0.742∗∗∗ -0.686∗∗ -0.885∗∗∗ -0.815∗∗ -0.632∗∗∗ -0.560∗
College yes yes yes yes
Certification yes yes yes yes
Experience yes yes yes yes
% Afro-American yes yes yes yes
% Foreign yes yes yes yes
Log-likelihood -466.861 -466.838 -463.531 -463.505 Significance levels. ∗5%,∗∗1%,∗∗∗0.1%.
Note. Probit regressions on call-back rate. Origins, location and field of the job vacancy advertisement are measured as dummy variables. Dummy variables are also added indicating: whether or not the vacancy advertisement indicates a bachelors degree, certification or experience is a necessary prerequisite for the job, and whether the ad states that the company is an equal opportunity employer. The variables % Afro-American and % Foreign measure the percent of African-Americans and of foreign born residents living in the geographic area (defined at the city or town level) in which the job is located. Standard errors are reported in parentheses and clustered at the level of the job vacancy advertisement. The number of observations is N = 990 in all specifications.
Models (1 ) to (3 ) focus in turn on the subsamples of each sector in which jobs are offered. As already mentioned, we observe a clear ordering between the three sectors: most discrimination against non-Anglo-Saxons comes from offers in accounting, while no discrimination at all arises in programming. The results for the nursing sector highlight some misalignment between non-Anglo Saxon names: African-American applications elicit notably less callbacks than foreign ones – the foreign dummy even turns out to be insignificant once we account for controls.
Models (4 ) and (5 ) split the sample according to the location of the job posting. Recall all estimation results are conditional on the ethnic diversity of the location, defined at a narrower level than the suburb/city proper distinction. We confirm a contrast between the city center and suburbs: ethnic origin variables turn out to be insignificant in the city proper, while they are statistically significant in the suburbs. Such a correlation between suburbanization and discrimination is con-sistent with the sociology induced by the historical development of suburbs in the United States. The impetus for the expansion of many Chicago suburbs is that former city residents fled the city center once non-white ethnic groups moved into Chicago. This phenomenon of “white flight” – white
Table 8: Probit regressions on callbacks
Accounting Nursing IT Chicago Suburbs (1) (2) (3) (4) (5) African-American -0.301∗ -0.359∗ -0.127 -0.164 -0.369∗∗∗ (0.118) (0.165) (0.131) (0.108) (0.107) Foreign -0.394∗∗∗ -0.184 -0.079 -0.164 -0.315∗∗ (0.119) (0.143) (0.148) (0.108) (0.106) Constant -0.161 -0.902∗ -1.430∗∗ -0.140 -0.606∗ (0.428) (0.366) (0.529) (1.568) (0.264)
College yes yes yes yes yes
Certification yes yes yes yes yes Experience yes yes yes yes yes % Afro-American yes yes yes yes yes % Foreign yes yes yes yes yes Log-likelihood -199.820 -135.180 -131.477 -225.184 -242.989 Nb. of Observations 405 318 267 489 501
Significance levels. ∗5%,∗∗1%,∗∗∗0.1%.
Note. Separate probit regressions on call-back rate for each subsample described in column. Origins are measured as dummy variables. Dummy variables are also added indicating: whether or not the vacancy advertisement indicates a bachelors degree, and whether or not certification or experience is a necessary prerequisite for the job. The variable % Afro-American and % Foreign measure the percent of African-Americans and of foreign born residents living in the geographic area (defined at the city or town level) in which the job is located. Standard errors are in parentheses and clustered at the level of job vacancy advertisement.
families choosing to leave an area once black families begin to move in – is well documented in the sociological literature in the United States (Crowder, 2000). As a result, whites are a plurality with 37.6% of the population in the city of Chicago, whereas whites are 78.1% of Cook County excluding Chicago.20 Whites are thus more prevalent in the Chicago suburbs when compared to the city of Chicago itself, which is extremely diverse and in which no racial group has an absolute majority. What is more, many residents of suburbs who moved there due to the “white flight” phenomenon live in the suburbs precisely because they wanted to live in communities made up primarily of their own ethnic group. Self-selection into geographic areas may hence reinforce favouritism towards the dominant ethnic group in the suburbs.21 Furthermore Ellwood (1986) has shown that, while ethnic enclaves exist in the city of Chicago, geographic mismatch between blacks and potential jobs is not a major-cause for black-white differences in employment outcomes.
While the city-suburb difference rests on a relatively small sample size, this finding fits with an existing literature in economics on suburban and central city employer preferences. Holzer and Ihlanfeldt (1998) find that the racial composition of an establishment’s customers has an effect
20
Our source is the US Census. Note, these numbers include Hispanic whites, who are also considered a separate minority group. If we consider only non-hispanic whites, whites make up 30.6% of the city’s population, being the second largest ethnic group after non-Hispanic African-Americans at 34.7% of the population.
21
It is worth noting that Bertrand and Mullainathan failed to find any relationship between zip-codes and the percentage of African-Americans in that zip-code. However, zip-codes may not be the best proxy to measure racial differences in areas as postal zip codes do not measure any real boundaries between community zones in Chicago.
on the race of new hires, particularly in jobs that involve more contact with customers. Our findings are consistent with Holzer and Ihlanfeldt (1998) on both of these accounts. Positions in accounting and nursing may involve more contact with customers than those in programming, which may explain why we see a larger gap in these fields. We would also expect that in the suburbs, which are predominantly white, more customers would be white and hence in the face of customer discrimination, firms would tend to hire more white workers. Holzer (1996) shows that the ratio of new hires to job applicants for blacks is significantly lower in suburban establishments as opposed to those in the city center, which is consistent with our finding that applicants with Anglo-Saxon names receive more callbacks in suburbs. Stoll, Holzer, and Ihlanfeldt (2000) also show that the ability of ethnic groups to gain employment in an area depends heavily on the ethnic composition of the area. Specifically in Chicago the percentage of black workers declines with physical distance from major black neighborhoods. Raphael, Stoll, and Holzer (2000) using a difference in difference methodology find that both black and white owned suburban firms hire fewer blacks than firms located in city centers. Suburban black firms also hire more black workers than suburban white firms. These findings are broadly consistent with our findings and consistent with the hypothesis of ethnic homophily.
As well as customer discrimination, the composition of firms may also explain differences between the city and suburbs. Stoll, Raphael, and Holzer (2004) find firms with black hiring agents are considerably more likely to hire black applicants. Bendick, Jackson, and Reinoso (1994) also find, in an audit study, that black hiring agents are less likely to discriminate against applicants and that the effect of discrimination are greater in the suburbs, where black applicants are more likely to face white employers. Lack of access to transportation has been shown by Bollinger and Ihlanfeldt (2003) and O’Regan and Quigley (1999) to be a channel through which minority workers face disadvantages in the suburban labor market, although our findings show that discrimination does also play a role in city-suburban differences.
5
Conclusion
This paper relies on a correspondence test in Chicago to measure the extent of ethnic homophily in the labor market. We sent 990 resumes to different employers with three sets of names: Anglo-Saxon and African-American names are used as controls, while the main treatment variable is a set of “Foreign” names that are not clearly identified with any specific origin by the general population. The design of the experiment contrasts discrimination faced by clearly identified minority groups with discrimination suffered by applicants for whom employers have no specific belief or taste – except for the fact that the name is clearly atypical.
We find that resumes with African-American and Foreign names receive one third fewer callbacks than resumes with Anglo-Saxon names. The rate at which resumes with foreign names receive callbacks is moreover very similar to the rate obtained by African-American names. This result is also somewhat substantiated by the geographic pattern of discrimination: the largest part of observed discrimination comes from the suburbs, where whites are a clear majority, while we do
not find any significant difference in the rate of callbacks in Chicago proper, an extremely diverse city where non-Hispanic whites are a minority group. We interpret theses results as evidence that ethnic homophily plays a role in racial discrimination on the labor market – i.e., anyone who is not a member of one’s own ethnic group is treated differently. One consequence of this result is that any migration flows of people coming from geographic areas that are unknown to most residents would face discrimination in the labor market. In the policy sphere, this may turn attention to programs that rule out as much name identification as possible in the job matching process, such as for instance mandatory anonymity of resumes (see Goldin and Rouse, 2000; Fershtman, Gneezy, and Verboven, 2005, for empirical evaluations of the performance of this kind of rule in alternative contexts).
Our results leave open a number of unsolved questions about the specific reasons that underlie ethnic homophily. First, as suggested by the post-experimental interviews described in Oreopoulos (2011), language skills could be an important driving force of employers’ negative inferences about the productivity of non-Anglo-Saxon applicants. For example, employers may be concerned that job-seekers with non-English sounding names may speak accented English or be unfamiliar with American culture and customs. Second, even if the discrimination against foreign applicants is statistical in nature, our results cannot distinguish whether this is due to the inference of lower av-erage characteristics or a perceived greater variance in the characteristics of members of an unknown ethnic group. Third, for these reasons or others, it is possible that our employers subconsciously cat-egorize applicants with Anglo-Saxon names as better than other applicants without fully accounting for other resume characteristics, as suggested by the literature on implicit discrimination. Last, and maybe more importantly, it can be that the reasons why applicants with foreign names and those with African-American names are discriminated against are different although the discrimination rate is the same. We leave these important questions open for future research.
References
Alesina, A., and E. L. Ferrara (2005): “Ethnic Diversity and Economic Performance,” Journal of Economic Literature, 43(3), 762–800.
Arrow, K. (1973): “The Theory of Discrimination,” in Discrimination in Labor Markets, ed. by O. Ashen-felter, and A. Rees. Princeton University Press, Princeton (NJ).
Ayres, I., F. Vars, and N. Zakariya (2005): “To Insure Prejudice: Racial Disparities in Taxicab Tip-ping,” Yale Law Journal, 114, 1613–1674.
Becker, G. S. (1971): The Economics of Discrimination. University of Chicago Press, Chicago (IL). Bendick, M. (2007): “Situation Testing for Employment Discrimination in the United States of America,”
Horizons stratÈgiques, 3(5), 17–39.
Bendick, M. J., C. Jackson, and V. Reinoso (1994): “Measuring employment discrimination through controlled experiment,” Review of Black Political Economy, 23(1), 25–48.
Bertrand, M., D. Chugh, and S. Mullainathan (2005): “Implicit Discrimination,” American Economic Review, 95(2), 94–98.
Bertrand, M., and S. Mullainathan (2004): “Are Emily and Greg More Employable than Lakisha and Jamal? A Field Experiment on Labor Market Discrimination,” American Economic Review, 94(4), 991–1013.
Bollinger, C. R., and K. R. Ihlanfeldt (2003): “The intraurban spatial distribution of employment: which government interventions make a difference?,” Journal of Urban Economics, 53(3), 396–412. Booth, A., A. Leigh, and E. Varganova (2012): “Does Ethnic Discrimination Vary Across Minority
Groups? Evidence from a Field Experiment,” Oxford Bulletin of Economics and Statistics, 74(4), 547–573. Bursell, M. (2007): “What’s in a name? A field experiment test for the existence of ethnic discrimination
in the hiring process,” SULCIS WP, 07(7).
Correll, J., B. Park, C. M. Judd, and B. Wittenbrink (2002): “The police officer’s dilemma: Using ethnicity to disambiguate potentially threatening individuals.,” Journal of Personality and Social Psychology, 83(6), 1314–1329.
Crowder, K. (2000): “The Racial Context of White Mobility: An Individual-Level Assessment of the White Flight Hypothesis„” Social Science Research, 29(2), 223–257.
Currarini, S., M. O. Jackson, and P. Pin (2009): “An Economic Model of Friendship: Homophily, Minorities,and Segregation,” Econometrica, 77(4), 1003–1045.
Doleac, J., and L. Stein (2012): “The Visible Hand: Race and Online Market Outcomes,” Stanford Institute for Economic Policy Research WP, (10-025).
Duguet, E., N. Leandri, Y. L’Horty, and P. Petit (2007): “Discriminations a l’embauche: un testing sur les jeunes des banlieues d’ile de France.,” Centre d’Analyse Stratègique WP.
Ellwood, David, T. (1986): “The Spatial Mismatch Hypothesis: Are There Teenage Jobs Missing in the Ghetto?,” in The Black Youth Employment Crisis, ed. by R. B. Freeman, and H. J. Holzer, chap. 4. University of Chicago Press, Chicago.
Fershtman, C., U. Gneezy, and F. Verboven (2005): “Discrimination and Nepotism: The Efficiency of the Anonymity Rule,” Journal of Legal Studies, 34(2), 371–396.
Giuliano, L., D. Levine, and J. Leonard (2009): “Manager Race and the Race of New Hires,” Journal of Labor Economics, 27(4), 589–631.
Goldberg, M. S. (1982): “Discrimination, Nepotism, and Long-Run Wage Differentials,” Quarterly Journal of Economics, 97(2), 307–319.
Goldin, C., and C. Rouse (2000): “Orchestrating Impartiality: The Impact of "Blind" Auditions on Female Musicians,” American Economic Review, 90(4), 715–741.
Habyarimana, J., M. Humphreys, D. N. Posner, and J. M. Weinstein (2009): Coethnicity: Diversity and the Dilemmas of Collective Action. Russell Sage Press, New York (NJ).
Holzer, H. J. (1996): What Employers Want: Job Prospects for Less-Educated Workers. Russell Sage Foundation, New York.
Holzer, H. J., and K. R. Ihlanfeldt (1998): “Customer Discrimination And Employment Outcomes For Minority Workers,” Quarterly Journal of Economics, 113(3), 835–867.
Jowell, R., and P. Prescott-Clarke (1970): “Racial Discrimination and White-collar Workers in Britain,” Race Class, 11(4), 397–417.
Lang, K., and J.-Y. K. Lehmann (2011): “Racial Discrimination in the Labor Market: Theory and Empirics,” Journal of Economic Literature, Forthcoming.
List, J. A. (2004): “The Nature and Extent of Discrimination in the Marketplace: Evidence from the Field,” Quarterly Journal of Economics, 119(1), 49–89.
Miguel, E., and M. K. Gugerty (2005): “Ethnic diversity, social sanctions, and public goods in Kenya,” Journal of Public Economics, 89(11-12), 2325–2368.
O’Regan, K. M., and J. M. Quigley (1999): “Accessibility and Economic Opportunity,” in Transporta-tion Economics and Policy, ed. by J. Gomez-Ibanez, pp. 437–468. Brookings InstituTransporta-tion.
Oreopoulos, P. (2011): “Why Do Skilled Immigrants Struggle in the Labor Market? A Field Experiment with Six Thousand Resumes,” American Economic Journal: Economic Policy, 3(4), 148–171.
Phelps, E. S. (1972): “The Statistical Theory of Racism and Sexism,” American Economic Review, 62(4), 659–661.
Putnam, R. D. (2007): “E Pluribus Unum: Diversity and Community in the Twenty-first Century,” Scan-dinavian Political Studies, 30(2), 137–174.
Raphael, S., M. A. Stoll, and H. J. Holzer (2000): “Are Suburban Firms More Likely to Discriminate against African-Americans?,” Journal of Urban Economics, 48(3), 485–508.
Riach, P. A., and J. Rich (2002): “Field Experiments of Discrimination in the Market Place,” Economic Journal, 112(483), F480–F518.
Riach, P. A., and J. Rich (2004): “Deceptive Field Experiments of Discrimination: Are they Ethical?,” Kyklos, 57(3), 457–470.
Stoll, M. A., H. J. Holzer, and K. R. Ihlanfeldt (2000): “Within cities and suburbs: Racial residential concentration and the spatial distribution of employment opportunities across sub-metropolitan areas,” Journal of Policy Analysis and Management, 19(2), 207–231.
Stoll, M. A., S. Raphael, and H. J. Holzer (2004): “Black job applicants and the hiring officer’s race,” Industrial and Labor Relations Review, 57(2), 267–287.
Weichselbaumer, D. (2004): “Is It Sex or Personality? The Impact of Sex Stereotypes on Discrimination in Applicant Selection,” Eastern Economic Journal, 30(2), 159–186.