HAL Id: hal-01506612
https://hal.archives-ouvertes.fr/hal-01506612
Submitted on 12 Apr 2017
HAL is a multi-disciplinary open access
archive for the deposit and dissemination of
sci-entific research documents, whether they are
pub-lished or not. The documents may come from
teaching and research institutions in France or
abroad, or from public or private research centers.
L’archive ouverte pluridisciplinaire HAL, est
destinée au dépôt et à la diffusion de documents
scientifiques de niveau recherche, publiés ou non,
émanant des établissements d’enseignement et de
recherche français ou étrangers, des laboratoires
publics ou privés.
Local urban sprawl accuracy from image segmentation
uncertainties simulation
V.C.E. Laurent, N. Saint Geours, Jean-Stéphane Bailly, J.P. Chéry
To cite this version:
V.C.E. Laurent, N. Saint Geours, Jean-Stéphane Bailly, J.P. Chéry. Local urban sprawl accuracy from
image segmentation uncertainties simulation. Accuracy 2014, Jul 2014, East Lansing, United States.
5 p. �hal-01506612�
Local urban sprawl accuracy from image segmentation
uncertainties simulation
Valérie C.E. Laurent
1; Nathalie Saint-Geours
1; Jean-Stéphane Bailly
2,3;
Jean-Pierre Chéry
31
Irstea, UMR TETIS, Montpellier, France
2 AgroParisTech, UMR LISAH, Montpellier, France 3
AgroParisTech, UMR TETIS, Montpellier, France
Abstract
Urban sprawl can be monitored using remote sensing. One method is to segment and classify the images to obtain polygons of impervious areas and then derive urban patches. We evaluated the geometric accuracy of the impervious polygons using the boundary distance distribution signature (BDDS) and investigated their propagation to spatial indicators of urban sprawl indicators at municipality scale, south of France, from impervious polygons uncertainties simulation.
Keywords
: Geometric uncertainties, Boundary distance distribution signature, Polygon simulation, Error propagation, Urban sprawl.1. Introduction
Urban sprawl is a crucial issue for land use planners and should therefore be monitored regularly. This can effectively be achieved using remote sensing. Object-based image analysis is especially suited for mapping impervious areas. The segmentation-classification process produces vector maps, which can directly be used to compute spatial indicators of urban sprawl. The impervious polygons, however, suffer from geometric uncertainties due to the pre-processing of the remote sensing image, to the segmentation errors and to the object misclassifications. In this case study in southern France, we focus on the uncertainties of the segmentation-classification step, and investigate how they propagate into the indicator maps using Monte Carlo simulations.
2. Materials and methods
2.1. Study area and data
Languedoc-Roussillon is a French “region” covering 27’376 km², located along the Mediterranean coast. Sixty-five multispectral RapidEye images with 5 m spatial resolution were acquired in spring - summer 2009. They were segmented and classified using eCognition by Dupuy et al. (2012). Their impervious polygons, covering 1913 km2 (including roads), were used as the inputs for this study.
2.2. Segmentation accuracy
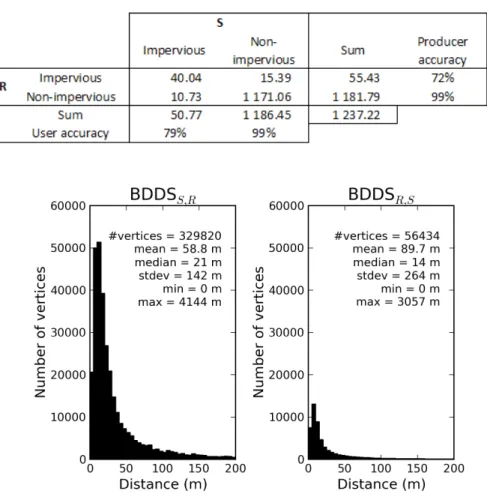
For 75 municipalities, covering a total area of 1’237 km2, an external operator digitized reference impervious polygons on the RapidEye images, ignoring roads. This reference dataset (R, 4’870 polygons) was used to evaluate the accuracy of the segmented dataset (S, 5’076 polygons), using:
1) the confusion matrix of S versus R, and
2) the boundary distance distribution signature (BDDS, Huang and Dom, 1995), which is the histogram of the minimum distance of each polygon vertex of one dataset to the polygon vertices of the other dataset. This measure is not symmetrical, and two measures are therefore necessary:
BDDSS,R: histogram of (1)
BDDSR,S: histogram of (2)
where d is the Euclidian distance, and r and s are vertices of R and S. The BDDS histograms were calculated using only matching polygons that had more than 50 % area overlap.
2.3. Polygon Monte Carlo simulations
Using the three metrics above, equiprobable sets of impervious polygons were simulated based on S. The vertices of each polygon were moved in a random direction by a distance randomly drawn from BDDSS,R, yielding deformable polygons
(Heuvelink, Brown, and van Loon, 2007). Random fields were used to account for spatial correlations between neighbor vertices. A total of 1000 datasets were simulated in a Monte Carlo set up.
2.4. Impervious patch and spatial indicators
For each simulated dataset, an impervious patch was built by a closing procedure, using a radius of 50 m, according to the methodology defined by Dupuy et al. (2012), that is: a dilation (buffer with positive radius) followed by an erosion (buffer with negative radius). This operation connects impervious polygons that are closer than 100 m into larger polygons. The impervious patch was then used to calculate the impervious spread coefficient (Ispread) of Balestrat (2011), which was selected as an example. It is calculated as:
(3)
where S>3ha (resp. S<3ha) are the cumulated areas of the patches larger (resp. smaller) than 3 hectares (30’000 m2).
3. Results and discussion
3.1. Segmentation accuracy
The confusion matrix in Table 1 shows that 40.04 km2 of the impervious area of the 75 municipalities was correctly segmented. This represents 72% of the total impervious area in R (producer accuracy), and 79% of the total impervious area in S (user accuracy). The error rate for the user is therefore 21%.
As can be seen on Figure 1, BDDSS,R and BDDSR,S have similar profiles starting
with high frequencies at short distances, and rapid decrease towards longer distances. As expected, the number of vertices is much lower in R than in S. This difference is intrinsic to the production of the dataset, the manual approach yielding much fewer vertices than the automatic segmentation. The two histograms, however show similar Poisson-like distributions.
High producer and user accuracies and high frequencies at short distances indicate that S matches R reasonably well. Many commission errors are due to confusion of bare soil with impervious areas.
Table 1: Confusion matrix of the OBIA impervious classification (S) versus
Figure 1: The two BDDS for the 75 municipalities, restricted to the distance range 0 - 200 m.
The maximum distance value is indicated in the plot text.
3.2. Polygon simulations
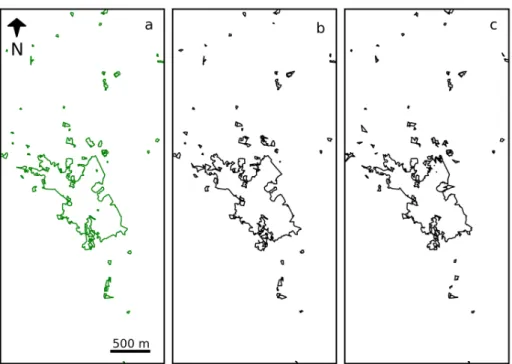
Starting from the S dataset, we simulated 1’000 segmentations, using the accuracy measures above. The vertices of the polygons in S were moved in a random direction, by a distance randomly drawn from BDDSS,R, accounting for spatial correlations
between neighboring vertices of the same polygon using random fields. Examples of two simulations, compared to the S dataset can be seen below in Figure 2. In the current implementation, the simulations only consider the exterior ring of the matched polygons. Future work will implement simulations of interior rings as well as omitted and committed polygons.
Figure 2: The S dataset used as a basis for the simulations (a), and two examples of
simulations (b and c) for the municipality of Roujan.
3.3. Impervious patch and spatial indicators
For each simulated segmentation, the impervious patch and the map of Ispread were produced. Based on the 1’000 Ispread maps, an accuracy map as well as confidence interval maps were produced, to accompany the original Ispread map (based on the S segmentation of Dupuy et al., 2012).
3. Conclusion
Realistic simulation of the segmentation errors, the Monte Carlo analysis allowed producing accuracy and confidence interval maps for the Ispread indicator. These maps will be useful for the local authorities.
4. Acknowledgements
This work was funded by GEOSUD, a project (ANR-10-EQPX-20) of the program “Investissements d'Avenir” managed by the French National Research Agency. The authors thank Maxime Vitter for digitalizing the impervious polygons for the 75 municipalities.
References
Balestrat, M. (2011), Système d’indicateurs spatialisés pour la gouvernance territoriale :
Application à l'occupation des sols en zone périurbaine languedocienne. PhD thesis,
Université Montpellier III and Cemagref, France.
Dupuy, S., Barbe, E., Balestrat, M. (2012), “An Object-Based Image Analysis Method for Monitoring Land Conversion by Artificial Sprawl Use of RapidEye and IRS Data”. Remote
Sensing, Vol. 4(12):404–423.
Heuvelink, G. B. M., Brown, J. D., & van Loon, E. E. (2007). “A probabilistic framework for representing and simulating uncertain environmental variables”. International Journal of
Geographical Information Science, 21(5), 497–513.
Huang, Q., Dom, B. (1995), “Quantitative methods of evaluating image segmentation”.