HAL Id: hal-01401008
https://hal-brgm.archives-ouvertes.fr/hal-01401008
Submitted on 26 May 2020HAL is a multi-disciplinary open access
archive for the deposit and dissemination of sci-entific research documents, whether they are pub-lished or not. The documents may come from teaching and research institutions in France or abroad, or from public or private research centers.
L’archive ouverte pluridisciplinaire HAL, est destinée au dépôt et à la diffusion de documents scientifiques de niveau recherche, publiés ou non, émanant des établissements d’enseignement et de recherche français ou étrangers, des laboratoires publics ou privés.
Radiocesium transfer from hillslopes to the Pacific
Ocean after the Fukushima Nuclear Power Plant
accident: A review
O. Evrard, Jean-Patrick Laceby, Hugo Lepage, Yuichi Onda, Olivier Cerdan,
Sophie Ayrault
To cite this version:
O. Evrard, Jean-Patrick Laceby, Hugo Lepage, Yuichi Onda, Olivier Cerdan, et al.. Radio-cesium transfer from hillslopes to the Pacific Ocean after the Fukushima Nuclear Power Plant accident: A review. Journal of Environmental Radioactivity, Elsevier, 2015, 148, pp.92-110. �10.1016/j.jenvrad.2015.06.018�. �hal-01401008�
Radiocesium transfer from hillslopes to the Pacific Ocean after the Fukushima
Nuclear Power Plant accident: A review
Olivier Evrarda,J. Patrick Lacebya, Hugo Lepagea, Yuichi Ondab, Olivier Cerdanc, Sophie Ayraulta
a
Laboratoire des Sciences du Climat et de l’Environnement (LSCE), Unité Mixte de Recherche 8212 (CEA-CNRS-UVSQ/IPSL), Gif-sur-Yvette, France
b
Graduate School of Life and Environmental Sciences, Center for Research in Isotopes and Environmental Dynamics (CRIED), University of Tsukuba, Tsukuba, Japan
c
Bureau de Recherches Géologiques et Minières, Orléans, France Corresponding Author: O. Evrard (Olivier.Evrard@lsce.ipsl.fr)
Highlights
The majority of radiocesium is transported in the particulate fraction.
The contribution of the dissolved fraction is only relevant in base flows.
Significant transfer of particulate-bound radiocesium occurs during heavy rainfall.
Radiocesium deposited in floodplains may be remobilized, inducing contamination.
1
Radiocesium transfer from hillslopes to the Pacific Ocean after the Fukushima
1Nuclear Power Plant accident: A review
23
Abstract:
4
The devastating tsunami triggered by the Great East Japan Earthquake
on March 11, 2011
5
inundated the Fukushima Dai-ichi Nuclear Power Plant (FDNPP) resulting in a loss of cooling
6
and a series of explosions releasing the largest quantity of radioactive material into the
7
atmosphere since the Chernobyl nuclear accident. Although 80% of the radionuclides from
8
this accidental release were transported over the Pacific Ocean, 20% were deposited over
9
Japanese coastal catchments that are subject to frequent typhoons. Among the
10
radioisotopes released during the FDNPP accident, radiocesium (
134Cs and
137Cs) is
11
considered the most serious current and future health risk for the local population.
12
The goal of this review is to synthesize research relevant to the transfer of FDNPP derived
13
radiocesium from hillslopes to the Pacific Ocean. After radiocesium fallout deposition on
14
vegetation and soils, the contamination may remain stored in forest canopies, in vegetative
15
litter on the ground, or in the soil. Once radiocesium contacts soil, it is quickly and almost
16
irreversibly bound to fine soil particles. The kinetic energy of raindrops instigates the
17
displacement of soil particles, and their bound radiocesium, which may be mobilized and
18
transported with overland flow. Soil erosion is one of the main processes transferring
19
particle-bound radiocesium from hillslopes through rivers and streams, and ultimately to the
20
Pacific Ocean. Accordingly this review will summarize results regarding the fundamental
21
processes and dynamics that govern radiocesium transfer from hillslopes to the Pacific
22
Ocean published in the literature within the first four years after the FDNPP accident.
23
The majority of radiocesium is reported to be transported in the particulate fraction and is
24
attached to fine particle size fractions. The contribution of the dissolved fraction to
25
radiocesium migration is only relevant in base flows and is hypothesized to decline over
26
time. Owing to the hydro-meteorological context of the Fukushima region, the most
27
significant transfer of particulate-bound radiocesium occurs during major rainfall and runoff
28
events (e.g. typhoons and spring snowmelt). There may be radiocesium storage
within
29
catchments in forests, floodplains and even within hillslopes that may be remobilized and
30
contaminate downstream areas, even areas that did not receive fallout or may have been
31
decontaminated.
32
Overall this review demonstrates that characterizing the different mechanisms and factors
33
driving radiocesium transfer is important. In particular, the review determined that
34
quantifying the remaining catchment radiocesium inventory allows for a relative comparison
35
of radiocesium transfer research from hillslope to catchment scales. Further, owing to the
36
variety of mechanisms and factors, a transdisciplinary approach is required involving
37
geomorphologists, hydrologists, soil and forestry scientists, and mathematical modellers to
38
comprehensively quantify radiocesium transfers and dynamics. Characterizing radiocesium
39
transfers from hillslopes to the Pacific Ocean is necessary for ongoing decontamination and
40
management interventions with the objective of reducing the gamma radiation exposure to
41
the local population.
2
Key Words (Max 6): Fukushima, Cesium, Soil, Sediment, Forest, Modelling
43 44
Graphical Abstract:
45
3
Introduction
47
The Great East Japan Earthquake on March 11, 2011 generated a giant tsunami inundating the 48
Fukushima Dai-ichi Nuclear Power Plant (FDNPP). After the loss of cooling at three FDNPP reactors, a 49
series of explosions occurred resulting in a massive release of radioactive contaminants into the 50
atmosphere. The FDNPP accident resulted in the largest atmospheric release of radioactive material 51
since Chernobyl (Chino et al., 2011; Steinhauser, 2014; Thakur et al., 2013). Although 80% of the 52
fallout from this atmospheric release was over the ocean, 20% of fallout was over terrestrial Japan 53
(Groëll et al., 2014; Kawamura et al., 2011; Kobayashi et al., 2013).The terrestrial fallout from the 54
FDNPP accident occurred in a different environmental context than previous major accidents, 55
occurring predominantly in a coastal mountainous region subject to frequent typhoons (Hilton et al., 56
2008; Shinomiya et al., 2014). 57
Radiocesium (134Cs and 137Cs) is considered the most serious risk to the current and long term health 58
of the local population (Kitamura et al., 2014; Saito et al., 2015). The half-life of the two most 59
abundant radiocesium isotopes is 2 y (134Cs) and 30 y (137Cs). Therefore, FDNPP derived radiocesium 60
will be an ongoing, long-term source of gamma radiation exposure to the local population. 61
Accordingly, this review will focus on radiocesium transfer from hillslopes to the Pacific Ocean. 62
Shortly after the FDNPP accident, multiple other radioisotopes were measured in the environment. 63
The wet deposition of hazardous iodine (131I, half-life of 8 d) was detected along with multiple short-64
lived radionuclides (Shozugawa et al., 2012; Tagami et al., 2011; Tazoe et al., 2012) (Table 1). 65
However, these short-lived isotopes disappeared quickly and were primarily below detection limits 66
by late April 2011 (Fujiwara et al., 2012). Long-lived isotopes (e.g., 239Pu (T1/2 = 24100 y), 240Pu (T1/2 = 67
6560 y)) were also detected (Table 1), although only in trace levels (Evrard et al., 2014b; Schneider et 68
al., 2013; Schwantes et al., 2012). Steinhauser (2014) comprehensively reviewed radionuclides that 69
may have been released by the FDNPP accident which have received less attention. These 70
radionuclides include less volatile elements (89Sr, 90Sr, 103Ru, 106Ru), pure beta-emitters (3H, 14C, 35S), 71
4 gaseous radionuclides (85Kr, 133Xe, 135Xe) or radionuclides with very long half-lives (e.g., 36Cl, 99Tc, 129I, 72
236
U)(Table 1). 73
Table 1. Radionuclides detected in environmental samplesafter the FDNPP accident Radionuclide Half-life (d) Half-life (y) Reference 129 Te 0.05 -- Tazoe et al. (2012) 132 I 0.10 -- Shozugawa et al. (2012) 135Xe 0.38 -- Steinhauser (2014) 91Sr 0.40 -- Shozugawa et al. (2012) 140
La 1.70 -- Shozugawa et al. (2012); Tagami et al. (2011) 133mXe 2.20 -- Steinhauser (2014) 239Np 2.35 -- Shozugawa et al. (2012) 132 Te 3.30 -- Shozugawa et al. (2012)) 133 Xe 5.25 -- Steinhauser (2014) 131I 8.00 --
Shozugawa et al. (2012); Tagami et al. (2011); Tazoe et al. (2012) 131m Xe 11.90 -- Steinhauser (2014) 140 Ba 12.80 -- Shozugawa et al. (2012) 136Cs 13.20 -- Tagami et al. (2011) 129m
Te 33.60 -- Tagami et al. (2011); Tazoe et al. (2012) 95
Nb 35.00 -- Shozugawa et al. (2012); Tagami et al. (2011) 103Ru 39.40 -- Steinhauser (2014) 59 Fe 44.60 -- Shozugawa et al. (2012) 89 Sr 50.53 -- Steinhauser (2014) 91 Y 58.50 -- Shozugawa et al. (2012) 95Zr 64.00 -- Shozugawa et al. (2012) 35 S 87.37 -- Steinhauser (2014) 110m
Ag 252.00 -- Shozugawa et al. (2012); Tagami et al. (2011); Tazoe et al. (2012)
134Cs -- 2.06
Tagami et al. (2011); Tazoe et al. (2012) 85
Kr -- 10.75 Steinhauser (2014)
3
H -- 12.32 Kakiuchi et al. (2012); Steinhauser (2014) 241Pu
-- 14.33 Steinhauser (2014) 137
Cs -- 30.20 Shozugawa et al. (2012); Tagami et al. (2011); Tazoe et al. (2012) 238 Pu -- 87.70 Steinhauser (2014) 241Am -- 432.60 Steinhauser (2014) 14C -- 5730.00 Steinhauser (2014) 240 Pu -- 6561.00 Steinhauser (2014) 239
Pu -- 24110.00 Shozugawa et al. (2012); Steinhauser (2014) 99Tc -- 2.10E+05 Steinhauser (2014) 36 Cl -- 3.00E+05 Steinhauser (2014) 129 I -- 1.57E+07 Steinhauser (2014) 236U -- 2.34E+07 Steinhauser (2014) 235 U -- 7.04E+08 Steinhauser (2014) 238U -- 4.47E+09 Steinhauser (2014) 74
5 Researching less abundant radionuclides may provide useful and complementary information on the 75
events that occurred at FDNPP (Achim et al., 2014; Le Petit et al., 2014). However, owing to the 76
potential gamma radiation exposure, there has been an increasing focus in the literature on the 77
transfer, fate, dynamics and consequences of radiocesium in the fallout impacted region. Before the 78
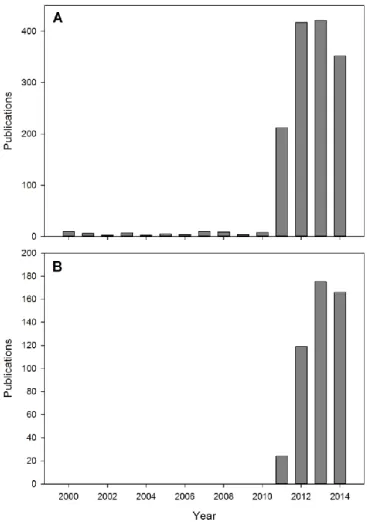
accident, there were on average six publications a year with Fukushima in the title (Fig. 1). After the 79
accident (from 2011 to 2014), this average increased over 50 fold to approximately 350 publications 80
a year. Of these publications, the percent of published research including radiocesium as a topic 81
increased from 8% in 2011 to 32% in 2014 indicating that radiocesium, in the fallout impacted region, 82
is of increasing significance to the scientific community. 83
Figure 1. Annual publications with Fukushima in the title (A - top), and Fukushima in the title with
Cesium/Caesium included the topic (B - bottom) from a Web of Science search conducted early in January 2015.
6 Initially radiocesium was deposited on terrestrial vegetation and soils. Depending on local conditions, 85
the contamination may remain stored in the forest canopy, in the vegetative litter on the ground or 86
in the soil. Once radiocesium contacts soil, it is quickly and almost irreversibly bound to fine soil 87
particles (He and Walling, 1996; Sawhiney, 1972; Tamura, 1964). During rainfall, the kinetic energy of 88
raindrops instigates the displacement of soil particles and their bound radiocesium, which are 89
mobilized and transported with rainfall runoff (Renard et al., 1991; Torri et al., 1987)(Fig. 2). Soil 90
erosion is considered to be the main process transferring particle-bound radiocesium from hillslopes 91
through rivers and streams, and ultimately to the Pacific Ocean (Yoshida and Kanda, 2012)(Fig. 2). 92
93
Figure 2. Potential pathways for radiocesium transfer from hillslopes to the Pacific Ocean following the FDNPP
94
accident denoting major processes such as erosion (E), deposition (DP), decontamination (DC) and desorption 95
(DS) (Images courtesy of the Integration and Application Network, University of Maryland Center for 96
Environmental Science (ian.umces.edu/symbols/)). 97
98
The transfer of particulate-bound radiocesium may be substantial during typhoons typically occurring 99
between June and October in Japan. Importantly, the fine particles, to which radiocesium is 100
preferentially bound to, are the particles that are preferentially eroded and likely to be transported 101
7 the farthest during erosive rainfall events (Govers, 1985; Malam Issa et al., 2006; Motha et al., 2002). 102
Fundamentally, soil erosion and riverine transport processes are the primary factors governing the 103
long-distance transfer of radiocesium from hillslopes to the Pacific Ocean (Kitamura et al., 2015; Saito 104
and Onda, 2015; Yamada et al., 2015). 105
The goal of this review is to synthesize research relevant to the transfer of FDNPP derived 106
radiocesium outlined in the previous paragraph. The main objective is to comprehensively review 107
literature investigating the fundamental processes and dynamics governing radiocesium transfer 108
from hillslopes to the Pacific Ocean published within 4 y of the FDNPP accident. This review will 109
conclude with recommendations for future research and for the design and implementation of 110
effective countermeasures. 111
1. Fallout radiocesium deposition
112
Although radionuclides from the FDNPP accident were detected worldwide (Evrard et al., 2012; Long 113
et al., 2012; Masson et al., 2011; Wetherbee et al., 2012), the majority of terrestrial deposition 114
occurred in the Fukushima Prefecture. The main radiocesium plume is located northwest of the 115
FDNPP, with a secondary plume in the Abukuma River Valley southwest from Fukushima City past 116
Koriyama (Fig. 3). There are multiple approaches to quantify catchment radiocesium inventories 117
including both airborne and soil sampling surveys (Gonze et al., 2014; Saito et al., 2015; Yoshida and 118
Takahashi, 2012). As this review examines the transfer of radiocesium from hillslopes to the Pacific 119
Ocean, we used soil sampling surveys to quantify the total, mean, and standard deviation of 120
radiocesium (134Cs+137Cs) fallout in 14 coastal catchments of the Fukushima region (Fig. 3, Table 2). 121
This quantification of catchment inventories is based on the spatial interpretation conducted by 122
Chartin et al. (2013) of 2200 soil samples collected by the Japanese Ministry of Education, Culture, 123
Sports, Science and Technology (MEXT, 2012) between June and July 2011. 124
8
Figure 3. Labelled coastal catchments impacted by the fallout from the FDNPP accident, major rivers
(grey lines), the location of the FDNPP (black circle) and major cities (black squares), and the spatial distribution of radiocesium fallout (134Cs + 137Cs) in kBq/kg provided by Chartin et al. (2013) who spatially interpreted (ordinary kriging) the radiocesium distribution of 2200 soil samples taken by the Japanese Ministry of Education, Culture, Sports, Science and Technology (MEXT) between June and July 2011 decay corrected to June 14, 2011.
9
Table 2. Radiocesium (134Cs+137Cs) inventory received by the major coastal catchments in Fukushima region (Coastal catchment data derived from the Japanese Ministry of Land, Infrastructure, Transport and Tourism (http://nlftp.mlit.go.jp/ksj-e/index.html)) and the radiocesium inventories were calculated with data from Chartin et al. (2013) spatially interpreted radiocesium inventory calculations from Fig. 3 converted to total Cs from Bg/kg.
Catchment Area (km2) Total Inventory (TBq) % of Total Inventory Deposition Density (TBq km-2) Abukuma 5338 734.9 30% 0.14 Ukedo 423 643.9 26% 1.52 Niida 265 283.4 12% 1.07 Kuma 75 161.4 7% 2.14 Maeda 45 149.9 6% 3.32 Ota 77 111.0 5% 1.44 Odaka 68 81.4 3% 1.20 Mano 171 78.1 3% 0.46 Tomioka 62 58.6 2% 0.95 Kido 263 48.6 2% 0.18 Natsui 696 36.3 1% 0.05 Uda 101 27.6 1% 0.27 Same 601 19.2 1% 0.03 Ide 40 16.2 1% 0.14 126
The Abukuma catchment received the most radiocesium fallout, followed by the Ukedo and Niida 127
catchments (Table 2). Radiocesium inventories for the 14 coastal catchments ranged between 734.9 128
TBq in the Abukuma to 16.2 TBq in the Ide catchment. The Abukuma catchment received 129
approximately 30% of the fallout received by these 14 catchments, followed by 26% for the Ukedo 130
and 12% for the Niida. Although the Abukuma catchment received the highest amountof fallout, the 131
radiocesium was distributed over a broad spatial area and the mean deposition density in the 132
Abukuma catchment was 0.14 TBq km2. Comparatively, the smaller coastal catchments had the 133
highest mean radiocesium inventories, particularly the Meada (3.32 TBq km-2), Kuma (2.14 TBq km-2), 134
Ukedo (1.52 TBq km-2), Ota (1.44 TBq km-2), Odaka (1.20 TBq km-2), and Niida (1.07 TBq km-2) 135
catchments. 136
Although quantifying catchment inventories with airborne and soil based sampling techniques or 137
different spatial interpretation approaches may yield different results (Gonze et al., 2014), what is 138
10 important to the research and management community is the spatial distribution of radiocesium. In 139
particular, characterizing the deposition of radiocesium, especially the different catchments and 140
landscapes receiving the fallout (e.g different forest types), is important for understanding the 141
sources and spatial distribution of radiocesium available for transfer from hillslopes to the Pacific 142
Ocean. 143
2.1 Forest deposition 144
Significant radiocesium deposition occurred on forested landscapes. Approximately 66% of high 145
levels ofradioactive fallout (> 1000 kBq.m-2) took place over a mixture of deciduous and coniferous 146
forests (Hashimoto et al., 2012). As the accident occurred during late winter and deciduous trees had 147
no leaves, the fallout more directly contaminated the ground surface (soil and litter). In coniferous 148
forests, with their needles intact, the fallout radiocesium was partly intercepted by the forest 149
canopy. In particular, Kato et al. (2012a) estimated that between 62% and 65% of 137Cs was 150
intercepted by the canopies of cypress and cedar forests, respectively. When examining both 151
deciduous and coniferous forests, Koizumi et al. (2013) modelled that ~10% of the 137Cs deposited on 152
forests within the exclusion zone was trapped by biomass. 153
The majority of research has focused on Japanese Cedar (Cryptomeria japonica) followed by the mixed 154
forests and coniferous forest with broad leaf forests receiving the least attention (Fig. 4). The 155
research, in particular research examining Japanese Cedar, has been widespread throughout the 156
fallout impacted region and across northern Japan (Fig. 4). As the forested areas within 20 km of the 157
FDNPP (Koizumi et al., 2013) are approximately 50% broadleaf and 50%needle-leaf forest, it may be 158
advantageous for future research to examine radiocesium dynamics equally in broadleaf, coniferous 159
and mixed forests within the highly contaminated coastal catchments. 160
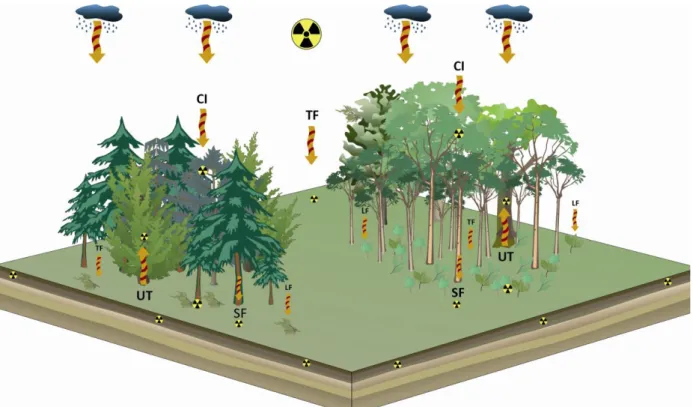
After canopy interception, the radiocesium transfer pathway from the canopy to the soil is complex 161
(Fig. 5). Radiocesium may transfer through leaf surface tissues or remain on the foliar surface. A 162
portion of foliar radiocesium (17 – 59%) was measured inside leaves within a year, whereas the 163
11 remaining radiocesium adhered to the leaf surface may be removed with wash off over time 164
(Koizumi et al., 2013; Nishikiori et al., 2015; Tanaka et al., 2013a). Results were similar for deciduous 165
(46% removed after washing) and coniferous canopies (41%) (Koizumi et al., 2013) indicative of a 166
potential long-term radiocesium source where canopies intercepted significant quantities of 167
radiocesium. 168
Figure 4. Localisation of samples examining radiocesium processes and dynamics in forests after the
FDNPP Accident. Multiple samples may have been obtained at one location.
During the first year after the accident, foliar contamination was mainly due to the radiocesium 169
deposition. After the initial deposition, radiocesium may translocate between old and new vegetative 170
tissues (Nishikiori et al., 2015; Yoshihara et al., 2014b). In most studies, a decrease of contamination 171
was observed between old and young needles in coniferous forests (Akama et al., 2013; Kanasashi et 172
al., 2015; Nishikiori et al., 2015; Yoshihara et al., 2013). In contrast, Yoshihara et al. (2014b) reported 173
that new foliar growth in 2013 contained more radiocesium than 2011 samples in coniferous forests. 174
12 The variation between older and younger foliar components of coniferous forests contaminated by 175
the accident is complex and may impact the radiocesium export from these forests. 176
177
Figure 5. An illustration of the major radiocesium transfer pathways in forested (coniferous – to the
left – and deciduous – to the right) landscapes. The major transfer pathways to the soil include throughfall (TF), canopy interception (CI), litter fall (LF) and stem flow (SF). There is also potential for the flora to uptake (UT) radiocesium (Images courtesy of the Integration and Application Network, University of Maryland Center for Environmental Science (ian.umces.edu/symbols/)).
For deciduous forests, research into foliar contamination is inconclusive. Tanaka et al. (2013a)did not 178
observe any contamination in new leaves. Nishikiori et al. (2015) reported that although leaves were 179
absent during the accident, contamination was detected in leaves sampled in 2012. Yoshihara et al. 180
(2014a) found no significant variation in leaves sampled in 2011 and 2012. Additional factors may 181
explain tree contamination such as root uptake, stem transfer, or surficial contamination due to 182
wind-eroded particle deposition. 183
Characterizing radiocesium transfer from forests to hillslopes is important for understanding 184
cumulative long-term radiocesium export from forest environments. During rainfall events, 185
radiocesium is more likely to be transferred by throughfall than by stemflow, although both 186
13 pathways increase ground contamination (Kato et al., 2012a; Loffredo et al., 2014). The effective 187
half-life of radiocesium in trees was calculated to be 620 d for cypress and 890 d for cedar canopies 188
(Kato et al., 2012a). Accordingly, there will likely be a medium to long-term canopy to ground 189
stemflow and throughfall transfer of radiocesium (Kato et al., 2012a). 190
Litterfall is a significant radiocesium transfer pathway. In fact, litterfall was reported to transfer as 191
much radiocesium as throughfall (Teramage et al., 2014a). Further, Hasegawa et al. (2013) reported 192
that radiocesium concentrations in litter were greater than those measured in the soil. In the future, 193
litterfall will likely become the dominant pathway for radiocesium transfer from the canopy to the 194
forest floor as hydrological pathways transfer less radiocesium with time owing to decreased 195
availability (Teramage et al., 2014a). In addition, Kuroda et al. (2013) found that the tree bark was 196
highly contaminated. More than 94% of the stem contamination was located in the bark, indicative 197
of another potential long-term source of radiocesium derived either from surficial contamination or 198
through contaminated phloem sap. 199
The quantity of radiocesium in the litter depends on multiple factors such as tree species, location of 200
the forest in the radioactive pollution plume, or sampling date. Matsunaga et al. (2013) did not 201
observe specific migration of radiocesium from litter to soil after the first rainfall event (July-August 202
2011). Nakanishi et al. (2014) reported a decrease of 137Cs contamination in litter from 67% to 13% 203
during the first year, whereas contamination in soil increased from 26% to 80%. Takahashi et al. 204
(2015) found that the proportion of radiocesium in leaf litter, relative to soil, decreased from ~90% in 205
2011 to 18-14% in 2012. Fujii et al. (2014) also noted a significant decrease in the percentage of 206
radiocesium in the leaf litter, decreasing from between 44-65% in 2011 to 14-27% in 2012. The 207
transfer of radiocesium from litter to soil is controlled by rainfall and litter decomposition. Research 208
estimates that around 30%-40% of litter in Japanese forests is decomposed annually (Hashimoto et 209
al., 2012; Matsunaga et al., 2013). 210
14 In the Fukushima region, forests are a radiocesium reservoir, retaining significant quantities of 211
radiocesium within both the canopy and the leaf litter (Hashimoto et al., 2012; Koarashi et al., 212
2012a). Although forested landscapes are not considered to be significant erosion sources 213
(Yoshimura et al., 2015a), there is an abundance of radiocesium within these systems, often stored in 214
organic matter, that may be transferred downstream during significant rainfall events. Accordingly, 215
forest landscapes may potentially become perennial sources of radiocesium in the Fukushima region. 216
Understanding both intra- and inter- forest radiocesium transfers will be fundamental to 217
understanding radiocesium transfer and export by soil erosion and wash-off. Incorporating 218
differences between deciduous and coniferous forests and their different rates of radiocesium 219
transfer is important for modelling hillslope exports and cumulative radiocesium transfers from 220
hillslopes to the Pacific Ocean. 221
2.2 Soil deposition 222
Upon contact with the soil, it is well known that radiocesium is strongly and rapidly fixated to fine soil 223
particles (He and Walling, 1996; Sawhiney, 1972). Cesium is an alkali metal and accordingly it 224
possesses similar chemical properties to potassium and may substitute for potassium in interactions 225
with clay minerals resulting in an almost irreversible fixation to fine soil particles (Kitamura et al., 226
2015). 227
Following the Fukushima accident, researchers have extensively examined radiocesium fixation to 228
fine particles (Akai et al., 2013; Saito et al., 2014; Tanaka et al., 2013c). These examinations were 229
undertaken primarily because of the high organic matter and clay content of soils in the Fukushima 230
region that may influence the depth migration of radiocesium in the soil profile. In particular, there 231
has been a research focus on the physical and chemical foundation of the fixation of radiocesium to 232
fine particles and the depth migration of radiocesium in the soil profile. Characterizing the fixation 233
potential of radiocesium to fine soil particles is fundamental to understanding potential radiocesium 234
15 migration pathways including the mobilization and transport of radiocesium, and ultimately its 235
transfer through rivers and streams to the Pacific Ocean. 236
Compared to the forest radiocesium research, there has not been a similar regional coverage of soil 237
sampling across northern Japan (Fig. 6). The majority of samples examining soil transfer processes 238
including depth migration or fixation potential were taken within the 14 coastal catchments with a 239
well distributed coverage across the fallout impacted region. The focus of soil sampling is mainly on 240
paddy fields with a substantial number samples having unclassified land uses. The inclusion of land 241
use details would be beneficial to future research examining radiocesium transfer processes. 242
Figure 6. Location of soil sampling locations where research examined radiocesium dynamics or
process such as depth migration in the soil profile or fixation to the mineral or soil fractions. More than one sample may occur at any given location.
Immediately after the FDNPP accident, Tanaka et al. (2013c) reported that the radiocesium was 243
water soluble, though once radiocesium adsorbed on to soil and rock particles it quickly became 244
essentially insoluble. The increase in insolubility was also reported by Shiozawa (2013) who indicated 245
16 that the strong fixation of radiocesium to clay particles during the initial 2–3 months after the 246
accident reduced the migration of radiocesium in the depth profile. The strong fixation to clay 247
particles was again reported by Saito et al. (2014) and Kikawada et al. (2014) who indicated that 248
virtually no radiocesium was extractable from soil samples with simple water solutions. 249
Using X-ray diffraction, Saito et al. (2014) reported that micaceous minerals (e.g. muscovite, biotite, 250
and illite) were responsible for the strong radiocesium soil fixation. Conversely, Kozai et al. (2012) 251
utilized desorption experiments to determine that radiocesium was almost irreversibly fixated to the 252
non-micaceous soil minerals. Niimura et al. (2015) reported that radiocesium fixation is due to a 253
physical adherence to the rough surfaces of the soil mineral particles. These different approaches to 254
understanding radiocesium fixation indicate that the physical processes behind this strong fixation 255
are difficult to characterize and are dependent upon multiple parameters such as experiment 256
characteristics, mineral contents, and/or the physical-chemical characteristics of both the fallout 257
radiocesium itself and the soil medium. 258
The extractability of radiocesium was found to be higher in forest soils with higher contents of clay 259
and silt particles, and a higher cation exchange capacity (Koarashi et al., 2012b). Using extraction 260
processes with K2SO4, Koarashi et al. (2012b) reported that only 2.1 to 12.8% of Fukushima-261
originated radiocesium found in the surface mineral soils were retained as easily exchangeable ions 262
by abiotic components in forest sites. Potential uptake and retention of 137Cs by microorganisms in 263
the forest surface soils (0-3 cm) were found to be minor and less important than ion-exchange 264
adsorption on non-specific sites provided by abiotic components (Koarashi et al., 2012b). In the long-265
term, microorganisms in forest soils may contribute to the mobilization of radiocesium by 266
decomposition of the soil organic matter (e.g. leaf litter) (Koarashi et al., 2012b). 267
Research prior to the FDNPP accident clearly indicates that in undisturbed soils an exponential 268
decline of radiocesium in the soil profile is expected along with a very slow radiocesium depth 269
migration in the soil profile (He and Walling, 1997). In fact, the radiocesium peak from nuclear 270
17 weapons testing in the 1960s is now only 2-8 cm below the soil surface in undisturbed soils 271
(Jagercikova et al., 2015). 272
Owing to the strong and irreversible bond to fine soil particles, the majority of FDNPP derived 273
radiocesium currently remains stored within the top 5 cm of the soil profile in undisturbed soils 274
(Lepage et al., 2014b; Matsuda et al., 2015; Matsunaga et al., 2013; Mishra et al., 2015; Takahashi et 275
al., 2015). Anthropogenic activities increase the depth of migration of radiocesium in the soil profile 276
(Lepage et al., In Press; Matsunaga et al., 2013). Erosion and subsequent deposition processes may 277
also result in the increase of radiocesium with depth in the soil profile similarly to carbon and other 278
minerals in depositional landscapes (Van Oost et al., 2012). Lepage et al. (In Press) demonstrated that 279
90% of radiocesium remained in the upper 5 cm of the soil profile after deposition in non-cultivated 280
soils, whereas within cultivated soils the contamination was homogeneous throughout the tilled soil 281
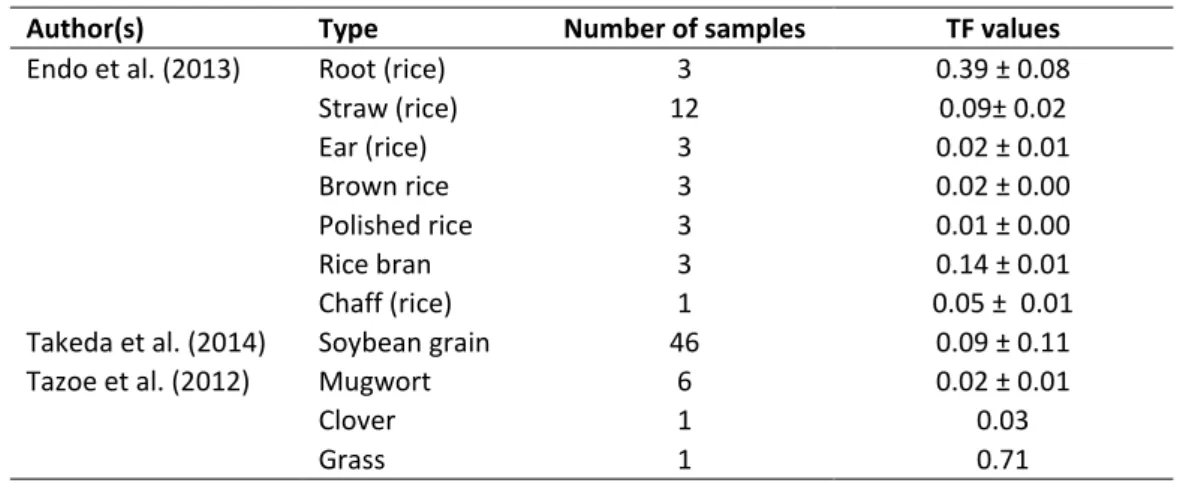
layer (generally down to 15-30 cm). Endo et al. (2013) demonstrated that radiocesium 282
concentrations were not dependent on depth in rice paddy field soils, whereas they declined 283
exponentially in an uncultivated soil. Sakai et al. (2014) and Tanaka et al. (2013b) both indicated that 284
radiocesium from the FDNPP accident was measureable at 15 cm depth in rice paddy fields. Mishra 285
et al. (2015) reported that the vertical migration down the soil profile was slower in forest soils than 286
in grassland soils. In a study of 85 soil sampling sites, Matsuda et al. (2015) found that the depth 287
penetration of radiocesium was higher than the standard range (0.2-1.0 kg m−2 y−1) depicted by He 288
and Walling (1997). 289
Multiple researchers have postulated different hypotheses for the observed depth migration of 290
radiocesium in the soil profile. Fujiwara et al. (2012) reported that the elevated rates of radiocesium 291
migration down the soil profile are potentially indicative of the mobile form of radiocesium 292
immediately after the accident. Kato et al. (2012b) also observed increased downwards migration of 293
radiocesium immediately and attributed this phenomenon to high clay content that increased the 294
aggregate stability of topsoil resulting in increased water and radiocesium infiltration deeper into the 295
18 soil profile. Conversely, Satou et al. (2015) investigated the vertical migration in coarse-grained beach 296
material impacted by the tsunami. The authors demonstrated that the majority of radiocesium was 297
located at ~3-6 cm depth. This migration is likely due to coarser grained material indicative of a 298
potential particle size impact on the depth migration of radiocesium. 299
The depth migration of radiocesium also depends on soil properties. Koarashi et al. (2012a) 300
demonstrated that clay and organic matter content are key factors controlling radiocesium depth 301
migration. Organic matter inhibits the fixation of radiocesium on the soil mineral fraction by limiting 302
its access to adsorption sites on clay minerals through direct competition for potential adsorption 303
sites. As organic matter may limit the adsorption of radiocesium, it may also influence the rate of 304
radiocesium depth migration. The impact of organic matter is particularly notable in forests. The high 305
organic content of forest soils increases the potential for radiocesium depth migration (Koarashi et 306
al., 2012a). Nakanishi et al. (2014) demonstrated that 0.1% of the radiocesium deposited on the 307
forest floor indeed migrated below 10 cm depth in 1 y. 308
The timing and extent of rainfall may also drive the migration of radiocesium deeper within the soil 309
profile. The rainfall that occurred immediately after the accident fallout may have been a factor in 310
the radiocesium depth migration in forest soils (Teramage et al., 2014b) along with rainfall volume in 311
general (Fujii et al., 2014). Further, rainfall was listed as a potential factor for the depth migration in 312
the beach sand samples (Satou et al., 2015). The average rainfall in the Fukushima region is more 313
than 2 times greater than Chernobyl and the rainfall erosivity is almost 3 times greater (Laceby et al., 314
submitted). Both the elevated rainfall intensity and volume may have resulted in greater depth 315
penetration of radiocesium in the Fukushima region compared to that of Chernobyl. 316
Migration of radiocesium was also correlated with low bulk densities as highly porous structures may 317
facilitate water and potentially dissolved radiocesium infiltration deeper down the soil profile 318
(Koarashi et al., 2012a; Takahashi et al., 2015). The radiocesium interception potential (RIP) is often 319
used to quantify this process. The RIP describes the capacity of the mineral content of soils to adsorb 320
19 radiocesium (Wauters et al., 1996). Fan et al. (2014b) reported the mean RIP from 13 soil samples 321
was 6.1 (with all discussed RIP values noted as mol.kg-1). Nakao et al. (2014) noted a higher mean RIP 322
of 7.8 for 97 soil samples. Takahashi et al. (2015) reported a mean RIP of 4.1 for 7 soil samples and 323
demonstrated that RIP was negatively correlated with a penetration coefficient (α), indicating that 324
the radiocesium penetrates deeper in soils with low RIP values. A similar relationship was found 325
between RIP values and the organic content of the soil with Takeda et al. (2014) confirming deeper 326
radiocesium penetration in soils with elevated organic content. In particular, Takeda et al. (2014) 327
reported a mean RIP for 46 samples of 2.4. Further, Koarashi et al. (2012a) reported a strong 328
negative correlation (r = -0.79, p < 0.005) between total organic carbon(TOC) content divided by clay 329
content (TOC/clay) and the percentage of retention of 137Cs, suggesting that the presence of organic 330
matter inhibits the adsorption of 137Cs on clay minerals. 331
Along with TOC, RIP depends on the presence of minerals having selective adsorption sites for Cs 332
(micas, micaceous clays) (Takeda et al., 2014). Indeed, the type of clay may be more important than 333
the total clay content as there were higher RIP values in soils containing clays from the micaceous, 334
vermiculitic and chloritic groups (>10 mol/kg)(Takahashi et al., 2015) than in soils containing clays of 335
amorphous and kaolinitic groups (Nakao et al., 2014). In the Fukushima region where some soils 336
developed on volcanic ash deposits, they contain higher amounts of poorly crystalline minerals (e.g., 337
allophane, imogolite), which do not provide these adsorption sites (Takeda et al., 2014). There have 338
even been positive relationship between RIP and native K content which further reflects the fact that 339
the 137Cs retention ability of soil clays is controlled primarily by the amount of micaceous minerals 340
(Nakao et al., 2014). Ultimately, owing to the variety of relationships between TOC, clay content and 341
clay species, quantifying the dominant factors influencing RIP in the Fukushima region is more 342
complicated than in the Chernobyl region.
343
The research on radiocesium deposition on soils has focussed on understanding post-deposition 344
dynamics. In particular, understanding the RIP and concomitant fixation to soil is important to 345
20 understand post-deposition processes with important ramifications for management. For example, 346
owing to the strong fixation potential to soils, radiocesium will be maintained in the upper sections 347
of undisturbed soil allowing for potential decontamination through the removal of the soil surface 348
(e.g. top 5 cm) in undisturbed sites. Further, as radiocesium is strongly fixated to fine mineral soils, it 349
potentially may be eroded during rainfall events and its migration and transfer from hillslopes to the 350
Pacific Ocean will be governed by thegeomorphological and hydrologicalfactors driving soil erosion, 351
mobilization, and transport processes. 352
2. Radiocesium hillslope transfers
353
As radiocesium is tightly bound to soil particles, the transfer of soil-bound radiocesium can occur 354
with the physical mobilization of soil particles during erosion processes (Yoshimura et al., 2015a). The 355
amount of radiocesium wash-off generated by erosion processes is dependent upon the volume of 356
soil eroded and the radiocesium concentration in the soil, with the latter being dependent on the 357
amount of radiocesium within the soil (Yoshimura et al., 2015a). In the coastal catchments of the 358
Fukushima Prefecture, sheetwash erosion on cultivated slopes dominates, as slope gradients on 359
cultivated hillslopes are low and their length is insufficient to allow runoff to concentrate and 360
generate rills or gullies (Vandaele et al., 1996). 361
To examine soil and radiocesium export, Yoshimura et al. (2015a) established seven Universal Soil 362
Loss Equation (USLE) run-off plots in Kawamata Town. They examined one forest, two cultivated, two 363
uncultivated, and two grassland sites and reported that land use is important when modelling the 364
export of radiocesium. In particular, one uncultivated farmland plot dominated the radiocesium and 365
sediment runoff. The farmland plots had the highest rates of erosion (1 kg m-2 of soil loss) and 137Cs 366
export (16 kBq m-2), followed by grassland and the forest plots (< 0.1 kg m-2 of soil loss and < 2 KBq m -367
2
of 137Cs). In particular, Yoshimura et al. (2015a) reported an exponential relationship between 368
vegetation cover and soil loss. 369
21 Quantifying hillslope erosion is difficult for Japanese paddy fields as they may be both sources and 370
sinks of sediment and sediment-bound radiocesium (Tanaka et al., 2013b; Wakahara et al., 2014). 371
When paddies are puddled for the rice growing season, they are flooded with water potentially 372
containing suspended sediment and adsorbed radiocesium (Endo et al., 2013; Wakahara et al., 2014; 373
Yoshikawa et al., 2014). Further, when the paddies are drained, they are directly connected to the 374
stream network and may become a significant source of sediment and radiocesium, as water and 375
sediments discharged from paddy fields are often transferred directly to stream systems (Wakahara 376
et al., 2014). 377
Tanaka et al. (2013b) investigated the impact of contaminated irrigation water on rice paddy 378
radiocesium inventories. Although they did not report a significant impact of irrigation water on the 379
radiocesium inventory in the paddy, they concluded that significant rainfall events may increase 380
radiocesium migration and transfer. In a non-hillslope erosion oriented study, Yoshikawa et al. (2014) 381
found that the irrigation of paddy fields only contributed an additional 0.03-0.05% of 137Cs to the pre-382
irrigation paddy field 137Cs inventory. The authors concluded that the additional 137Cs load from 383
irrigation is negligible in comparison to the existing soil 137Cs inventory. 384
Wakahara et al. (2014) examined the discharge of radiocesium from rice paddy fields reporting that a 385
normally cultivated paddy field exported 1240 Bq m-2 of 137Cs after puddling and 102 Bq m−2 after 386
irrigation. Comparatively, a decontaminated paddy exported 48 Bq m−2 of 137Cs after puddling and 387
317 Bq m−2 after irrigation. Although decontamination removed 95% of the fallout radiocesium from 388
this particular paddy, the export of radiocesium from the decontaminated paddy was greater after 389
irrigation than the non-decontaminated paddy. The authors concluded that water inflows during 390
events and irrigation with sediment-bound 137Cs contributed to this counter-intuitive result. 391
There has been limited research on the radiocesium migration from forests. Kitamura et al. (2014) 392
modelled that forest soils, which occupy a large portion of the region, export only a small fraction of 393
soil and radiocesium. Pratama et al. (2015) modelled that subcatchments of the Abukuma River with 394
22 greater proportions of forest coverage have the lowest radiocesium export. Nagao et al. (2013) 395
confirmed this finding in their monitoring research through indicating that, while forest land uses 396
cover 64% of their research catchments, they only accounted for 24% of soil and 41% of 137Cs export. 397
Although forests disproportionately contribute less radiocesium than their initial inventories, the 398
gross amounts exported are high owing to their large area (Kitamura et al., 2014). 399
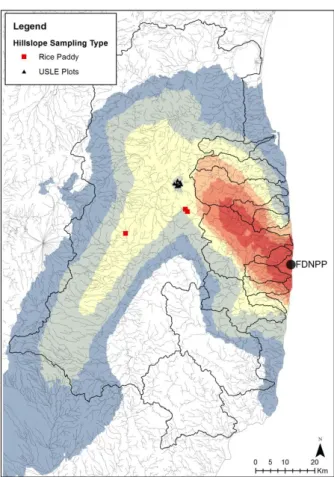
Fig. 7 illustrates the limited extent of direct hillslope erosion sampling in the Fukushima region. The 400
research on hillslope erosion was located in the Abukuma catchment. This limited research reflects a 401
similar lack of research in monsoonal regions on soil erosion owing to the difficulties in conducting 402
complex field observation studies during intense rainfall conditions or replicating these conditions in 403
laboratory environments. More research at the hillslope scale is important to quantify the erosion 404
and concomitant radiocesium transfer during runoff events. Different erosion and runoff dynamics 405
exist for each land use, complicating our understanding of the detachment and transfer of 406
contaminated sediments, particularly in catchments with mixed land use (Kinouchi et al., 2015). As 407
radiocesium is bound to soil, its initial mobilization and transfer will be directly dependent on the 408
various factors governing soil erosion (for example see Morgan et al. (1998); Nearing et al. (1989); 409
Renard et al. (1991)). Thoroughly characterizing potential soil erosion processes from different 410
sources at the hillslope scale is thus fundamental to understanding the potential transfer from 411
hillslopes to the Pacific Ocean. In particular, more research is required to properly characterize the 412
dominant sources of particulate radiocesium in the Fukushima region and the relative contribution of 413
these sources to radiocesium fluxes to the Pacific Ocean. 414
3. Factors influencing riverine radiocesium transfer
415
As radiocesium mobilized from hillslopes and transported downstream is selectively attached to the 416
finest eroded soil particles (Kinouchi et al., 2015), it is important to develop a quantitative 417
understanding of the particle size redistribution of radiocesium to predict potential contamination of 418
downstream areas that are more densely populated and not-affected by the initial fallout (Kinouchi 419
23 et al., 2015; Ueda et al., 2013). Characterizing the particle size distribution of radiocesium will 420
improve our understanding of the potential transfer of radiocesium (e.g. fine particle fractions 421
Figure 7. Sample locations for research examining hillslope radiocesium transfer with USLE-based
and calculations of suspended sediment yields form rice paddy fields.
transfer farther and possibly stored longer) and also potential storage within stream systems (e.g. 422
coarse particles are deposited sooner). Along with the particulate fraction, it is important to 423
understand the dissolved/particulate partitioning of transported radiocesium in rivers and streams. 424
Radiocesium is transferred in both dissolved and particulate fractions that behave differently. 425
Examining the rainfall/climate is also important to determine the impacts of climate on radiocesium 426
transfer and storage. Importantly the potential storage of radiocesium between hillslopes and the 427
Pacific Ocean may become a significant focal point of future management efforts. Prior to examining 428
research that quantifies radiocesium transfers and export from the coastal catchments, each of these 429
dynamics impacting radiocesium transfers will be discussed. 430
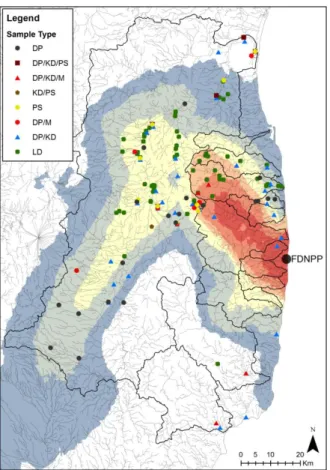
24 In the fallout affected catchments, the main radioactive pollution plume is drained by the Abukuma 431
River, along with several small coastal catchments (Fig. 3). The majority of research has focused on 432
understanding the transfer of fallout contamination in the Abukuma River basin (Fig. 8). For the 433
smaller coastal catchments, there has been a focus of research in the Niida and Mano rivers with 434
decreasing research in the catchments close to and south of the FDNPP. In particular there has been 435
limited research published on the catchments with the highest mean radiocesium inventories (the 436
Maeda, Kuma, Ukedo and Ota catchments). 437
Figure 8. Location of stream sampling locations for samples examining dissolved/particulate (DP)
fractions and their distribution coefficient (KD), particle size (PS), monitoring (M), and lag deposits (LD).
4.1 Radiocesium distribution coefficient (dissolved/particulate) 438
To quantify radiocesium migration in catchments, it is necessary to understand the ratio of 439
particulate and dissolved radiocesium transported in river systems. Dissolved and particulate-bound 440
radiocesium migrate differently in waterways and their ratio provides fundamental information for 441
25 understanding future migration (Yoshimura et al., 2015b). The dissolved/suspended partitioning of 442
radionuclides is typically described with a distribution coefficient, Kd, and is expressed as a ratio of 443
radiocesium activity concentration in particulate and dissolved fractions under equilibrium conditions 444
(Ueda et al., 2013). 445
In samples from the Abukuma River, Sakaguchi et al. (2015) reported that the particulate fraction 446
transported 80% of 137Cs (Table 3). Conversely, Tsuji et al. (2014) indicated that in the Abukuma and 447
Ota catchments, only 64% of the radiocesium was transported with the particulate fraction. When 448
examining sediments across the fallout impacted region, Yoshimura et al. (2015b) found that 449
between 58-100% of radiocesium was transported with the particulate fraction, with the exclusion of 450
one estuary site. Similarly, Yoshikawa et al. (2014) reported that between 60-95% of radiocesium was 451
transported with the particulate fraction in three small subcatchments (<0.1 km²) of the Abukuma 452
River. 453
Differences between these results are likely related to the timing of sampling in relation to significant 454
rainfall events. For example, in the Same and Natsui catchments, Nagao et al. (2013) observed that in 455
normal flow conditions, the particulate fraction transported 40% of the 137Cs, compared to ~100% 456
during a significant rainfall event (i.e. Typhoon Roke). Ueda et al. (2013) also reported significant 457
differences between flood and base flow conditions with the particulate partition contributing over 458
90% of radiocesium in the Niida River during Typhoon Roke. In this catchment, the particulate 459
fraction only accounted for 40% of the radiocesium migration in base flow conditions. In addition, 460
Shinomiya et al. (2014) found that 92-97% of radiocesium is transferred with the particulate fraction 461
during significant rainfall events (Typhoon Guchol), compared to between 12-96% in base flow. From 462
modelling research, Mori et al. (2014), determined that the particulate fraction transported more 463
than 95% of the 137Cs, slightly above the range calculated by Yamashiki et al. (2014) (82-93%). This 464
research clearly demonstrates that the particulate fraction dominates the transfer of radiocesium in 465
the Fukushima region during major rainfall events. 466
26 Differences between the dissolved/particulate radiocesium partitioning may also be influenced by 467
the time elapsed since the FDNPP accident. For example, in the Niida catchment, Nagao et al. (2014) 468
27
Table 3. Summary of research examining radiocesium in particulate/dissolved and Kd
Author(s) Catchment(s) Sampling Period Radionuclide(s) Particulate Fraction of
transported 137Cs (%)
Average K(d)
Nagao et al. (2013) Same / Natsui July 2011 - Dec. 2011 134Cs & 137Cs 99 Flood Conditions 33 Base Flow
2.5 x 10⁶ Nagao et al. (2014) Niida May 2011 - Nov. 2012 134Cs & 137Cs 47 (Before Sept. 2011)
84 (After Sept. 2011)
N/A
Sakaguchi et al. (2015) Abukuma June 2011 - Dec. 2012 137Cs 80 8.8 x 10⁵
Shinomiya et al. (2014) Experimental Catchment (Abukuma)
June 2012 134Cs, 137Cs 92-97 Flood Conditions 12-96 Base Flow
N/A Tsuji et al. (2014) Abukuma, Ota Sept. 2012 - May 2013 134Cs & 137Cs 64 N/A Ueda et al. (2013) Niida July 2011 - Nov. 2011 134Cs & 137Cs >90 Flood Conditions
40 Base Flow
3.5 x 10⁵ Yamashiki et al. (2014) Abukuma June 2011 - May 2012 134Cs & 137Cs 82-93 N/A Yoshikawa et al. (2014) Abukuma April 2012 – Sept. 2012 137Cs 60–83 Flood Conditions
69–95 Base Flow
1.2 x 10⁵ Base 10.6 x 10⁵ Event Yoshimura et al. (2015b) Abukuma, Mano, Same,
Fujiwara, Niida, Ota, Odaka, Asami, Ukedo,
Dec. 2012 134Cs & 137Cs 58-100a 3.6 × 10⁵
28 reported that the particulate fraction averaged 47% between May and September 2011 compared to 469
84% between December 2011 and November 2012. The differences were attributed to rainfall and 470
declining availability of leachable sources of radiocesium that were likely washed off in greater 471
concentrations early after the accident. When researching dissolved radiocesium fractions in stream 472
and ground water, Iwagami et al. (Submitted) also reported a fast flush of radiocesium before 473
October 2011, resulting from the initial wash-off, followed by a slow decline in radiocesium 474
concentrations. Moving forward, it is likely that the particulate phase will constitute a greater 475
proportion of the radiocesium transfer. 476
In the Niida catchment, Ueda et al. (2013) reported that the mean Kd was 3.5 × 10⁵ (Table 3). 477
Yoshimura et al. (2015b) calculated a very similar mean Kd of 3.6 x 10⁵ when comparing the 478
particulate material sampled from time-integrated samplers (Phillips et al., 2000) and water sampled 479
with a vacuum pump sampler. Nagao et al. (2013) demonstrated that the Kd range in the Same and 480
Natsui Rivers was between 0.4 × 10⁶ – 5.0 × 10⁶. Yoshikawa et al. (2014) reported that the Kd in three 481
small (<1.2 km²) was 1.2 x 10⁵ in base flow compared to 10.6 x 10⁵ in event conditions. Sakaguchi et 482
al. (2015) indicated the Kd in the Abukuma River was 8.8 x 10⁵. In general, these results are an order 483
of magnitude greater than those reported by the International Atomic Energy Agency after the 484
Chernobyl accident (2.9 x 10⁴) (UNSCEAR, 2000) indicative of a greater percentage of particulate-485
bound radiocesium migrating through these catchments compared to those sampled in areas 486
impacted by fallout from the Chernobyl accident. In Ukrainian rivers with similar volumes of total 487
suspended solids as in Fukushima rivers, the dissolved fraction was found to contain ~75% of the 488
sampled 137Cs (1-2 y post-accident) (Sansone et al., 1996). Although a significant component of 489
radiocesium migrates with the dissolved fraction in normal flow conditions in the Fukushima region, 490
it contributes only a limited amount to the total radiocesium migration to downstream areas 491
(Kinouchi et al., 2015). The challenge is that the particulate radiocesium concentrations are often 492
irregular and driven by suspended solid fluctuations resulting from heavy precipitation (Tsuji et al., 493
29 2014) and it is difficult and costly to continuously monitor suspended solids, particularly during high 494
flow conditions. 495
Ueda et al. (2013) demonstrated a high correlation between the discharge of radiocesium and fluvial 496
water discharge. Correlations were also found between particulate/dissolved radiocesium 497
concentrations and catchment radiocesium inventories, suggesting that it may be possible to predict 498
radiocesium concentrations (Yoshimura et al., 2015b). As this correlation is empirical and may 499
change owing to regional hydro-meteorological dynamics, further research is required before using 500
this relationship directly in modelling approaches. Importantly, Kd was found to be related to the 501
proportion of large particles (e.g. low clay content), the clay mineralogy of small particles, and the 502
aqueous phase cation concentration (Fan et al., 2014a). As radiocesium primarily bound to fine 503
sediment particles (Yamaguchi et al., 2012), it is important to understand the relationship between 504
radiocesium and particle size for modelling radiocesium transfer at larger scales. 505
4.2 Radiocesium particle size distributions 506
The fine soil fraction, to which radiocesium is bound, is preferentially eroded at the hillslope scale 507
(mean particle size = 25.5 μm) (Yoshimura et al., 2015a). This fraction (e.g. silt and clay) is also 508
preferentially transported farther distances owing to a smaller settling velocity (Iwasaki et al., 2015) 509
resulting in the accumulation of radiocesium in downstream areas potentially unaffected by the 510
initial fallout (Tanaka et al., 2014). Indeed the distribution of radiocesium with regards to particle size 511
will have a significant impact on the radiocesium deposition in downstream areas. It is therefore 512
important to examine whether sediment generation and transport processes impact the radiocesium 513
fixation to fine particles. 514
River sediments were found to have a high 137Cs adsorption capacity (Fan et al., 2014a). Multiple 515
studies demonstrated that radiocesium concentrations were elevated in the fine particle size 516
fractions (Fan et al., 2014a; Sakaguchi et al., 2015; Tanaka et al., 2015; Tanaka et al., 2014). Sakaguchi 517
et al. (2015) found that the maximum 137Cs concentration in suspended sediment was found in the 518
30 silt particle size fraction (3-63µm). This result was also reported in Fan et al. (2014a). In the former 519
case, 137Cs in each fraction did not demonstrate any systematic variation across multiple sampling 520
sites (Sakaguchi et al., 2015). In the latter, Fan et al. (2014a) found that there was a weak relationship 521
between particle size and radiocesium for fine sediment (<63 µm), though a stronger relationship 522
was derived for the coarser grain fractions (e.g. >63 µm). 523
The sorption of radiocesium to sediments was found to be directly related to their physical-chemical 524
properties, including cation exchange capacity, organic matter content and mineralogy (Fan et al., 525
2014a). What was unexpected with these findings was that the radiocesium concentrations were not 526
always enriched in the fine clay material (<3 µm). A below expected quantity of radiocesium in the 527
fine clay material was also reported by Tanaka et al. (2014) who found that the silt and sand fractions 528
transported 95% of the sediment-sorbed radiocesium. This study did find an enrichment of 137Cs in 529
the clay material, though it was found to only constitute a small proportion of the sampled bedload 530
material. Fan et al. (2014a) also reported a low clay mineral content in the <2 µm particle size 531
fraction. The lack of radiocesium enrichment in the finest particle size fraction may be the result of 532
sampling technique (e.g. sampling bed load material) or other fluvial processes that may result in the 533
majority of very fine material being exported from the catchment. 534
For modelling and management of radiocesium transfers in the contaminated catchments, it may be 535
silt, rather than clay that requires emphasis. For example, silt was found to be the significant source 536
of bed contamination (excluding initial fallout) whereas during later stages of rainfall flow events, 537
clay materials were found to be the dominant supply of 137Cs to the lower river reaches (Kurikami et 538
al., 2014). Further characterization of the relationship between radiocesium and particle size is 539
fundamental for understanding radiocesium transfer and storage in fallout affected catchments. 540
4.3 Radiocesium mobilization: Rainfall regime 541
Rainfall is the driving mechanism behind soil erosion by water (Nearing et al., 1989; Wischmeier and 542
Smith, 1958). The regional climate in conjunction with the topography of the fallout impacted region 543
31 exacerbates radiocesium transfer. The catchments of the Fukushima Prefecture are mountainous and 544
characterized with a steep topography (Kinouchi et al., 2015; Minoura et al., 2014). The 545
temperate/monsoonal climate results in high seasonal and annual precipitation including significant 546
runoff events generated from snowmelt and intense rainfall from typhoons (Evrard et al., 2013; 547
Yamashiki et al., 2014). In the Fukushima region, the annual precipitation is three-fold greater than in 548
Chernobyl, resulting in a more rapid radiocesium washoff (Tsuji et al., 2014). This climate is one of 549
the fundamental mechanisms driving the migration and transfer of radiocesium throughout the 550
catchments that received the original fallout (Evrard et al., 2013). 551
Evrard et al. (2013) demonstrated that the region is highly reactive to both rainfall and snow fall 552
events. The authors demonstrated that there is a significant export of contaminated material from 553
coastal rivers to the Pacific Ocean. Chartin et al. (2013) found that the combination of rainfall and 554
snowmelt events results in a progressive migration of sediment bound radiocesium to the Pacific 555
Ocean. This sediment-based sampling clearly demonstrated that there has been a significant 556
dispersion of contaminated sediments in the 20 months after the FDNPP accident (Chartin et al., 557
2013). These authors highlight a massive, rapid and episodic transfer of radiocesium resulting from 558
the climate in general and the snowmelt/typhoon cycle in particular. Yamashiki et al. (2014) also 559
reported two significant runoff peaks in their research, one clearly coinciding with the snowmelt in 560
late spring (April-May) and the other coinciding with typhoons. 561
Overall, the literature clearly demonstrates that the majority of soil erosion and concomitant 562
radiocesium migration, coincides with extreme rainfall-runoff events (Minoura et al., 2014; Mouri et 563
al., 2014; Nagao et al., 2013; Onishi et al., 2014). In fact, most sediment and radiocesium migration is 564
thought to occur during short flood events that may occur 1-2 times per year (Yamaguchi et al., 565
2014). This importance of flooding and rainfall was incorporated by Kitamura et al. (2014) who only 566
modeled sediment migration when the flow rate is 10 times greater than the average annual flow. 567
32 In particular, the typhoons in the fallout impacted region transfer massive amounts of sediment and 568
radiocesium. For example, Typhoon Roke (Sept. 2011) destroyed paddy banks (Wakahara et al., 569
2014) and resulted in mud depositions that were ~10 cm thick (Minoura et al., 2014). Yamashiki et al. 570
(2014) estimated that Typhoon Roke mobilized and transferred 6.18 TBq, or 61% of the total 571
radiocesium load to the coastal areas during their observation period. Kinouchi et al. (2015) reported 572
that three major flow events were responsible for the migration of 43% of the sediment between 573
June 2011 and Dec. 2012. Nagao et al. (2013) demonstrated that radiocesium concentrations were 574
an order of magnitude higher during high flow conditions after Typhoon Roke, which also resulted in 575
particulate transport of radiocesium being 100% compared to 21-56% in baseflows. The authors 576
concluded that these heavy rainfall events are one of the important drivers of radiocesium migration 577
from catchments to the coast resulting for between 30-50% of the annual radiocesium coastal 578
transfer. Ultimately, extreme rainfall events are fundamental to the migration of sediments and 579
radiocesium from the hillslopes to the Pacific Ocean. 580
4.4 Radiocesium storage: Reservoirs and dams
581
Not all mobilized sediment and radiocesium is exported to the Pacific Ocean. The migration of 582
sediment, particularly coarse particle size fractions, occurs over longer temporal scales. Further, 583
anthropogenic alterations to riverine morphology, such as reservoirs and dams, further delay the 584
migration and transfer of sediment and radiocesium downstream (Kurikami et al., 2014). Reservoirs 585
not only delay the migration of radiocesium and sediments, they also may act as a major sinks and 586
storage (Evrard et al., 2014a; Evrard et al., 2013) as only a select fraction of radiocesium is 587
transferred downstream, predominantly the dissolved or clay-bound fractions (Onishi et al., 2014). 588
These reservoirs may also act as sources of contaminated sediment during water releases. 589
Chartin et al. (2013) reported a significant layer of sediments with high radiocesium concentrations 590
deposited behind a reservoir in the upper Ota River. Kitamura et al. (2014) indicated that 104 t of 591
sediment and 10 TBq of 137Cs were transferred into the Ogaki Dam on the Ukedo River which 592