• Aucun résultat trouvé

Linking Beliefs to Willingness to Compete

N/A
N/A
Protected

Academic year: 2021

Partager "Linking Beliefs to Willingness to Compete"

Copied!
30
0
0

Texte intégral

(1)

HAL Id: halshs-00755660

https://halshs.archives-ouvertes.fr/halshs-00755660

Submitted on 21 Nov 2012

HAL is a multi-disciplinary open access archive for the deposit and dissemination of sci-entific research documents, whether they are pub-lished or not. The documents may come from teaching and research institutions in France or abroad, or from public or private research centers.

L’archive ouverte pluridisciplinaire HAL, est destinée au dépôt et à la diffusion de documents scientifiques de niveau recherche, publiés ou non, émanant des établissements d’enseignement et de recherche français ou étrangers, des laboratoires publics ou privés.

Linking Beliefs to Willingness to Compete

Noémi Berlin, Marie-Pierre Dargnies

To cite this version:

Noémi Berlin, Marie-Pierre Dargnies. Linking Beliefs to Willingness to Compete. 2012. �halshs-00755660�

(2)

Documents de Travail du

Centre d’Economie de la Sorbonne

Linking Beliefs to Willingness to Compete

Noémi BERLIN, Marie-Pierre DARGNIES

(3)

Linking Beliefs to Willingness to Compete

Noémi Berlin

, Marie-Pierre Dargnies

November 2012

We are grateful to Rosemarie Nagel, Christina Rott, Jordi Brandts, Jean-Christophe Vergnaud,

Guil-laume Hollard, Muriel Niederle, the participants of the SIMA at Paris 1 University, the experimental work-shop at Stanford University and the WZB workwork-shop. We also thank the Paris School of Economics and the WZB for its financial support.

Paris School of Economics, Université Paris 1 Panthéon-Sorbonne, Centre d’Economie de la Sorbonne

106-112 Bd de l’Hôpital - 75013 Paris +33 (0)1 44 07 82 06, Noemi.Berlin@univ-paris1.fr

(4)

Abstract

Les travaux récents montrent que les hommes ont un goût pour la compétition plus prononcé que les femmes. Cet article présente un protocole expérimental mettant en évidence les différents déterminants du choix d’entrer en compétition: les croyances et le niveau de la compétition. Nous trouvons que les sujets peu performants s’adaptent au niveau de la compétition, ce qui n’est pas le cas des sujets performants. Notre expérience permet aussi de montrer que l’information n’est pas traitée de la même façon par les hommes et par les femmes: les femmes donnent plus de poids à l’information reçue, tandis que les hommes tiennent plus compte du niveau de la compétition auquel ils vont faire face. De manière générale, les hommes et le femmes dévient des croyances bayésiennes et l’information sur leur performance les rend trop pessimistes si cette information et négative (trop optimiste dans le cas contraire).

Abstract

Men are known to have a higher taste for competition than women. This paper presents an experiment that analyses the different determinants of the choice to enter a competition: beliefs and the competition level. As far as entry in the competition is concerned, low-performing subjects adapt their decision entry to the level of the compe-tition, whereas high-performers do no. However, the behaviors leading to these results are quite different for men and women: women mainly react to the information on their own performance while men seem to respond more to their beliefs concerning the level of the competition they will be evolving in. Finally, both men and women deviate from their bayesian beliefs and become too pessimistic (optimistic) after a negative (positive) feedback.

JEL classification: C91, D83, J16

Mots clés: Economie expérimentale, croyances, information sur la performance, genre, com-pétition.

(5)

1

Introduction

The under-representation of women at the top of hierarchies may have many possible expla-nations among which discrimination or the fact that women may value more the time spent with their children. Recently, economists have been interested in the role played by gender differences in preferences (Croson and Gneezy, 2009). In particular, men are known to have a higher taste for competition than women (Gneezy, Niederle, and Rustichini, 2003, Niederle and Vesterlund, 2007, Datta Gupta, Poulsen, and Villeval, 2012, Niederle and Vesterlund, 2011). However the determinants of the choice to enter a competition are still not fully understood. We suspect beliefs and the way they are updated to play an important role. That is, the decision to enter competition depends on the beliefs one holds on her relative performance which determines her probability of winning the competition. We also assume that people can be subject to the reference group neglect bias. The reference group neglect is defined as a tendency to under adjust to changes in the reference group one competes with. Indeed, Camerer and Lovallo (1999) find evidence suggesting people are subject to this bias. Namely, in their experiment, excess entry in a competition is much larger when subjects self-selected themselves into the experiment knowing payoffs would depend on skill. Subjects seem to ignore the fact that all subjects they are competing against also think that they are skilled.

Thus, in this paper, we are interested in how people update their beliefs following the reception of a performance feedback, but also on how people adjust their competitive entry to their beliefs about their relative performance and to the level of the competition. We hence want to analyze whether men and women and low-performing and high-performing subjects are different in this respect.

A recent literature is interested in how men and women differ in the way they react to the reception of a feedback on their performance and how they subsequently update their beliefs.

Azmat and Iriberri (2010) find that providing feedback on relative performance to high school students improve their grades by 5% regardless of where they are in the distribution.

(6)

In the lab, such an effect of feedback on performance is only found for men (Azmat and Iriberri, 2012).

Wozniak, Hardbaugh, and Mayr (2011) show that giving feedback about past relative per-formance removes the gender difference in tournament entry as high ability women choose more competitive compensation schemes and low ability men choose less competitive com-pensation schemes. In an experiment of Mobius, Niederle, Niehaus, and Rosenblat (2011), subjects are provided with a noisy feedback as a simple binary signal whether their perfor-mance is among the top 50%. They find that subjects are conservative, that is, they update less than Bayesian agents would in response to both negative and positive information and women are more conservative than men. In this same paper, it has been shown that subjects adjust more to positive than negative information (no gender difference in this regard).

Ertac (2011) analyzes how the information is processed. She designs a within-subject experiment to study the information processing following a real performance task feedback

vs. a non-performance task feedback1. She elicits participants’ beliefs of being in each tercile

twice during her experiment, before and after receiving the feedback, to analyze if subjects are bayesian updaters. She finds that participants react differently when the feedback concerns their own performance than when it does not: they are more pessimistic and deviate more from bayesian beliefs when they had to solve a real task compared to the non-task treatment. In terms of gender difference, she finds that women are more pessimistic than men, placing a higher probability than men on being among the worse performers and a lower probability on being in the top performers. Concerning bayesian beliefs, she finds that no gender can be considered as more bayesian than the other.

Another paper by Grossman and Owens (2011) shows how overconfidence about absolute vs. relative performance arises and how it persists with a noisy feedback and experience. They compare two conditions where subjects have to estimate either their own score (on a logic quiz) or the score of another participant. They find that the beliefs on somebody else’s scores are more accurate. However when it concerns their own score they are overconfident

1She uses two types of tasks: a verbal task and an algebra task. Feedback can be positive or negative

(7)

and they tend to believe they received an unlucky feedback. Subjects deviate from bayesian beliefs when they have to evaluate their own performance but update their beliefs in a bayesian way when it refers to the other’s performance.

We run an experiment to investigate whether subjects adjust their decision to enter a competition to the level of their opponent. In order to do that, we create a design where subjects have to decide twice whether to enter a tournament. The first time, the subject knows his opponent will be randomly selected among all the other participants in their session and will therefore be of totally unknown ability. After the participants make this first decision and perform the task, they receive a feedback telling them whether their performance is above or below the median performance in their session. They then decide a second time whether to enter a competition knowing that their opponent will be randomly selected among participants belonging to the same performance group as their own: Ability Grouping treatment. We made sure to elicit beliefs both before and after subjects receive a feedback on their performance. We are then able to see what role beliefs play in their decision to enter tournament. We also run a Repetition treatment which is identical to the previous one i.e participants make two consecutive decisions whether to enter tournaments and receive a performance feedback between these two decisions, except that both times, the opponent is of totally unknown performance level (i.e. randomly chosen among all the participants in one’s session). This allows us to control for order effects.

This papers is organized as follows: section 2 describes the experimental design, section 3 reports the different results on beliefs and treatment effect. Section 4 discusses our results and concludes.

2

Experimental Design

We use a real effort task consisting in solving as many additions of five two-digit numbers as possible (Niederle and Vesterlund, 2007) within 5 minutes. There are a total of six steps plus incentivized belief assessment questions. Steps 4 and 4 prime are different whether the subject took part in a Repetition session or in a Ability Grouping session (see the following

(8)

description).

Step 1: Piece-rate (PR) remuneration scheme. Subjects have 5 minutes to solve as many

additions as they can and earn 0.50e per correct addition.

Step 2: Standard tournament (ST). Subjects have 5 minutes to solve as many additions as they can. They are randomly paired with another player. If step 2 is randomly chosen for remuneration, the winner in each pair (whose step 2 performance is greater than

his opponent’s) earns 1e per correct addition, the loser gets nothing.

First round of belief elicitation: After the second step, participant have to evaluate the probabilities that their step 2 performance belongs to each of the four performance quartiles. The sum of these 4 probabilities (in %) is equal to 100 . So they have to answer four questions corresponding to each quartile. As an example, the question for the fourth quartile was: "What is, according to you, the probability in % that your step 2 performance belongs to the 4th quartile (being in the 25% best performers)? To incentivize the answers we use a confidence rule (Mobius, Niederle, Niehaus, and Rosenblat, 2011, Hollard, Massoni, and Vergnaud, 2010): for each of the four answers,

the computer randomly picks a number y between 0 and 100. Let xi be the subject’s

answer for quartile i (i = 1, 2, 3, 4).

• If xi > y, the subject earns 1e if her score belongs to the ith quartile, nothing

otherwise.

• If xi < y, the subject earns 1e with y% probability.

Step 3, (hereafter Choice 1): Before solving additions, subjects have to choose between

PR and ST remuneration schemes. A participant who chooses PR receives 0.50e per

correct addition if step 3 is picked at the end of the experiment. If a subject chooses the tournament, she is randomly paired with another subject and wins the tournament

(which pays 1e per correct addition), if her step 3 performance is greater than her

(9)

Step 3 prime, (hereafter Choice 1 prime): Participants have to choose between sub-mitting their step 1 performance to Piece Rate (PR) or Standard Tournament (ST). They do not have to solve additions at this step. The payoffs depend on their step 1 performance. If a subjects chooses to submit this performance to the tournament she

is randomly paired with another participant and earns 1e per correct addition if her

step 1 performance is greater than her opponent’s. If she chooses PR, the remuneration is the same as in step 1.

Feedback: Each participant gets a feedback on their step 2 performance telling them whether it is above or below the median.

Second round of belief elicitation: This second round allows us to analyze how subjects update their beliefs after getting a signal on their ability level. They have to re-estimate the probabilities that their step 2 performance belongs to both possible quartiles with respect to their feedback (fourth and third quartiles for performers above the median, second and first quartiles for performers below the median). We use the same incentive rule as in the first round, for both beliefs elicited.

Step 4 Repetition or Ability Grouping, (hereafter Choice 2): 5 minutes of additions • In Repetition sessions, step 4 is exactly the same as step 3 (choice between PR or

ST, the remuneration rule stays the same).

• In Ability Grouping sessions: subjects have to choose again between piece rate and

tournament. If piece rate is chosen, the subject earns 0.50e per correct addition.

But if she chooses the tournament, she is randomly matched to another participant who belongs to the same ability group. That is, if her step 2 performance was below (above) the median she is paired with someone whose step 2 performance was below (above) the median as well. We call this "ability grouping tournament" (AT). A subject wins if her step 4 score is greater than her opponent’s step 2

score, who belongs to the same level group. In this case she wins 1e per correct

(10)

Step 4 prime (hereafter Choice 2 prime): Participants have to choose between submit-ting their step 1 performance to piece rate or tournament. In Repetition sessions, step 4 prime has the same features as step 3 prime. In Ability Grouping sessions, the choice for competition leads to an ability grouping tournament such that both of the step 1 performances that are compared belong to the same ability group. The remuneration rule is the same as in step 3 prime.

After each step, all participants know about their absolute performance that is the number of additions they solved. At the end of the experiment, a summary screen tells the participants how much they earned in each step (if they won or not the tournament as well, if chosen) and for each belief assessment question, and which step is randomly chosen for determining part of their payoff.

3

Results

The experiment was run in Paris (LEEP) between February and April 2011. The same number of men and women took part in each session. Respectively 112 subjects (56 men and 56 women) and 116 subjects (58 women and 58 men) took part in the Repetition and Ability Grouping sessions. One step was randomly chosen at the end of the experiment to

be paid in addition to the belief-assessment questions and a 7e show-up fee. Participants

earned 15.3e on average (see table 1 for descriptive statistics).

[Table 1 about here]

3.1

Changes in performance and analysis of confidence assessments

We first analyze how performance changes between step 1 and step 2, that is when the re-muneration scheme goes from being a piece rate to a tournament.

The average performance for step 1 with piece-rate remuneration scheme is 7.6 additions. For step 2, with a tournament remuneration scheme, the average performance is 9.1 additions. A two tailed t-test yields a p-value<0.01. So participants perform significantly better in the

(11)

tournament than in the piece-rate. This indicates a potential impact of the remuneration type on performance even though learning is also likely to play a role in this increase in per-formance. Concerning gender effects, we do not find any difference in terms of performance

between men and women.2

In order to enable us to study participants’ confidence in their chances of winning the tournament, they were asked to assess their beliefs both before and after receiving the feed-back telling them whether their performance was below or above the median. Before receiving the feedback, participants had to state their belief of belonging to each of the 4 performance quartiles and, after receiving the feedback, they had to assess their belief of belonging to each of the 2 quartiles they could belong to knowing their performance was either below or above the median.

Before receiving the feedback, low-performing3 men are not significantly more confident than

low-performing women (low-performing men and women think their task 2 performance is respectively 56.7% and 54.6% likely to be above the median task 2 performance of their session. A two-sided Mann-Whitney test yields p=0.69). However, after they have received the information that their performance is below the median, low-performing men are more confident than low-performing women in their chances of belonging to the second quartile as opposed to the first (worst) quartile (low-performing men and women respectively think they are 67.3% and 57.5% likely to belong to the second quartile. A two-sided Mann-Whitney test yields p<0.01).

As far as performing participants are concerned, before receiving the feedback, high-performing men are more confident than high-high-performing women of being better than the median participant. High-performing men and women respectively think they have a 75.6%

2During step 1 (piece-rate), men solved on average 7.8 additions, and women solved 7.5 additions on

average. The difference is not significant (a two-tailed t-test yields p=0.48). During step 2 (standard tournament), men and women solved respectively 9.2 and 8.9 additions on average (p=0.46). Both men and women perform significantly better in the step 2 standard tournament than in the step 1 piece-rate (both p-values are lower than 0.01).

3Low-performing participants are those whose task 2 performance was below the median task 2

per-formance in their session and who therefore receive the "below median" feedback after the first round of confidence assessment questions

(12)

and a 62.4% chance of being above the median. (this difference is significant with a two-sided Mann-Whitney test and p<0.01). Once they have learned their performance is above the median performance, men are still more confident than women but to a lesser extent: high-performing men and women believe their performance respectively has a 60.6% and 51.4% (p=0.03) chance of belonging to the best (4th) quartile.

These results suggest that men and women do not react in the same way to the perfor-mance feedback. More precisely, women seem to adjust more strongly than men to these feedbacks. In order to confirm this impression, we computed for each subject the beliefs she would hold during the second round of confidence assessment questions (i.e. after the performance feedback) if she updated her first round beliefs in a bayesian way. We later

refer to these beliefs as bayesian beliefs.4

We then compare the actual second-round beliefs to the bayesian beliefs. It appears that men and women both overreact to the feedback they observe but women to a larger extent. High-performing women’s beliefs are significantly more optimistic than bayesian beliefs (a Wilcoxon signed-rank test yields p<0.0001), this is also the case for high-performing men (p<0.01). However, high-performing women update their beliefs significantly more opti-mistically than high-performing men do (a Mann-Whitney test yields p=0.04).

Concerning low-performing participants, women’s beliefs are significantly more pessimistic than bayesian beliefs (a Wilcoxon signed-rank test yields p<0.0001) while it is true to a lesser extent for men (p=0.04). Furthermore, low-performing women update significantly more pes-simistically than their male counterparts (p=0.04).

4We compute bayesian beliefs in the following way. We denote respectively as 1, 2,

belief1-3 and belief1-4 the beliefs stated during the first round of confidence assessment by a participant of her performance belonging to each of the 4 quartiles. A bayesian who received the information that her perfor-mance is below the median should then think she has a 100*(belief1-2/(belief1-2+belief1-1)% chance of her performance belonging to the second quartile.

(13)

Result 1: While both men and women overreact to the feedback they get, women are much more affected by this tendency than men.

Namely, following the information that their performance is below the median, low-performing women tend to think too often (in comparison with a bayesian updater) that their perfor-mance belongs to the worst quartile. On the other hand, the good news a high-performing woman receives makes her think too often her performance belongs to the best quartile.

3.2

Diff-in-diff analysis

The answer to our main question is provided by looking at whether the change in tournament entry decision between Choice 1 and Choice 2 is different for participants from the Repetition group and the Ability Grouping group (see figures 1 and 2). In both treatments, participants receive a feedback between Choice 1 and Choice 2 telling them whether their performance is above or below the median. It is only in Ability Grouping sessions that the opponent belongs to the same performance group as the subject. If low-performing participants adjust their decision to enter the tournament to the level of the competition, we expect them to increase their entry rate between Choice 1 and Choice 2 more in Ability Grouping (where the level of the competition is lower in the choice 1-ability tournament than in the choice 2-standard tournament) than in Repetition (where it remains the same). The opposite should happen for high-performing participants.

[Figure 1 about here] [Figure 2 about here]

We compute the diff-in-diff estimators for Choice 1 vs. Choice 2 tournaments and

Repetition vs. Ability Grouping. These estimators are positive and significant for both low-performing women and men (the coefficients are respectively 0.33 (p=0.02) and 0.30 (p=0.04)) indicating a treatment effect for those subjects, namely that they adapt their entry decision to the competition level. As far as high-performing participants are concerned, the diff-in-diff estimators are negative (respectively -0.08 and -0.17 for high-performing women

(14)

and men) but not significant (respectively p=0.23 and p=0.54). It is therefore not the case that high-performing participants increase their rate of entry into the tournament more in Repetition (where the level of the competition remains the same) than in Ability Grouping (where it increases).

Result 2: Low-performing participants adapt their choice to enter a tournament to the level of the competition while high-performing participants do not.

We could be tempted to conclude from these first results that men and women have similar reactions to the level of the competition they face. However, saying that participants adjust their tournament entry decision to the level of the competition could mean two different things. They could react mainly to either the feedback or the level of their opponent. We would say participants react mainly to the feedback if, for instance, the reception of a negative feedback crushed their willingness to compete in Repetition but there was no difference in tournament entry between Choice 1 and Choice 2 in Ability Grouping, where they also know that their opponent is of low ability as they are. On the other hand, if the reception of a negative feedback does not change the decision to enter the tournament in Repetition but we observe that in Ability Grouping, participants enter a lot more in the Choice 2 tournament than in the Choice 1 tournament, we would consider that participants react more to the level of the competition per se.

We compute the diff-in-diff estimators for Choice 1 vs. Choice 2 tournaments and be-low median vs. above median. Concerning the Repetition group, the estimator for women is positive and significant (the coefficient is 0.39 (p=0.01)) indicating that women increase their rate of entry between Choice 1 (task 3) and Choice 2 (task 4) a lot more following a positive feedback than a negative one. The nature of the feedback therefore appears to have a strong impact on women’s competitive decisions. On the other hand, it is not the case for men (the coefficient is 0.07 (p=0.57)). It therefore means that men’s decision to enter the tournament is not influenced by the nature of the feedback they received.

(15)

Concerning the Ability Grouping group, men respond differently whether they are below or above the median (the coefficient is -0.33 (p=0.01)) suggesting that they react more to what the feedback means for the level of the competition they will face than to what it tells them about their own performance level. In this same group, the absence of the coefficient’s significance (p=0.56) for women points out that they place more importance on the personal information than on its implication on their opponents’ ability.

Result 3: While women react mainly to the feedback on their own performance level, men respond more to the level of their opponent.

[Figure 3 about here]

The decision to submit one’s performance to a tournament is very similar to deciding whether to enter a tournament except for the fact that the subject does not have to perform the task following her choice. In consequence, while overconfidence and aversion to risk and ambiguity can play a role in the decision to submit, the fear of the possibility of choking under the pressure of the competition cannot. The decision to submit to a tournament is used in particular to control for the effect of risk aversion since it should have the exact same effect on both decisions to submit and enter a tournament.

We find no treatment effect on the low-performing participants when analyzing the de-cision to submit one’s past performance to the piece-rate or the tournament remuneration schemes contrary to the decision to actually enter competition: for low-performing men and low-performing women, the diff-in-diff estimators are respectively 0.15 (p=0.17) and 0.17 (p=0.23). So low-performing participants do not adjust their decision to the level of the competition when considering submitting their past performance. Given our previous results on low-performing participants’ tournament entry behavior, it suggests that the reception of a negative feedback discourages low-performing women from submitting to the tournament less than it discourages them from entering the tournament. Furthermore, low-performing men seem to adjust less to the level of the competition when considering whether to sub-mit to a tournament rather than entering it. Therefore, it cannot be said that the fact that low-performing subjects adjust their decision to enter a tournament to the level of the

(16)

competition is (only) driven by risk aversion since no such effect is found in the decision to submit where risk aversion plays the exact same role.

Concerning high-performing subjects, we find a significant treatment effect only for women. The diff-in-diff estimators for high-performing women is -0.41 (p=0.01) indicat-ing that they adjust their decision to the level of the competition (see figure 3). So, the reference group neglect they exhibit in their decision to enter the tournaments may be due to an additional taste for competition after the reception of a positive feedback. Indeed, high-performing women from the Ability Grouping group submit less to the tournament when they know both themself and their teammate are of high ability while it is not the case for the choice to enter (they actually enter a bit more often in the second choice than in the first). Women dismiss the information on the high level of the competition they will be facing when choosing whether to enter but not when choosing whether to submit suggesting their positive feedback may make them like to perform under the pressure of competition. As regards men, we do not find a significant treatment effect (the diff-in-diff estimator is -0.20 with p=0.17) likewise for the decision to actually enter tournament.

3.3

Regressions

Our experimental design allows us to determine how the feedback on past performance, confidence and ability grouping impacts the decision to enter a competition. We ran linear

probability models5 (LPM) to quantify and identify these effects.

Our first concern is to see to what extent beliefs can explain the competitive behavior we observe. In order to do so, we create the variable beliefwin as a proxy of the subject’s

belief concerning her chances of winning a tournament. We denote bi_j the beliefs elicited

at round i of having a performance belonging to the jth half (Choice 1) or quartile (Choice 2). For Choice 1, this belief is equal to the belief of being above the median i.e. bw =

belief sup = b1_4+ b1_3. Indeed, if a subject thinks she has a 60% chance of being above

the median, she should also think she has a 60% chance of winning the tournament as her

(17)

opponent will be randomly chosen among the participants in her session. When having to decide for the second time whether to enter a tournament (Choice 2), the participants know whether they are below or above the median. The beliefs about the chances of winning will also depend on whether the subject was in Repetition or in Ability Grouping as participants in Ability Grouping compete the second time against an opponent of the same ability group as their own, while, in Repetition, the opponent is again randomly chosen in the session.

In Repetition, beliefwin will be equal to belief win = 0.375 ∗ b2_2+ 0.125 ∗ b2_1 for

low-performing subjects. We make the simplifying assumption that whenever a subject believes her performance belongs to a certain quartile, she actually thinks her performance lies exactly at the midpoint of this quartile. Then, a low-performing subject deciding whether to enter the second tournament, should think she will beat all subjects from the worst quartile and half of the subjects in the second to last quartile (that is 37.5% of potential opponents) if she

believes her performance belongs to the second to last quartile (which she thinks is b2_2%

likely) and that she will beat half of the subjects from the worst quartile (12.5%) if she thinks

her performance belongs to the worst quartile (which she thinks is b2_1% likely). Following

the same reasoning, belief win = 0.875 ∗ b2_2 + 0.625 ∗ b2_1 for high-performing subjects

of Repetition and belief win = 0.75 ∗ b2_2+ 0.25 ∗ b2_1 for both low and high performing

subjects.

[Table 2 about here]

In table 2, we study the impact of beliefs on low-performing participants’ decision to enter the tournaments. Beliefsup corresponds to the sum of the first round elicited beliefs of belonging to the 4th and 3rd quartile, so the beliefs, before receiving feedback, of being above the median. Ability Grouping is a dummy variable that is equal to 1 if the participant participated in an Ability Grouping session, and to 0 for Repetition. Choice2 is a dummy variable equal to 1 if we consider the second decision to enter the step 4 tournament and 0 if we consider the first decision to enter the step 3 tournament. We already commented regressions (1) in subsection 3.2 on diff-in-diff estimators. The addition of Beliefsup and Be-liefsup*Choice2 in the regressors leaves the coefficient of Ability Grouping*Choice2 basically

(18)

unchanged in both low-performing men and women regressions. Let us however notice that the coefficient of Beliefsup*Choice2 is negative and significant at the 10% level for women suggesting that the more low-performing women were confident to start with the more likely they are to stay out of the tournament when having to decide for the second time.

We can see from regressions (3) that when Beliefwin is added to the regressors, the coefficient of Ability Grouping*Choice2 decreases and loses its significance in both men and women’s regressions. This means that the fact that low-performing men and women adjust their competitive entry to the level of their opponents is mainly driven by beliefs. Low-performing participants’ loss of confidence following the reception of a negative feedback explains their lower willingness to enter the tournament afterwards.

[Table 3 about here]

We now consider the case of high-performing men and women (see table 3). In regression (2), the coefficient of Beliefsup*Choice2 is negative and significant at the 1% level for women while such is not the case for men. It indicates that the more underconfident high-performing women were to begin with, the more the information that they are above the median makes them likely to enter the tournament the second time. Together with our comment for low-performing women on table 2, it suggests that women are prone to what we call a "surprise effect", namely, women seem to be all the more likely to enter the tournament than they were pessimistic about their relative performance to start with. Such an effect is not found for men.

Result 4: Women react more strongly to the feedback when they did not expect it. This is what we call the "surprise effect".

The introduction of Beliefwin into the regressors in regression (3) leaves the coefficient of Ability Grouping*Choice2 non-significant in both men and women’s regressions.

Table 4 studies the impact of the feedback on the decision to enter the tournament. The dummy variable HighPerf is equal to 1 if the participant’s step 2 performance was above the median of her session and to 0 otherwise. In consequence, it also indicates the type of feedback (above the median vs. below the median) the participant got.

(19)

[Table 4 about here]

We find that women from the Repetition group react strongly to the type of feedback they receive. Namely, they enter significantly more following a positive feedback than a negative one as proven by the positive and significant coefficient of Choice2*HighPerf in columns (1) and (2). Furthermore, women’s reaction to the type of feedback they receive seems to pass through beliefs as the addition of Beliefwin to the regressors in column (3) absorbs the significance of Choice2*HighPerf. Men on the other hand do not seem to change their competitive behavior in accordance with the nature of the feedback they receive.

[Table 5 about here]

In contrast to what happens in the Repetition group, men but not women seem to change their competitive behavior following the reception of their feedback in the Ability Grouping group (see table 5). Indeed, the coefficient of Choice2*HighPerf is negative and significant in men’s regressions (1) and (2) showing that men tend to choose to stay out of the competition the second time more if they learned they are above the median and their opponent will also be. Again, this effect is mainly driven by beliefs. Women, as far as they are concerned, do not react to their feedback when it also informed them about the level of their opponent. They are about as likely to choose to enter the tournament the second time if they learned that both themself and their opponent are below the median than if they both are above the median.

The results from tables 4 and 5 show that if low-performing men and women both adjust to the level of the competition while their high-performing counterparts do not, the reasons behind their respective behaviors are different. While women mainly react to the feedback on their own performance, men focus more on the information on the level of their opponent.

3.4

Welfare analysis

In this subsection, we study the consequences of the competitive behaviors on welfare. More precisely we are interested in whether the choices maximized expected payoffs.

(20)

In order to compute the expected payoffs from entering the standard tournament (i.e. the tournament where the opponent is randomly drawn among all other participants in the session), 100,000 performances were drawn by sampling with replacement from the Step 2 performances of our 228 participants. For each level of performance, the probability of winning the standard tournament was computed by calculating the number of times out of 100,000 this given performance exceeded the opponent’s performance. Similarly, in order to compute the probability of winning the ability grouping tournament for low-performing participants, 100,000 performances were drawn from the Step 2 performances of the potential opponents, i.e., participants whose Step 2 performance was also below the median. We then calculate, for each performance level, the number of times out of 100,000 this given performance exceeded the opponents’ performance. The same method is used to compute the probability of winning the ability grouping tournament for high-performing participants. It is then possible to compare, for each performance level, the payoff from choosing the piece rate to what would have been the expected payoff from choosing the tournament. From that, we can say which participants would have maximized their payoffs by entering the tournament and compare it to the participants who actually did.

Given, the distribution of Step 2 performances, all participants with a performance higher or equal to 9 have a higher expected payoff from entering the standard tournament than from choosing the piece rate. For instance, if participants expect their Step 3 performance to be the same as their Step 2 tournament, 53.5% of participants should enter the Choice 1 tournament. However, taking into account the true Step 3 performances, which are slightly better than the Step 2 performances, 61% of participants would have gained from choosing the tournament. In the same way, all low-performing (high-performing) participants with a performance at least equal to 7 (11) should enter the Step 4 ability grouping tournament in the Ability Grouping treatment. In figures 4 and 5, we report the proportions of participants, broken down by gender, treatment and ability level, who enter each type of tournament as well as the proportions who would have gained from doing so, both if their performance stayed equal to their Step 2 performance and given their true performance during step 3.

(21)

[Figure 4 about here]

From a welfare point of view, we are most interested in comparing the actual rate of entry to the one predicted by participants’ true performances. It can be seen from figure 4 that while low-performing men enter in about the proportion of participants maximizing payoffs by doing so, not enough low-performing women choose the tournament the second time (the two-tailed z-test of proportion comparing the choice actual rates of entry of low-performing women to the rate predicted by true performances yield p=0.01). In Repetition, women react to the negative feedback as if they expect no progress in their performance between Step 2 and Step 4, while their performance actually improves. In Ability Grouping, they do not take enough into account the fact that their opponent will also be of low ability.

As far as high-performing participants are concerned, men tend to not enter as much as predicted when making their first choice (p=0.06 and 0.05 respectively in Repetition and Ability Grouping groups). In Repetition, high-performing women do not enter enough both before and after receiving their positive feedback (p<0.01 both times). In Ability Grouping, high-performing women do not enter enough when making their first choice but do not enter significantly less than predicted the second time.

[Figure 5 about here]

Result 5: Most of the time, men enter tournament in about the proportion which max-imizes their payoffs. Women tend to not choose the tournament enough and when the in-formation only concerns their own performance, they do not enter more following a positive feedback but they enter even less after a negative one.

4

Discussion and conclusion

We have shown in this paper that subjects update their beliefs to the performance feedback more strongly than a bayesian agent would do. Both men and women are more pessimistic

(22)

than a bayesian agent following a negative feedback. We find the opposite effect after a positive feedback. Both effects are stronger for women than for men. Our paper also shows that when testing if our subjects adapt their decision to enter tournament to the level of the competition, low-performing participants adjust to the level of the competition while high-performing participants do not.

Concerning the reaction to the feedback, men and women do not react the same way. We find what we call a "surprise effect" for women: they react more strongly to the feedback when they did not expect it. While women are especially sensitive to the information on their own performance level, men react more strongly to the level of their competitors. The feedback does not therefore seem to be processed in the same way by men and women. An important point is that the effect of the feedback and the information on one’s opponent’s level on one’s decision to enter the tournament mostly transit through the subjective belief of winning the tournament.

Our welfare analysis shows whether participants maximized their payoffs with their deci-sion in the different choices. Did they lose money by making the wrong choice? We show that while men enter most of the time in about the proportion of participants maximizing payoffs by doing so, often, not enough women choose the tournament. This can be explained by the fact that women give too much weight to the negative feedback they receive and do not take into account the fact that their performance can (and does) improve in time. In Repetition, women react to the negative feedback as if they expect no progress in their performance between Step 2 and Step 4, while their performance actually improves. In Ability Grouping, low-performing women do not take enough into account the fact that their opponent will also be of low ability. Only internal and self information seem to matter in their decision.

The main message of this paper is that beliefs play a major role in the decision to enter a competition. Performance feedbacks allow people to update their beliefs, but people and especially women overreact to the information they receive. Men and women do not process the information the same way: men seem to internalize more easily the information on the level of the competition they will face and take it into account in their decision

(23)

process. Women however overreact to the feedback, and even when they know the level of the competition of their opponent they put too much weight on their feedback. Thus they are more aware and sensitive to the internal information than men who tend to put more weight on external information.

(24)

References

Azmat, G., and N. Iriberri (2010): “The importance of relative performance feedback

information: Evidence from a natural experiment using high school students,” Journal of Public Economics, 94(7-8), 435–452.

(2012): “The Provision of Relative Performance Feedback Information: An Exper-imental Analysis of Performance and Happiness,” CEP Discussion Papers dp1116, Centre for Economic Performance, LSE.

Camerer, C., and D. Lovallo (1999): “Overconfidence and Excess Entry: An

Experi-mental Approach,” American Economic Review, 89(1), 306–318.

Croson, R., and U. Gneezy (2009): “Gender Differences in Preferences,” Journal of

Economic Literature, 47(2), 1–27.

Datta Gupta, N., A. Poulsen, andM. Villeval (2012): “Gender and Competitiveness.

Experimental Evidence,” Forthcoming in Economic Inquiry.

Ertac, S. (2011): “Does self-relevance affect information processing? Experimental evidence on the response to performance and non-performance feedback,” Journal of Economic Behavior & Organization, 80(3), 532–545.

Gneezy, U., M. Niederle, and A. Rustichini (2003): “Performance in Competitive

Environments: Gender Differences,” Quarterly Journal of Economics, CXVIII, 1049–1074.

Grossman, Z., andD. Owens (2011): “An Unlucky Feeling: Persistent Overestimation of

Absolute Performance with Noisy Feedback,” University of California at Santa Barbara, Economics Working Paper Series 1937484, Department of Economics, UC Santa Barbara.

Hollard, G. I., S. Massoni, andJ.-C. Vergnaud (2010): “Subjective beliefs formation

(25)

de la sorbonne, Université Panthéon-Sorbonne (Paris 1), Centre d’Economie de la Sor-bonne.

Mobius, M. M., M. Niederle, P. Niehaus, and T. S. Rosenblat (2011):

“Manag-ing Self-Confidence: Theory and Experimental Evidence,” NBER Work“Manag-ing Papers 17014, National Bureau of Economic Research, Inc.

Niederle, M., and L. Vesterlund (2007): “Do Women Shy Away from Competition?

Do Men Compete Too Much?,” The Quarterly Journal of Economics, 122(3), 1067–1101. (2011): “Gender and Competition,” Annual Review of Economics, 3(1), 601–630.

Wozniak, D., W. T. Hardbaugh, andU. Mayr (2011): “The Menstrual Cycle and

Per-formance Feedback Alter Gender Differences in Competitive Choices,” Discussion paper, Department of Economics, UC Santa Barbara.

(26)

Tables and figures

Tables

Table 1: Descriptive statistics.

Variable Modality

Age 25.8

Discipline Economics 31.14%

Science 3.1%

Mathematics 2.19%

Study level Bac or less 3.95%

Bac+1 to bac+2 40.8%

Bac+3 18.86%

Bac+4 to bac+5 34.21%

More 2.19%

Father’s education Bac or less 35.53%

Bac+1 to Bac+3 28.95%

Bac+4 and more 35.52%

Mother’s education Bac or less 39.04%

Bac+1 to Bac+3 34.21%

Bac+4 and more 26.75%

(27)

Table 2: LPM for low-performing participants by gender on the tournament decision entry.

VARIABLES Low-Perf women Low-Perf men (1) (2) (3) (1) (2) (3) Ability Grouping 0.101 0.106 0.106 -0.033 0.059 0.067 (0.113) (0.105) (0.105) (0.130) (0.130) (0.129) Choice 2 -0.172* 0.113 0.002 -0.029 0.119 0.224* (0.100) (0.149) (0.094) (0.079) (0.145) (0.113) Ability Grouping*Choice 2 0.304** 0.300** 0.141 0.326** 0.295** 0.013 (0.148) (0.144) (0.143) (0.131) (0.132) (0.168) Beliefsup 0.007*** 0.007*** (0.002) (0.002) Beliefsup*Choice2 -0.005* -0.002 (0.003) (0.002) Beliefwin 0.006*** 0.008*** (0.002) (0.002) Constant 0.241*** -0.119 -0.109 0.588*** 0.140 0.102 (0.081) (0.098) (0.099) (0.086) (0.184) (0.182) Observations 134 134 134 122 122 122 R-squared 0.102 0.170 0.170 0.060 0.157 0.145

Robust standard errors in parentheses *** p<0.01, ** p<0.05, * p<0.1

Table 3: LPM for high-performing participants by gender on the tournament deci-sion entry.

VARIABLES High-Perf women High-Perf men (1) (2) (3) (1) (2) (3) Ability Grouping 0.043 0.054 0.052 0.028 0.019 0.017 (0.150) (0.142) (0.141) (0.132) (0.130) (0.130) Choice 2 0.222* 0.880*** 0.143 0.045 0.135 0.025 (0.112) (0.201) (0.102) (0.104) (0.244) (0.107) Ability Grouping*Choice 2 -0.172 -0.187 -0.021 -0.078 -0.076 0.068 (0.143) (0.126) (0.139) (0.127) (0.127) (0.138) Beliefsup 0.008*** 0.005 (0.002) (0.003) Beliefsup*Choice2 -0.010*** -0.001 (0.002) (0.002) Beliefwin 0.006** 0.006* (0.002) (0.003) Constant 0.407*** -0.091 0.008 0.682*** 0.327 0.247 (0.097) (0.140) (0.148) (0.102) (0.264) (0.267) Observations 94 94 94 106 106 106 R-squared 0.031 0.119 0.086 0.002 0.053 0.059

Robust standard errors in parentheses *** p<0.01, ** p<0.05, * p<0.1

(28)

Table 4: LPM for Repetition participants by gender on the tournament decision entry.

VARIABLES Repetition women Repetition men (1) (2) (3) (1) (2) (3) HighPerf 0.166 0.097 0.098 0.094 0.031 0.024 (0.126) (0.114) (0.113) (0.133) (0.137) (0.138) Choice2 -0.172* 0.321** 0.061 -0.029 0.029 0.155 (0.101) (0.137) (0.094) (0.079) (0.156) (0.118) Choice2*HighPerf 0.395** 0.466*** 0.054 0.075 0.086 -0.129 (0.150) (0.148) (0.138) (0.130) (0.142) (0.147) Beliefsup 0.009*** 0.005* (0.002) (0.003) Beliefsup*Choice2 -0.009*** -0.001 (0.003) (0.002) Beliefwin 0.009*** 0.006** (0.002) (0.003) Constant 0.241*** -0.237** -0.229** 0.588*** 0.267 0.234 (0.081) (0.099) (0.104) (0.086) (0.191) (0.197) Observations 112 112 112 112 112 112

Robust standard errors in parentheses *** p<0.01, ** p<0.05, * p<0.1

Table 5: LPM for Ability Grouping participants by gender on the tournament deci-sion entry.

VARIABLES Ability Grouping women Ability Grouping men (1) (2) (3) (1) (2) (3) HighPerf 0.108 0.068 0.077 0.154 -0.040 0.077 (0.138) (0.138) (0.138) (0.128) (0.160) (0.138) Choice 2 0.132 0.437** 0.139 0.296*** 0.445*** 0.139 (0.109) (0.210) (0.108) (0.105) (0.150) (0.108) Choice2*HighPerf -0.082 -0.040 -0.040 -0.329** -0.248* -0.040 (0.140) (0.134) (0.138) (0.128) (0.143) (0.138) Beliefsup 0.005** 0.007** (0.002) (0.003) Beliefsup*Choice2 -0.006* -0.003 (0.003) (0.002) Beliefwin 0.004** 0.004** (0.002) (0.002) Constant 0.342*** 0.047 0.110 0.556*** 0.198 0.110 (0.079) (0.128) (0.122) (0.098) (0.180) (0.122) Observations 116 116 116 116 116 116 R-squared 0.017 0.053 0.043 0.049 0.134 0.043

Robust standard errors in parentheses *** p<0.01, ** p<0.05, * p<0.1

(29)

Figures

Figure 1: Proportion of low-performing women (left) and men (right) for Choice 1 and Choice 2.

Figure 2: Proportion of high-performing women (left) and men (right) for Choice 1 and Choice 2.

Figure 3: Proportion of high-performing women sumbmitting to the standard tour-nament and ability grouping tourtour-nament.

(30)

Figure 4: Actual and predicted entry rates of low-perf participants by gender and treatment

Figure

Table 1: Descriptive statistics.
Table 3: LPM for high-performing participants by gender on the tournament deci- deci-sion entry.
Table 5: LPM for Ability Grouping participants by gender on the tournament deci- deci-sion entry.
Figure 1: Proportion of low-performing women (left) and men (right) for Choice 1 and Choice 2.
+2

Références

Documents relatifs

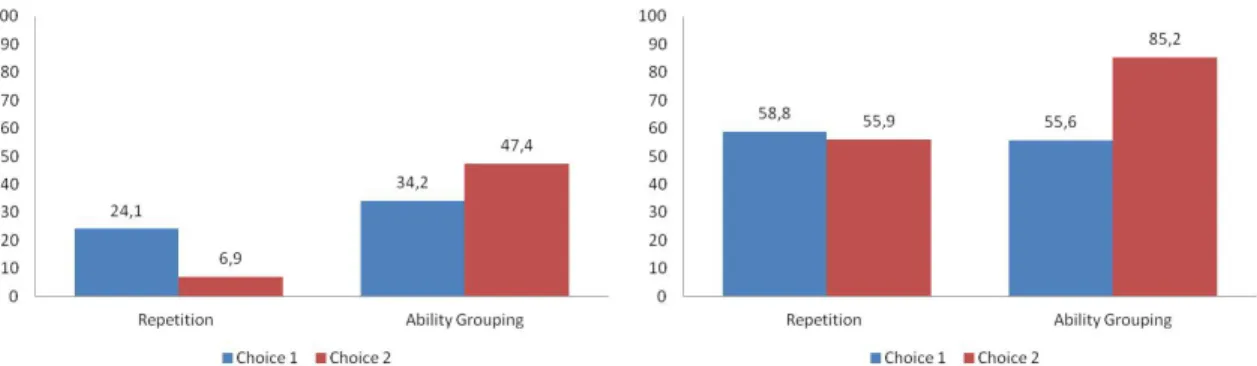
Our results can be added to a long list of experiments that corroborate the key findings by Niederle and Vesterlund (2007), namely that there is a strong gender effect in the choice

[r]

• Aligning Biodiversity Measures for Business – continuing the collaboration 2021-2024 – Sharon Brooks, Deputy Head of Business and Biodiversity Programme, UNEP-WCMC.. • First

Schneider Electric performs first ever end-to-end biodiversity footprint assessment with the Global Biodiversity Score (GBS), a tool developed by CDC Biodiversité. Raise

It is possible that this fandom around the school exists merely because of the fantasy elements or individuals’ need for escapism, yet it is also possible that the educational

10: Polygonum perfoliatum Ecoclimatic Indices for Europe, 30 minutes latitude/longitude resolution (Temperate Template, no cold stress, no wet stress, soil

Cell lines expressing mutations AQP2 I110W and AQP2 L264R , either alone or in com- bination, displayed pentamidine transport rates, and pentamidine and cymelarsan EC 50 values

The OWL family of languages is a standardisation effort of the W3C and the WSML family of languages is an effort of the WSMO working group, whereas WSML is a formal language for