HAL Id: hal-02295296
https://hal.archives-ouvertes.fr/hal-02295296
Submitted on 30 Nov 2020
HAL is a multi-disciplinary open access
archive for the deposit and dissemination of
sci-entific research documents, whether they are
pub-lished or not. The documents may come from
teaching and research institutions in France or
abroad, or from public or private research centers.
L’archive ouverte pluridisciplinaire HAL, est
destinée au dépôt et à la diffusion de documents
scientifiques de niveau recherche, publiés ou non,
émanant des établissements d’enseignement et de
recherche français ou étrangers, des laboratoires
publics ou privés.
multiferroic compound HoMnO 3
Xavier Fabrèges, Sylvain Petit, J.-B. Brubach, Pascal Roy, M. Deutsch, A.
Ivanov, L. Pinsard-Gaudart, V. Simonet, R. Ballou, Sophie de Brion
To cite this version:
Xavier Fabrèges, Sylvain Petit, J.-B. Brubach, Pascal Roy, M. Deutsch, et al.. Interplay between spin
dynamics and crystal field in the multiferroic compound HoMnO 3. Physical Review B, American
Physical Society, 2019, 100 (9), pp.094437. �10.1103/PhysRevB.100.094437�. �hal-02295296�
X. Fabr`eges,1 S. Petit,1 J.-B. Brubach,2 P. Roy,2 M. Deutsch,2,∗ A.
Ivanov,3 L. Pinsard-Gaudart,4 V. Simonet,5 R. Ballou,5 and S. de Brion5,†
1
Laboratoire L´eon Brillouin, CEA, CNRS, Universit´e Paris-Saclay, CE-Saclay, F-91191 Gif sur Yvette, France
2Synchrotron SOLEIL, L’Orme des Merisiers Saint-Aubin, 91192 Gif-sur-Yvette, France
3
Institut Laue-Langevin, 71 avenue des Martyrs CS 20156, 38042 Grenoble Cedex 9 - France. 4
SP2M-ICMMO, UMR-CNRS 8182, Universit´e Paris-Sud, Universit´e Paris-Saclay, 91405 Orsay, France
5Universit´e Grenoble Alpes, CNRS, Institut N´eel, 38000 Grenoble, France
(Dated: March 8, 2019)
In the multiferroic hexagonal manganite HoMnO3, inelastic neutron scattering and synchrotron
based THz spectroscopy have been used to investigate the spin waves associated to the Mn order together with Ho crystal field excitations. While the Mn order sets in first below 80 K, a spin reorientation occurs below 37 K, a rare feature in the rare earth manganites. We show that several Ho crystal field excitations are present in the same energy range as the magnons, and that they are all affected by the spin reorientation. Moreover, several anomalous features are observed in the excitations at low temperature. Our analysis and calculations for the Mn spin waves and Ho crystal field excitations support Mn-Ho coupling mechanisms as well as coupling to the lattice affecting the dynamics.
Keywords: THz spectroscopy, inelastic neutron scattering, dynamical magnetoelectric effect
INTRODUCTION
Multiferroics continue to attract much attention in condensed matter physics, because of the promising ap-plications in spintronics they offer, but also because these materials raise fundamental questions. One of these concerns the understanding of the microscopic ori-gin of the coupling between magnetic and electric de-grees of freedom, and how new excitations resulting from this coupling, for instance electromagnons, can emerge. Electromagnons were first reported in 2006 as mag-netic excitations excitable by the electric field compo-nent of the electromagnetic wave [1]. Since then, elec-tromagnons have been observed in several compounds with non colinear magnetic order such as perovskites [1, 2], hexaferrites [3] or even the more simple cupric oxide [4]. Various mechanisms at the origin of these ex-citations were invoked and identified, among which the inverse Dzyaloshinskii-Moriya interaction [5], symmetric exchange-striction mechanism [6] or higher harmonics of the magnetic cycloids [7]. Other types of excitations in-volving electric and magnetic degrees of freedom have also been reported such as atomic rotation mode ex-cited by the magnetic field component of the terahertz (THz) light [8] or hybrid excitations arising from the in-terplay between rare-earth crystal field (CF) excitations and 3d transition metal magnons [9,10], in particular in the hexagonal manganite ErMnO3[11]. All these hybrid
excitations often lie in the THz range and are also inves-tigated using inelastic neutron [12] or X ray scattering [13] and Raman spectroscopy [14].
The hexagonal manganites h-RMnO3 where R= Y,
Er, Ho, etc, crystallizing in the P63cm space group, have
been widely studied [15–18] since they combine remark-able properties associated to multiferroism and magnetic
(a)$ (b)$ y
x
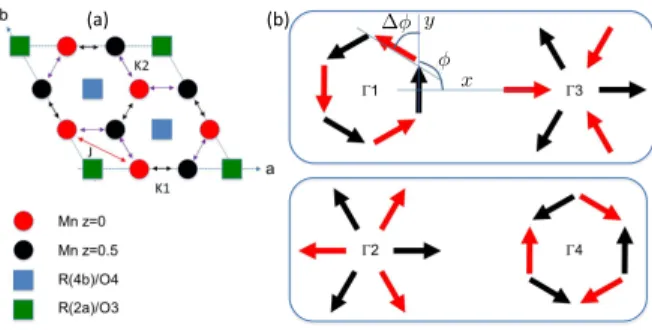
FIG. 1. Sketch of the HoMnO3 crystallographic and
mag-netic structures. (a) Projection of the different atomic posi-tions onto the ab-plane, omitting the oxygens for clarity. The Mn ions on the 6c Wyckoff site have a x coordinate within the ab-plane close to 1/3 and a z coordinate along the c-axis equal to 0 (red spheres) or 1/2 (black spheres). The rare-earths occupy two different Wyckoff sites (2a and 4b). The
main intra-plane (J ) and inter-layer (K1,2) exchange
interac-tions between the Mn magnetic moments are indicated. (b) Magnetic arrangement of the Mn ions with zero propagation vector corresponding to the four one-dimensional irreducible
representations Γi of the P63cm space groupe. The
homo-metric pairs, indistinguishable through neutron scattering if
xM n=1/3, are indicated by the boxes.
frustration. They belong to type I multiferroics, where ferroelectricity and magnetic orders occur at different temperatures: onset of an electric polarization along the c-axis at much higher temperature (TC'800K) than the
ordering of the Mn magnetic moments (TN'80K).
De-spite these different energy scales, non negligible coupling between the electric and magnetic degrees of freedom are present. For instance, the Mn magnetic ordering is ac-companied by ionic motions inside the unit cell [19, 20] giving rise to a giant magneto-elastic coupling, connected
with an increase of the ferroelectric polarization. The Mn sublattice consists of triangular planes (Fig. 1) with a peculiar stacking along the c-axis, each Mn3+ ion
sit-ting close to the middle of the triangle of Mn3+
belong-ing to adjacent layers. The actual materials have then in common a 120◦ spin structure for the Mn magnetic moments in the triangular planes, but the stacking and relative phase difference of these patterns depend on the R atom ((magnetic R=Ho, Yb, or not R= Y, Sc), and correspond to the four one-dimensional irreducible repre-sentations shown in Fig. 1. A key parameter tuning the sign of the exchange interaction and the Mn3+single-ion
anisotropy seems to be the shift away from 1/3 of the x position of the Mn3+ ions within the triangular plane
[19,21]. The ions R3+ are situated on two Wyckoff sites
2a and 4b. For magnetic rare earths, they also order at lower temperature, either polarized by the Mn molecu-lar field (site 4b) or from their mutual interaction in a temperature range of few K (site 2a) [22,23].
In this study, we focus on the Ho compound, which has been intensively studied for its rich H − T phase diagram and its strong magnetoelectric effects [17, 24]. It becomes ferroelectric at 875 K and the Mn magnetic moments order at TN=75 K in the Γ4 representation
(see Fig. 1). Remarkably, a spin reorientation occurs at TSR=37 K which is concomitant with the ordering of the
Ho(4b) magnetic moments, while the Ho(2a) moments order around THo=5 K, both along the c-axis [19,25–29].
This Mn reorientation transition, unique in the hexagonal manganites, shows up also in the electric properties with a drop in the electric polarisation below TSR which is
further recovered at THo [30]. Signatures of the
rare-earth Mn coupling in the spin dynamics in an applied magnetic field have also been reported [31,32], although no rare-earth CF-Mn magnon hybridization has yet been observed.
We report here a detailed study on the dynamical prop-erties of this compound in the THz range using both electromagnetic waves and neutrons as complementary probes. We show that the THz dynamics is particu-larly complex in HoMnO3 due to the presence of
sev-eral Ho CF excitations in addition to the Mn spin waves that surprisingly become non-dispersive along the c-axis at low temperature. To interpret the observed spectra and their remarkable temperature dependence through the spin reorientation transition and below, we have per-formed calculations both for Mn and Ho dynamics. Our work brings new insight on the complex spin dynamics of this compound including possible signatures of the cou-plings between the different magnetic ions, but also with their lattice surroundings.
EXPERIMENTAL DETAILS
Single crystals have been grown using the floating zone method, yielding rods of about 7 mm in diameter and 4 cm long. From these crystals, two small plaquettes were cut for the THz measurements (Typically 2 mm in diameter and 300 µm in thickness): one with the c-axis perpendicular to the plaquette, the other one with the c-axis within the plaquette. The polarized THz emission of the synchrotron at SOLEIL was used to probe the THz properties similarly to the study on ErMnO3[11].
Inelastic neutron scattering (INS) measurements were performed at the thermal spectrometer IN8 (ILL) as well as at the 4F1 and 4F2 cold triple-axes spectrometers in-stalled at LLB. The final wave vector used was kf =
2.662, 1.55 or 1.3 ˚A−1 depending on the desired
en-ergy resolution (0.8, 0.25 and 0.12 meV respectively). Higher order reflections were removed using a PG (IN8) or nitrogen cooled Beryllium filter (4F). The sample was mounted to have access to Q = (h, 0, `) scattering wave-vectors and attached to the cold finger of an orange cryo-stat. Several Energy-scans taken along Q = (h, 0, `) were collected to construct the maps shown in Fig. 2and3.
INELASTIC NEUTRON SCATTERING
The magnetic excitations have been first investigated by INS. Figures 2a and 3 give an overview of those re-sults, showing the spectra along a∗, along c∗, and the
temperature dependence measured at the zone centers (1, 0, 0) and (1, 0, 1). Dispersive spin waves are clearly visible along a∗with a maximum of the branches around
17 meV (140 cm−1) while the amplitude of dispersion
along c∗ is much weaker, reflecting the hierarchy of the magnetic interactions much stronger within the ab-planes than in between. In addition to the spin waves, non-dispersive excitations are visible corresponding to transi-tion between CF levels of the two Ho3+ions on 4b and 2a
sites. Remarkably, a significant temperature dependence of the magnetic excitations is visible at TSRas shown at
the zone centers (1, 0, 0) and (1, 0, 1) in Fig.3 where changes of spectral weight are observed for all the exci-tations below 30 cm−1. More surprisingly, along c∗, the
spin waves dispersion disappears gradually below TSR
and finally the corresponding branches remain flat below ≈ 10 K.
The coexistence of both spin waves and CF transitions, along with a subtle temperature evolution, make however the interpretation of those spectra quite complex. Fortu-nately, previous studies [12,19,22,33–37] performed for several members of the RMnO3 provide valuable
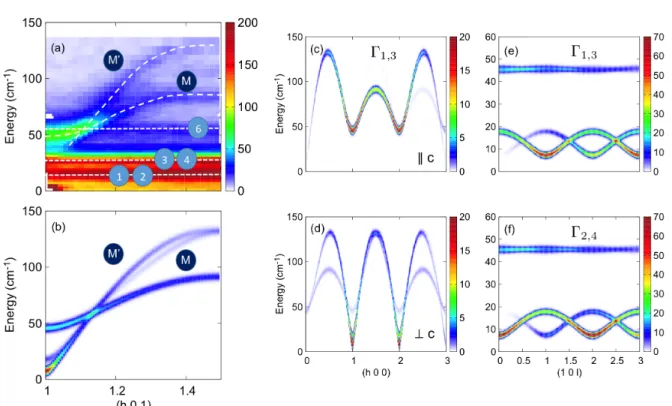
FIG. 2. Spin dynamics in HoMnO3˙(a) Mn3+spin waves and Ho3+CF excitations measured by INS along the (h, 0, 1) reciprocal space direction. These data have been taken on IN8 at 2K with a medium energy resolution of about 0.8 meV. M and M’ denote the Mn dispersive spin waves that can be seen at the zone center. Labels 1-6 refer to non dispersive Ho CF lines. (b)
Comparison with spin wave calculations using the model described in the text for the Γ1,3 configurations of the Mn magnetic
structure. (c,d) Spin wave calculations along (h, 0, 0) in the Γ1,3 configurations for spin fluctuations respectively along the
c-axis and within the basal hexagonal plane. (e-h) Spin wave calculations along (1, 0, `) for the 4 different possible Γi. In the
calculations of panels (b-f), modest but finite values of Dxand Dywere taken into account to ensure the stability of the various
Γi, see Table I. This is responsible for the rise of the small gaps at zone centers. All the spin wave calculations have been
performed using the SpinWave software [38].
following Hamiltonian to describe the Mn spin waves: H =12 X p,hi,ji Ji,jSi,pSj,p+ 1 2 X hi,ji Ki,jSi,1Sj,2 +X i,p Dz(Szi,p) 2 − Dx(Sxi,p) 2 − Dy(Syi,p) 2 (1)
In this expression, Si,pis the Mn spin at site i, p = 1, 2 is
an index that labels the two Mn planes in the unit cell, Dz is an easy plane anisotropy (Dz ≥ 0), and Dx,y ≥ 0
are effective easy axis anisotropies, forcing the spins to point along the x or y directions (see Fig.1). Ji,j is the
antiferromagnetic coupling between neighboring spins in the same plane, and Ki,j the antiferromagnetic coupling
between neighboring spins in adjacent planes. As shown in Fig. 1a, the xM n position allows to distinguish two
different paths for K, a long and a short one, labeled hereafter as K1 and K2. To proceed, we first assume
Dx = 0 and Dy = 0. Straightforward classical
mini-mization ofH shows that the ground state structures are planar 120◦spin configurations. Using the convention of
Figure1, the moments are given by :
Si,p= S cos(φp+ (i− 1)2π3) sin(φp+ (i− 1)2π3 ) 0 (2)
and the classical energy writes: E = −3JS2+ 2(K
1− K2)S2cos ∆φ, with ∆φ = φ2− φ1
(3) The value of φ1 along with the relative phase difference
∆φ = φ2− φ1 between two adjacent planes fully
deter-mine the final structure. These structures can be classi-fied using the Γi=1,2,3,4 irreducible representations listed
in TableI. Note that two 2-dimensional irreducible repre-sentations are also allowed in the P63cm space group but
were not considered in this work. The sign of K1− K2
determines the stability of each phase: Γ1,2 are stabilized
for K1−K2≥ 0, while Γ3,4are stabilized for K1−K2≤ 0.
In principle, six spin wave branches are expected in this model. However, since K1 ≈ K2, these branches
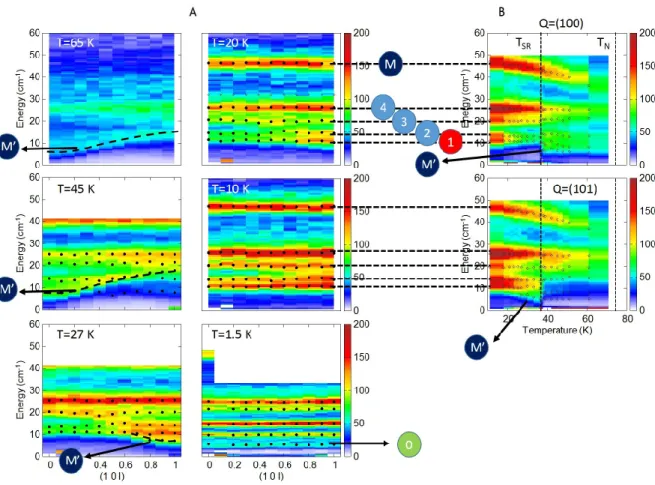
FIG. 3. Panel A: Inelastic neutron scattering color maps in HoMnO3 for the (1, 0, `) reciprocal space direction at different
temperatures, ranging from 65 K down to 1.5 K. The spin reorientation occurs at TSR=37 K. Dispersing spin waves branches
(labeled M and M’)a ssociated to Mn order can be observed at 65, 45 and 27 K. The spectral weight is typical of the Γ2,4
configuration at 65 K and 45 K, but it becomes typical of Γ1,3 at 27 K. In addition, flat modes (0-4), likely Ho crystal field
excitations, are also observed. For the temperatures below 27 K, the spin waves gradually fade away into the CF excitations
and only non-dispersive excitations remain at 1.5 K (below THo). The dots added on the color maps were obtained by gaussian
fits of the individual constant-Q E-scans. Panel B : inelastic neutron scattering color maps in HoMnO3for the (100) and (101)
reciprocal space positions as a function of temperature. The dots added on the color maps were obtained by gaussian fits of the individual constant-Q E-scans. The dashed vertical lines indicate the transition temperatures.
Γi φ ∆φ Conditions
1 π/2 π Dy≥ Dx, K1− K2≥ 0
2 0 π Dy≤ Dx, K1− K2≥ 0
3 0 0 Dy≤ Dx, K1− K2≤ 0
4 π/2 0 Dy≥ Dx, K1− K2≤ 0
TABLE I. Condition for the Mn3+ single-ion anisotropy and
the interplane couplings stabilizing one 3 dimensional mag-netic order of the Mn out of the four irreducible
representa-tions Γi.
modes. Moreover, due to the hexagonal symmetry, these three branches can be described by a single one, stem-ming from (0, 0, `) and going soft at (3, 0, `). The two other branches are identical but stem from (1, 0, `) and (2, 0, `) and go soft respectively at (4, 0, `) and (5, 0, `).
As shown in Fig.2(c,d), spin wave calculations indicate that the former corresponds mostly to correlations be-tween spin components along the c-axis (Fig.2c), while the two latter correspond mostly to in-plane correlations (Fig.2d). As a result, two acoustic-like and one optical-like spin wave emerge from each zone center. The gap ∆ of the latter occurs at around 40 cm−1 (5 meV) and is
related to the easy-plane anisotropy by ∆≈ 3S√DzJ.
As explained above, the degeneracy is lifted as soon as K16= K2. This becomes especially clear when looking at
the dispersion along (1, 0, `). This point is illustrated in Fig.2e-f, showing the calculated spin wave dispersions for the different Γi magnetic configurations. We notice that
the spectral weight of the lowest energy mode is strong at (1, 0, 1) for Γ1,3, and at (1, 0, 0) in the case of Γ2,4.
This change has been put forward in Ref. 19 to explain that the spin reorientation process in HoMnO3involves a
symmetry change from Γ2,4below TN to Γ1,3 below TSR
with a 180◦ rotation of the spins in one of the triangular
layer. This change was attributed to a change of sign of K1 − K2 induced by the change in position of the
Mn ions from xM n = 0.325 above TSR to xM n ≈ 0.334
below. In Ref. 19, the authors assumed Γ1 to be the
ground state. Actually, non linear optical measurements as well as other probes suggest rather a Γ3magnetic order
below TSR [26, 27, 29]. Since the Γ1,3 and Γ2,4 pairs
are homometric, i.e. they cannot be distinguished by unpolarized neutron scattering if xM n is strictly equal to
1/3, we will assume that Γ3is the actual ground state in
the following.
With these results in hand, we come back to the analy-sis of the experimental results. Fig.2b displays the calcu-lated inelastic neutron intensity for Q wave vectors along (h, 0, 1). Using J =2.5 meV and Dz=0.65 meV, the high
energy behavior of the spectrum is well reproduced. For instance, the spin wave labeled M originates from the optical-like mode at ∆. It is clearly visible on Figure
2. In Fig.3 (panel A), it looks like a flat band along c∗
due to the weakness of the interplane couplings K1 and
K2. Finally, as shown in panel B, ∆ hardens towards
45 cm−1 when decreasing temperature. Note that some
renormalisation of the Mn excitations has been reported in HoMnO3as due to magnon-phonon coupling [37].
The second dispersive spin wave labeled M’ is the acoustic-like spin wave mode stemming from the zone center and consisting of two interlaced branches. It can be also identified in Fig.3, thanks to the strong intensity expected for Γ2,4 structures at (1, 0, 0). Below TSR, this
spectral weight jumps to (1, 0, 1), as a result of the tran-sition to Γ1,3. From panel B in Figure 3, the change of
spectral weight from (1,0,0) to (1,0,1) at TSR can also
be noticed. The bandwidth of M’ is well captured for K1− K2= 0.003 meV. The gap of this mode originates
from small single-ion anisotropies of the Mn3+(terms D y
and Dx). An additional origin of anisotropy is expected
to come from the Ho molecular field that should lead to a scaling of the gap with the Ho(4b) ordered moment. Indeed, at the mean field level, the coupling between the 3d and 4f magnetic species writes:
V = X
m,i,p,`
Sm,i gm,i,p,`hJp,`i
where g is the coupling tensor, m, p and i, ` are indices that label the unit cell and the atom for the 3d and rare earth sublattices. hJp,`i is the average magnetic
moment at the rare earth site. Combined with the ex-change Hamiltonian described in Eq. 1, V polarizes the Mn spins, hence plays the role of anisotropy. In principle, this should result in a gap in the spin wave spectrum as observed in YbMnO3 [39]. However, in the present case,
the expected scaling seems not to fully operate probably due to the coupling of the Mn spin waves with Ho CF
excitations.
Indeed, in addition to the spin waves, non-dispersive excitations are also visible in Fig.2and3. These features correspond to CF transitions of the Ho3+ions on 4b and
2a sites and are labeled 0-6. As we shall see in the next part, those labels are also used to describe the THz data (see Figure 4). Note that the mode 5 is not visible in our neutron scattering experiments probably because it overlaps with the magnon M or because its neutron cross section is intrinsically weak. Panel B of Figure3 shows the temperature dependence of CF transition modes 1 to 4. The intensity of those modes gradually increases with decreasing temperature while their positions slightly change, but the most remarkable feature is the formation of an additional line labeled 1 just below TSR. Note that
the line labeled 0 appears at very low temperature only, hence probably due to the Ho ordering on site 2a. In addition, quite strikingly, the dispersion of M’ eventu-ally merges gradueventu-ally below TSRinto those CF lines (at
least into those below 30 cm−1). Finally, the spectrum
encompasses only flat bands below ≈ 10 K.
We point out that this very peculiar temperature evo-lution of M’ shows that this branch crosses several Ho crystal field excitations, which makes very likely hy-bridization mechanisms (via a resonant process) between the Mn spin wave dispersion and the CF lines at low temperature.
SYNCHROTRON BASED THZ SPECTROSCOPY
To get a better insight into the spin dynamics, we have used THz spectroscopy as a complementary probe of both Mn spin waves and Ho Crystal field excitations. In this electromagnetic absorption technique, due to the high ve-locity of photons in the material, the measurements are considered in the long wave length limit and compari-son with neutron data is therefore relevant for the (0, 0, 0) center of the Brillouin zone. There, all Ho crys-tal field excitations should be present. As for the the Mn spin waves, calculations similar to those presented in the previous section show that the four different spin configurations Γi have the same signature at (0,0,0). It
consists of a high energy branch (M) expected around 45 cm−1 which involves correlations between spin
com-ponents perpendicular to the c-axis, and a single low en-ergy branch M’ corresponding to spin correlations along the c-axis that is pushed to finite energy when some spin anisotropy is present (see above and Fig.2).
The THz spectrum of HoMnO3 was first studied in
[31] where the Mn (M) magnon mode as well as several Ho crystal field excitations were observed as a function of external magnetic field. The Mn magnon was more recently investigated under light irradiation [40] while its dependence on the Ho-Mn interaction is reported in [32]. Here, thanks to synchrotron based spectroscopy, we are
0 3 5 8 10 20 30 40 50 0 2 4 6 8 10 20 30 40 50 0 2 4 0 2 4 6 8 10 20 30 40 50 0 2 0 1 2 3 4 Ab so rpti on (mm -1 ) ec hc 6.7 K 34 K 78 K 98 K Re la tive ab so rpti on (mm -1 ) Energy (cm-1) Energy (cm-1) 6.8 K 34 K 78 K 130 K e//c hc 6.0 K 34 K 78 K 98 K Re la tive Abso rpti on (mm -1 ) Energy (cm-1) Ab so rpti on (mm -1 ) ec hc
Sample #2
Sample #1
1 2 3 4 6 M 1 2 3 4 6 M 2 3 4 5FIG. 4. THz absorption spectra of HoMnO3for the 3 different orientations of the electromagnetic wave e, h fields with respect
to the crystal c-axis, using two different samples. Upper panels: absolute absorptions. Lower panels: relative absorptions with a reference above the magnetic ordering temperature at 100 K or 130 K.
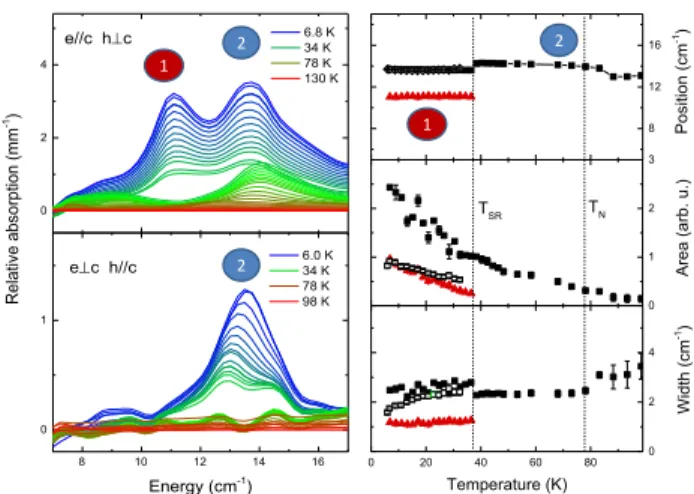
0.0 0.4 0.8 1.2 38 40 42 44 0 20 40 60 80 0 2 4 Area (arb. u.) TN TSR Pos iti on (cm -1) Width (cm -1) Temperature (K) 0 1 2 3 36 40 44 48 2 3 4 5 6K 34K 78K 98K Abs orption (mm -1) ec hc 7 K 34 K 78 K 129 K Energy (cm-1) e//c hc M M M
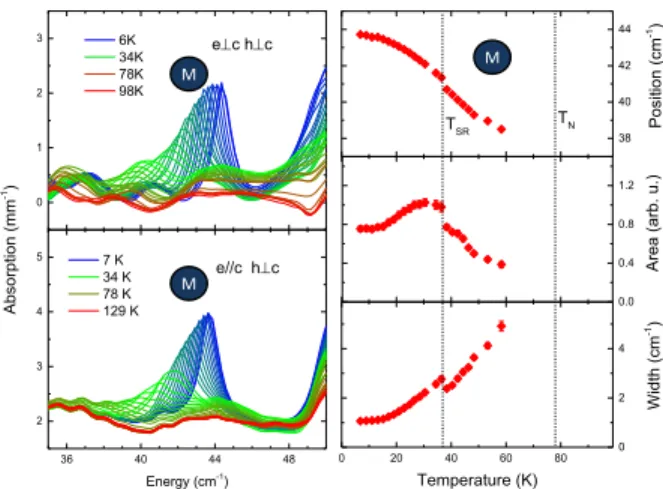
FIG. 5. Details of the THz spectra around the magnon
ex-cited for a THz h field perpendicular to the c-axis. Left:
Absorption measured at different temperatures for two dif-ferent direction of the THz e field on two difdif-ferent samples. Right: results of the gaussian fits of the absorption peak with the position, area and width as a function of temperature ob-tained for e k c (with similar results for e ⊥ c). Note the
emergence of the magnon M below TN and how it is affected
by TSR.
able to measure with great precision the whole spectra from 0.3 to 1.8 THz (10 to 60 cm−1).
All the spectra recorded at different temperatures from 130 K or 100 K down to 6 K are shown in Fig.4 for the three possible orientations (as regards the c-axis) of the THz electric e and magnetic h fields. Several absorp-tion bands are observed from 11 cm−1 up to 55 cm−1,
quite differently from other hexagonal manganites such as YMnO3 or ErMnO3, suggesting the influence of Ho
ions in these THz spectra. Further inspection shows that, for the two different THz polarizations with the same magnetic field direction h⊥c, the spectra are very similar and differ substantially from the case where hk c. This is a strong indication that all the observed excitations are of magnetic origin. The Mn magnon (M) expected around 45 cm−1 is clearly observed for h⊥c and seems to
behave as expected for a conventional magnon by emerg-ing below TN. It shifts to higher energies when the
tem-perature is lowered (see Fig.5). This magnon involves spin components perpendicular to this axis, in agreement with the THz magnetic selection rule h⊥c. The other Mn magnon (M’) involving the spin component along the c-axis is expected at lower energies for h k c but is not easily distinguishable. All the other observed bands are specific to the Ho compound and should be related to Ho
0 1 2 3 8 12 16 0 20 40 60 80 0 2 4 Area (arb. u.) TN TSR Pos iti on (cm -1) Width (cm -1) Temperature (K) 2 0 2 4 8 10 12 14 16 0 1 e//c hc Re lative ab so rption (mm -1) 6.8 K 34 K 78 K 130 K 6.0 K 34 K 78 K 98 K Energy (cm-1) ec h//c 2 2 1 1
FIG. 6. Details of the THz spectra around band 1 and 2. Left: relative absorption measured for two different orientations of e and h on the same sample. Right: results of the gaussian fits for the absorption peaks with the position, area and width as a function of temperature. Closed and open symbols refer to
h⊥c and h k c respectively. Below TSR, two new excitations
appear abruptly: band 1 for h⊥c and band 2 for h k c.
0 2 4 20 25 30 35 0 1 2 3 e//c hc Re lative ab so rption (mm -1) 6.8 K 34 K 78 K 130 K 6.0 K 34 K 78 K 98 K Energy (cm-1) ec h//c 3 3 4 4 0 2 4 6 8 16 20 24 28 0 20 40 60 80 0 2 4 6 Area (arb. u.) TN TSR Pos iti on (cm -1) Width (cm -1) Temperature (K) 3 4
FIG. 7. Details of the THz spectra around band 3 and 4. Left: relative absorption measured for two different orientations of e and h on the same sample. Right: results of gaussian fits for the absorption peaks with the position, area and width as a function of temperature. A maximum of 3 peaks were used. Closed and open symbols refer to h⊥c and h k c respectively. Note the complexity of the spectra with several components
that are all affected by TSR.
crystal field excitations. Quite surprisingly, all spectra are strongly affected by the spin reorientation process at TSR.
A detailed description of the temperature dependence of the spectra are given in Fig.5 to Fig.9. Six different bands (each possibly including several excitations) are clearly visible together with the Mn magnon. The
ab-36 38 40 42 44 0 1 2 0 1 2 Re lative Ab so rption (mm -1) Energy (cm-1) ec hc Abs orption (mm -1) 5.9 K 34 K 83 K 98 K 0 1 2 3 4 38 40 0 20 40 60 80 0 2 4 Area (arb. u.) TN TSR Pos iti on (cm -1) Width (cm -1) Temperature (K) 5 5
FIG. 8. Details of the THz spectra around band 5 when h k c. Left: absolute and relative absorption measured at different temperatures. Right: results of gaussian fits for the absorp-tion peaks with the posiabsorp-tion, area and width as a funcabsorp-tion of temperature. Two peaks are present. The lower energy peak appears smoothly when lowering the temperature and can be fitted below 50 K. The higher energy one, the stronger,
is affected at TSRwith a small shift in energy and increased
width and area.
sorption peaks have been fitted with gaussian profile and their position, spectral weight (area) and lifetime (width) are reported. They all show, at the reorientation tran-sition TSR, a slight change of their position in energy
and more or less pronounced change of spectral weight. In particular band 1 is observable only below TSR and
for h⊥c (see Fig.6). Band 2, always present for h⊥c, is observable only below TSR when h k c (see Fig.6).
Band 3, always present for h⊥c, disappears below TSR
when h k c, while band 4 has a strong increase below TSR (see Fig.7). Note that band 3 below TSR might
have a shoulder and that band 4 encompasses certainly several modes. Finally, band 6 and maybe also band 5 have a side band that increases below TSR (see Figs.8
and9). The Mn magnon (M) is also affected by the spin reorientation at TSR: an abrupt change, although weak,
occurs in its position and line width while its area, which was increasing below TN, starts to decrease and becomes
temperature independent below 10 K (see Fig.5). A comparison with the neutron data can be made keep-ing in mind that neutron scatterkeep-ing measures the imag-inary part of the dynamical susceptibility that is equal to the THz absorption divided by the energy. Both tech-niques show remarkable agreement: At 20 K, below TSR,
the observed five flat bands along (1, 0, `)) in the neutron data (see Fig.3) correspond nicely to band 1 - 4 and to the magnon M observed in THz spectroscopy. The band 6 is also visible as a non dispersive branch at low temper-ature in the neutron data of Fig.2. At 45 K, above TSR,
45 50 55 60 0 1 2 3 4 Re lative Ab so rption (mm -1) Energy (cm-1) 6.8 K 38 K 83 K 130 K e//c hc Abs orption (mm -1) 0 1 2 3 4 52 0 20 40 60 80 0 2 4 Area (arb. u.) TN TSR Pos iti on (cm -1) Width (cm -1) Temperature (K) 6 6
FIG. 9. Details of the THz spectra around band 6 when h⊥c. Left: absolute and relative absorption measured at different temperatures. Right: results of gaussian fits for the absorp-tion peaks with the posiabsorp-tion, area and width as a funcabsorp-tion of temperature. Two peaks are present that are both affected
at TSR.
them correspond to bands 2-3-4 in THz, while the disper-sive magnon M’ is not distinguishable in THz, probably because it is below the energy window of the THz spec-troscopy or mixed inside bands 3-4 (see Fig.3). To go further into the analysis of the different magnon/crystal field contributions and their possible hybridization, we propose additional modeling of the complex Mn and Ho dynamics. We first focus on the crystal field excitations associated to the Ho ions.
CRYSTAL FIELD CALCULATIONS
Crystal field effects were calculated in a point charge model taking into account the whole oxygen coordination shell of the Ho3+ ions (4f10) for site 4b in C
3 symmetry
and site 2a in C3v symmetry [11, 41, 42]. The atomic
coordinates were obtained from a refinement of neutron diffraction data at 10 K [19]. The associated Hamiltonian for each Ho3+ ion in the ground multiplet J=8 can be
expressed as: H4bCF = A 0 2O 0 2+ A 0 4O 0 4+ A 3 4O 3 4− (A 3 4)∗O−34 + A 0 6O 0 6 +A3 6O 3 6− (A 3 6) ∗O−3 6 + A 6 6O 6 6+ (A 6 6) ∗O−6 6 (4) H2aCF = A 0 2O 0 2+ A 0 4O 0 4+ A 3 4(O 3 4− O−34 ) + A 0 6O 0 6 +A3 6(O 3 6− O −3 6 ) + A 6 6(O 6 6+ O −6 6 ) (5) for sites 4b and 2a, in terms of Om
n Racah operators. A
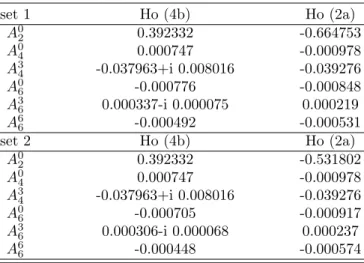
global screening factor of 20% was estimated in order to obtain the transition between the CF levels in the exper-imental energy range. The CF parameters resulting from
this calculation, labeled set 1, are given in TableII. The deduced energy scheme and selection rules are given in Fig.10. For Ho 4b, the energy scheme contains singlet (A) and degenerate doublets (E1L E2). Four different
energy levels are calculated below 100 cm−1. For Ho 2a,
two singlets (A1, A2) and one doublet (E) are present
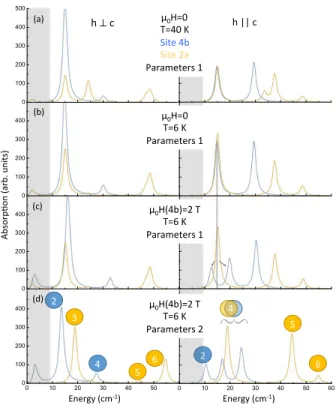
with four different energy levels in the same energy range. They are all allowed to occur for any orientation of the THz magnetic field. The calculated absorption is shown in Fig. 13(a) and (b) for both orientations of the THz magnetic field h at 40 K and 6 K respectively. The en-ergy and relative intensities of the highest enen-ergy bands 5 and 6 are correctly reproduced. However the agreement between the calculations and the observed complex set of mixed excitations below 30 cm−1 is less accurate.
set 1 Ho (4b) Ho (2a) A0 2 0.392332 -0.664753 A0 4 0.000747 -0.000978 A3 4 -0.037963+i 0.008016 -0.039276 A0 6 -0.000776 -0.000848 A3 6 0.000337-i 0.000075 0.000219 A6 6 -0.000492 -0.000531 set 2 Ho (4b) Ho (2a) A0 2 0.392332 -0.531802 A0 4 0.000747 -0.000978 A3 4 -0.037963+i 0.008016 -0.039276 A0 6 -0.000705 -0.000917 A3 6 0.000306-i 0.000068 0.000237 A6 6 -0.000448 -0.000574
TABLE II. CF parameters of sets 1 and 2 for the two Ho sites in the Racah formalism (see text).
A1↔#A2# E↔#E#
A1,2↔#E# E↔#E#
Ho#Site#4b#(C3#symmetry)# Ho#Site#2a#(C3v#symmetry)#
E1⊕E2↔!E1⊕E2! A↔#A#
E1⊕E2↔#E1⊕E2# A↔E1⊕E2# 2# 2# 4# 4# A# A# E1⊕E2# E1⊕E2# 99#cm;1# 0;0.6#cm;1# E1⊕E2# 3# 5# 6# 3# 5# 6# A1# A2# E# E# E# 5# 0;1.6#cm;1# 15#cm;1# 39#cm;1# 49#cm;1# 6# 2# 4# 15#cm;1# 30#cm;1# 3# hk c h? c hk c h? c
FIG. 10. Crystal field scheme and selection rules of the pa-rameters set 1 for the two different Holmium sites with a tentative matching of the calculated CF transitions with the observed THz bands: Two transitions are expected for site 4b corresponding to band 2 and 3 and three for site 2a cor-responding to band 4, 5 and 6. The selection rules and the symmetry of the levels are indicated below.
To go further, we took into account the coupling of the Ho 4b magnetic moments with the Mn ones expected
to occur below TSR(discarding a possible magnetic
cou-pling of the Ho 2a with Mn) [29]. This was achieved by including in the calculations the influence of the local magnetic field produced by the Mn moments on the Ho 4b site, similarly to the case of ErMnO3 [11]. This field
was chosen along the axis according to the observed c-direction of the Ho ordered magnetic moments. Its value was adjusted at 2 T so that the ordered Ho 4b magnetic moment extracted from the neutron diffraction data is reproduced at low temperature (see Appendix I). The influence of this magnetic field is to change slightly the energy of some peaks and to produce additional splitting of some CF levels (see Fig.11b and c for the parameter set 1). We can notice in particular that the lowest en-ergy CF peak corresponding to Ho 4b (in blue) in zero field splits into two peaks under magnetic field. However, experimentally, there are abrupt changes at TSR for all
the THz bands, both on their position and their inten-sity, which cannot be accounted for by the sole effects of temperature and molecular field. This is a strong indi-cation that electric effects with modifiindi-cation of electric charge screening are at play at TSR. This is further
cor-roborated by the observation simultaneously of a sharp anomaly in the dielectric constant as well as a jump in the electric polarisation along the c-axis [30].
With little additional changes of some CF parameters (set 2 in TableII), we can reproduce qualitatively most of the observed features in the THz spectra (see Fig. 13d for T=6 K and a field of 2 T). In particular, bands 2, 3, 4, 5 and 6 are predicted at energies closer to the measured ones, although there are still some discrepancies with the calculated intensities. The presence of peak 3 above TSR
for hk c and its disappearance below TSR while a new
peak labeled 2 appears at lower energy could be due to the field splitting ascribed to the Ho-Mn coupling. Band 4 for hk c below TSR could then result from a mixture
of several peaks including the higher energy mode from the split peak (see horizontal bracket in Fig. 13d).
Strikingly, for h⊥ c, band 1 appearing at TSR in the
measurements is missing in the calculations and therefore cannot be accounted for by the effect of a magnetic field. This discrepancy between calculations and experiment is another indication that hybridization is at play between Ho CF excitations and the lowest energy Mn magnon (M’).
DISCUSSION
Our analysis and calculations for the Mn magnetic or-der and associated spin waves, using the spin Hamilto-nian of eq.1, can account for most of the experimental data. Mainly, two spin branches M and M’ are observed with INS that are correctly calculated (Fig.2 and3). In particular, the spin reorientation at TSR is clearly seen
as a change in the spin wave dispersion along c∗ for the
0 10 20 30 40 50 60 0 100 200 300 400 500 A b so rp tio n ( a rb . u n its ) Energy (cm-1) 0 10 20 30 40 50 60 0 100 200 300 400 0 10 20 30 40 50 60 0 100 200 300 400 0 10 20 30 40 50 60 0 100 200 300 400 h"||"c" h"⊥"c" 0 10 20 30 40 50 60 0 100 200 300 400 0 10 20 30 40 50 60 0 100 200 300 400 0 10 20 30 40 50 60 0 100 200 300 400 Energy"(cm-1)" Energy"(cm-1)" Ab so rp 5o n" (ar b." un its )" 2 2 5 6 6 5 4 3 4" 0 10 20 30 40 50 60 0 100 200 300 400 500 A b so rp tio n ( a rb . u n its ) Energy (cm-1) µ0H=0" T=40"K" Site"4b" Site"2a" Parameters"1" µ0H=0" T=6"K" Parameters"1" µ0H(4b)=2"T"" T=6"K" Parameters"1" µ0H(4b)=2"T" T=6"K" Parameters"2"
{
(a)" (b)" (c)" (d)"FIG. 11. Calculated CF THz absorption spectra for both
orientations of the THz magnetic field h and for Ho sites 4b (blue) and 2a (yellow), using parameters set 1 at 40 K and zero magnetic field (a), at 6 K and zero magnetic field (b) and at 6 K with a 2 T magnetic field parallel to the c-axis. The dashed line and the two grey arrows for h k c indicate the splitting of the lowest energy Ho 4b CF excitation under magnetic field. Panel (d) corresponds to the calculations performed using the parameter set 2 at 6 K and under a magnetic field of 2 T along the c-axis with a tentative matching of the calculations with the measured bands of excitations.
branch M’ and is correctly captured when the change of Mn spin configuration from Γ4 to Γ3 is introduced. The
second branch M is also observed with THz spectroscopy (Fig.5), in agreement with the model. As for the non dis-persive Ho CF excitations observed with INS and THz spectroscopy, our calculations using the CF hamiltonian described by eq.4 and 5 is able to reproduce the exper-imental data qualitatively when two ingredients are in-cluded: first, a change in charge screening at TSR that
explains the observed shifts and changes in intensity of the whole CF spectrum, and second, a molecular field along the c-axis produced by the Mn order. Similarly, a molecular field produced by the Ho 4b order may be introduced to account for the increased anisotropy gap in the Mn spin wave branch M’. However our calcula-tions do not agree quantitatively with the whole experi-mental data: they cannot describe properly how the Mn spin branch M’ become non dispersive along (1, 0, `) and seems to merge into Ho CF excitations below 20 K. More-over, they cannot explain the THz band 1 that appears at TSR and is locked at 3 cm−1 below band 2 (Fig.6).
Ad-ditional ingredients should be at play there, that couple the 3d and 4f magnetic species dynamically.
It is possible for Mn Magnons and Ho crystal field ex-citations to hybridize, if they are close in energy, which is the case for the Ho manganite where 6 different Ho crys-tal field excitations lie in the energy range of the Mn spin waves (see Fig.??). They also should not be forbidden by symmetry. This can be checked using a group represen-tation analysis for both the Mn spin waves and the Ho crystal field excitations : if they contain at least one com-mon irreducible representation, the coupling is allowed. The details are given in appendix II. According to [43], for the Mn magnetic orders with zero propagation vector corresponding to the four different one dimensionnal Γi,
the spin wave representation may be decomposed into τ = A2L B1L E1L E2 where we use the irreducible
representations of the C6v (6mm) point group. For Ho
4b and 2a crystal field excitations, their decompositions are already given in Fig.10, in the local point groups as-sociated to the two different sites: C3(3) for Ho 4b, and
C3v (3m) for Ho 2a. Their energy scheme contains
sin-glets (A for Ho 4b, A1, A2 for Ho 2a) and doublets (E1,
E2 for Ho 4b, E for Ho 2a). To infer compatibility with
those of the Mn magnons, we must consider their decom-position into the irreducible representations of the C6v
point group. For Ho 4b, singlets A are decomposed into {A1, A2, B1, B2} and degenerate doublets (E1L E2 are
decomposed into{E1, E2}. As for the Ho 2a, singlets A1
and A2 are decomposed into {A1, B2} and {A2, B1}
re-spectively, and doublets E into{E1, E2} as for Ho 4b. It
can be easily seen that they all have in common at least one irreducible representation contained in the Mn spin wave representation except for Ho 2a A1 singlet that is
calculated around 40-45 cm−1 and corresponds to band
5.
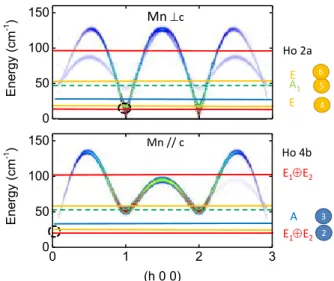
We conclude then that, in the energy range relevant for the experimental data reported in this study, all the CF excitations, except one (band 5 associated to Ho 2a), are allowed to couple to Mn spin waves. Looking back at neutron experiments and the spin wave calculations reproduced in Fig.12, it can be seen that, when the tem-perature is lowered close to TSR, the magnon M’ with
small gaps at the zone centers (1,0,0) and (1,0,1) become close in energy to Ho (4b) CF excitations (bands 2 and 3-4), with different spectral weight for the magnons de-pending on the magnetic order Γ1,3 or Γ2,4. A coupling
mechanism may be at play here that contributes to the spin reorientation process and the lost of dispersion for M’ along c∗.
It is worth noting that Ho and Mn ordered magnetic moments below TSR are orthogonal. This suggests that,
in the Mn - Ho coupling Hamiltonian of eq., the coupling tensor g shows non diagonal terms, as it is the case for in-stance for the pseudo dipolar, the Dzyaloshinkii-Moriya interaction [39] or the highest order trigonal anisotropy [44]. Furthermore, the 2 T effective magnetic field
expe-Mnc Mn // c E1E2 A E1E2 E E A1 Ho 4b Ho 2a 0 50 100 150 Energy (cm -1 ) 0 1 2 3 0 50 100 150 Energy (cm -1 ) (h 0 0) 4 5 6 3 2
FIG. 12. (a) Mn spin wave calculations along (h, 0, 0) for spin fluctuations within the (a, b) plane (upper panel) and along the c-axis (lower panel). The calculated CF levels are added for the Ho 4b site (red and blue lines) as well as the Ho 2a site (yellow and green lines). The coupling of these CF excitations with the Mn magnons is always allowed by symmetry for all but for the dashed one.
rienced by the 4b Ho suggests a coupling strength g ∼ 0.1 K. In this context and given the neutron scattering data and the CF analysis detailed above, we may to con-sider a possible dynamical coupling between i) in plane Mn spin wave modes with Ho CF transitions polarized along the c-axis and ii) out of plane Mn spin wave modes with Ho CF transitions polarized in the (a,b) plane. In this view, it is tempting to assign band 1 to the Mn spin wave hybridized with band 2 (and also likely with band 3). In this scenario, the in plane character of the CF transitions would be transferred to the hybrid mode which would now appear in the h⊥c channel as observed experimentally in the THz measurements. This hybridis-ation occurs only below TSRwhen the spectral weight of
these excitations is enhanced and their energy matches. The energy difference between band 1 and 2, around 3 cm−1 experimentally, is in agreement with the coupling
strength g when all the Ho-Mn links are considered (12 of them).
CONCLUSION
To summarize, we have reexamined the THz dynam-ics present in the multiferroic compound HoMnO3. The
peculiarity of this Ho compound in the hexagonal man-ganites is the occurrence of a spin reorientation below TSR=37 K. Remarkably, several Ho CF excitations are
present in the same energy range as the Mn spin waves. Thanks to the complementary neutron and electromag-netic wave probes, we have identified five Ho 4b and Ho
2a CF excitations and shown how Mn spin waves as well as Ho CF are affected by the reorientation process at TSR. Using spin wave and CF calculations, we are able
to reproduce qualitatively most of the observed features. At TSR, the Mn spin configuration switches from the
high temperature Γ4 configuration to Γ3. A change in
the spectral weight is observed along the (1, 0, `) direc-tion that is correctly calculated in a simple hamiltonian for the Mn win waves. At the same time, changes occur in the CF excitations that can be accounted for when coupling to the lattice and surrounding oxygen charges are introduced. Then, Ho CF excitations start to match in energy the Mn branch at different Brillouin zone cen-ters. Further inspection of the neutron and THz data points towards additional Ho-Mn coupling mechanisms that show up below TSRin two different ways : first as an
additional excitation observed in THz spectroscopy that is locked 3 cm−1below a CF excitation and secondly the
progressive disappearance of the Mn dispersion along c∗.
Our detailed study on HoMnO3gives finally new insight
on the very rich rare earth - transition metal dynamical couplings that show up in the THz range.
This work was financially supported by the ANR-13-BS04-0013-01.
APPENDIX I
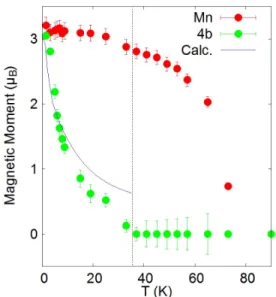
In the Ho CF calculations, we introduce a constant magnetic field to simulate the effect of the Ho-Mn cou-pling. We used the measured Ho 4b and Mn ordered mo-ment extracted from neutron diffraction data [39]: Ho 4b moments are observed along the c-axis; a molecular field of 2 T along this direction is able to polarize Ho spins with the correct magnitude and temperature dependence at least below 10 K (see Fig.13). The Mn moment varies only slightly below TSR thus validating the assumption
of a constant molecular field.
APPENDIX II
For Mn Magnons and Ho crystal field excitations to hybridize, there may be symmetry requirements that can be derived through a group representation analysis for the Mn spin waves and the Ho crystal field excitations. The Mn order with zero propagation vector is described by the isomorphic space group C3
6v. The Mn spin wave
representations can be reduced into representations of the associated point group C6v (6mm). This group contains
the lower symmetric C3 (3) and C3v (3m)that are best
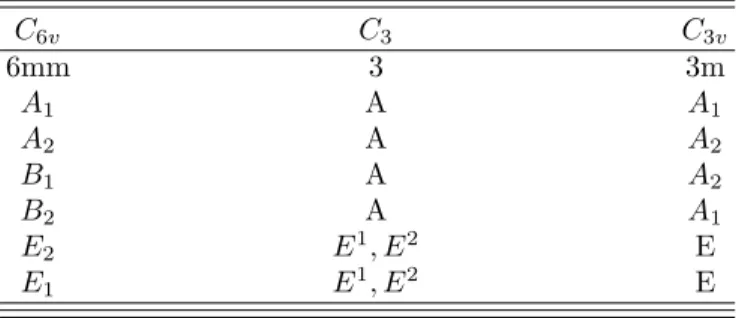
describing the Ho CF shemes. In the present analysis, to look at possible coupling mechanisms with the Mn spin waves, we will rewrite the CF representations in the more symmetric C6v. Its character table is given in tableIII.
FIG. 13. Temperature dependence of the ordered magnetic moments Ho 4b extracted from the refinement of the neutron diffraction data (black dots) compared to the calculated mag-netic moment (blue line) induced by a contant magmag-netic field of 2 T due to the coupling with the Mn magnetism. The red stars show the Mn ordered moment also extracted from the neutron diffraction data.
The symmetry of the different Mn spin waves have been reported in [43] with Kovalev notation. We will rather use Mulliken notation. To simplify calculations, the spin wave analysis has been performed in a more symmetric space group than C3
6v, namely D46h, which
means neglecting some oxygen displacements and there-fore some weak magnetic anisotropies. From [43], it fol-lows that the spin wave representation can be decom-posed into A2gL B1gL E1gL E2g. Going back to the
lower symmetric C3
6v space group, gerade und ungerade
modes are no longer relevant so that the spin wave de-composition becomes A2L B1L E1L E2. When spin
anisotropies are introduced, the degeneracy of the low energy branches is lifted as can be seen in our spin wave calculations (Fig.2), dictating the use of magnetic Shub-nikov groups.
For Ho CF schemes, The character tables for the as-sociated point groups C3 (3) and C3v (3m) are reported
in tableIVand V. Their correlations to the more sym-metric C6v group that we will use are given in tableVI.
For Ho 4b, in its local C3 symmetry, two different kind
of symmetry are present for the crystal field states: sin-glets are described by the irreducible representation A and degenerate doublets described by E1L E2. These
ir-reducible representations induce, in the higher symmetric C6v group, states that are decomposed into linear
combi-nations of{A1, A2, B1, B2} for the singlets and {E1, E2}
for the degenerate doublets. For the Ho 2a, in the local C3v symmetry, three different symmetries are present:
singlets A1and A2, and doublets E. They induce, in C6v
symmetry, states that are decomposed into{A1, B2} and
{A2, B1} respectively for the singlets and {E1, E2} for
the doublets.
From these considerations, we can now look at possible coupling between the Mn spin waves and the Ho 4b and 2a crystal field excitations that are allowed by symme-try, that is if their representations contain at least one common irreducible representation. This is the case fot all CF excitations except for the Ho 2a A1 singlets.
TABLE III. C6v (6mm) character table
C6V 6mm 1 2 3 6 md mv functions Multiplicity - 1 1 2 2 3 3 . A1 Γ1 1 1 1 1 1 1 z, x2+ y2, z2 A2 Γ2 1 1 1 1 -1 -1 Jz B1 Γ3 1 -1 1 -1 1 -1 . B2 Γ4 1 -1 1 -1 -1 1 . E2 Γ5 2 2 -1 -1 0 0 z, x2− y2, xy E1 Γ6 2 -2 -1 1 0 0 x, y, xz, yz Jx, Jy
TABLE IV. C3 (3) character table
C3 3 1 3+ 3− functions A Γ1 1 1 1 z, x2+ y2, Jz E2 Γ2 1 ω2 ω x, y, xz, yz, x2 − y2, xy,J x,Jy E1 Γ3 1 ω ω2
TABLE V. C3v (3) character table
C3v 3m 1 3 m functions
Multiplicity - 1 2 3
A1 Γ1 1 1 1 z, x2+ y2, z2
A2 Γ2 1 1 -1 Jz
E Γ3 2 -1 0 x, y, xz, yz, x2− y2, xy,Jx,Jy
All the tables reproduced here where established thanks to [45].
∗
Current address: Universit´e de Lorraine, CNRS, CRM2,
F-54000 Nancy, France †
[1] A. Pimenov, A. A. Mukhin, V. Yu. Ivanov, V. D. Travkin, A. M. Balbashov, A. Loidl, Nat. Phys. 2 97 (2006). [2] A. B. Sushkov, R. V. Aguilar, S. Park, S-W. Cheong, and
H. D. Drew, Phys. Rev. Lett. 98, 027202 (2007).
TABLE VI. Correlations between the global frame point
group C6v (6mm) and the two local frame point groups C3
(3) and C3v(3m) C6v C3 C3v 6mm 3 3m A1 A A1 A2 A A2 B1 A A2 B2 A A1 E2 E1, E2 E E1 E1, E2 E
[3] N. Kida, D. Okuyama, S. Ishiwata, Y. Taguchi, R. Shi-mano, K. Iwasa, T. Arima, and Y. Tokura Phys. Rev. B 80, 220406(R)(2009).
[4] S.P.P. Jones, S.M. Gaw, K.I. Doig, D. Prabhakaran, E.M.
H´etroy Wheeler, A.T. Boothroyd, and J. Lloyd-Hughes,
Nature Com. 5, 3787 (2014).
[5] H. Katsura, A.V. Balatsky,and N. Nagaosa, Phys. Rev. Lett. 98, 027203 (2007).
[6] M. Mochizuki, N. Furukawa,and N. Nagaosa, Phys. Rev. Lett. 105, 037205 (2010).
[7] M. Mochizuki, N. Furukawa,and N. Nagaosa, Phys. Rev. Lett. 104, 177206 (2010).
[8] L. Chaix, S. de Brion, F. L´evy-Bertrand, V. Simonet, R.
Ballou, B. Canals, P. Lejay, J. B. Brubach, G. Creff, F. Willaert, P. Roy, and A. Cano, Phys. Rev. Lett. 110, 157208 (2013).
[9] A. A. Sirenko, S. M. OMalley, K. H. Ahn, S. Park, G. L. Carr, and S.-W. Cheong, Phys. Rev. B 78, 174405 (2008).
[10] T. D. Kang, E. Standard, K. H. Ahn, A. A. Sirenko, G. L. Carr, S. Park, Y. J. Choi, M. Ramazanoglu, V. Kiryukhin, and S.-W. Cheong, Phys. Rev. B 82, 014414 (2010).
[11] L. Chaix, S. de Brion, S. Petit, R. Ballou, L.-P. Regnault, J. Ollivier, J.-B. Brubach, P. Roy, J. Debray, P. Lejay, A. Cano, E. Ressouche and V. Simonet, Phys. Rev. Lett. 112, 137201 (2014).
[12] S. Pailh`es, X. Fabr`eges, L. P. R´egnault, L.
Pinsard-Godart, I. Mirebeau, F. Moussa, M. Hennion, and S. Petit, Phys. Rev. B 79, 134409 (2009).
[13] S. T´oth, B. Wehinger, K. Rolfs, T. Birol, U. Stuhr,
H. Takatsu, K.Kimura,T. Kimura, H.M. Rønnow, and
C.R¨uegg, Nature Com. Y,13547 (2016).
[14] I. Aupiais, M. Mochizuki, H. Sakata, R. Grasset, Y. Gal-lais, A. sacuto, and M. Cazayous, npj Quantum Materials 3, 60 (2018).
[15] E. F. Bertaut, F. Forrat, and P. Fang, Compt. Rend. Acad. Sci.(Paris) 256, 1958 (1963).
[16] T. Katsufuji, M. Masaki, A. Machida, M. Moritomo, K. Kato, E. Nishibori, M. Takata, M. Sakata, K. Ohoyama, K. Kitazawa, and H. Takagi, Phys. Rev. B 66, 134434 (2002).
[17] S.W. Cheong, M. Mostovoy, Nature materials, 6, 13 (2007).
[18] H. Sim, J. Oh, J. Jeong, M. Duc Le, and J.-G. Park, Acta Crystallogr., Sect. B 72, 3 (2016).
A. Forget, M. T. Fernandez-Diaz, and F. Porcher, Phys. Rev. Lett. 103, 067204 (2009).
[20] S. Lee, A. Pirogov, M. Kang, K.-H. Jang, M. Yone-mura, T. Kamiyama, S.-W. Cheong, F. Gozzo, N. Shin, H. Kimura, Y. Noda and J.-G. Park, Nature 451, 805 (2008).
[21] I. V. Solovyev, and S.A. Nikolaev, Phys. Rev. B 90, 184425 (2014).
[22] X. Fabr`eges, I. Mirebeau, P. Bonville, S. Petit, G.
Lebras-Jasmin, A. Forget, G. Andr´e, and S. Pailh`es, Phys. Rev.
B 78, 214422 (2008).
[23] S. Chattopadhyay, V. Simonet, V. Skumryev, A. A. Mukhin, V.Y. Ivanov, M. I. Aroyo, D. Z. Dimitrov, M. Gospodinov, and E. Ressouche, Phys. Rev. B 98, 134413 (2018).
[24] T. Lottermoser, T. Lonkai, U. Amann, D. Hohlwein, J. Ihringer, and M. Fiebig, Nature 430, 541 (2004). [25] A. Munoz, J. A. Alonso, M. J. Mart´ınez-Lope, M. T.
Cas´ais, J. L. Mart´ınez, and M. T. Fern´andez-Diaz, Chem.
Mater. 13, 1497 (2001).
[26] M. Fiebig, C. Degenhardt, R. V. Pisarev, J. App. Phys. 91, 8867 (2002).
[27] P. J. Brown and T. Chatterji, J. Phys. Condens. Matter 18, 10085 (2006).
[28] P. J. Brown and T. Chatterji, Phys. Rev. B 77, 104407 (2008).
[29] S. Nandi, A. Kreyssig, L. Tan, J. W. Kim, J. Q. Yan, J. C. Lang, D. Haskel, R. J. McQueeney, and A. I. Goldman, Phys. Rev. Lett. 100, 217201 (2008).
[30] N. Hur, I.K. Jeong,M .F. Hundley, S.B. Kim and S.-W. Cheong, Phys. Rev. B 79, 134120 (2009).
[31] D. Talbayev, A.D. LaForge, S.A. Trugman, N. Hur, A.J. Taylor, R.D. Averitt and D.N. Basov, Phys. Rev. 101, 247601 (2008).
[32] N.J. Laurita, Yi Luo, Rongwei Hu,, Meixia Wu, S.W. Cheong, O. Tchernyshyov and N.P. Armitage, Phys. Rev. Lett. 119, 227601 (2017).
[33] T. J. Sato, S. -H. Lee, T. Katsufuji, M. Masaki, S. Park, J. R. D. Copley, and H. Takagi, Phys. Rev. B 68, 014432 (2003).
[34] J. Park, J.-G. Park, Gun Sang Jeon, Han-Yong Choi, Changhee Lee, W. Jo, R. Bewley, K. A. McEwen, and T. G. Perring, Phys. Rev. B 68, 104426 (2003).
[35] O. P. Vajk, M. Kenzelmann, J. W. Lynn, S. B. Kim, and S.-W. Cheong, Phys. Rev. Lett. 94, 087601 (2005).
[36] S. Petit, F. Moussa, M. Hennion, S. Pailh`es, L.
Pinsard-Gaudart, and A. Ivanov, Phys. Rev. Lett. 99, 266604 (2007).
[37] T. Kim, J. Leiner, K. Park, J. Oh, H. Sim, K. Iida, K. Kamazawa, and J.-G. Park, Phys. Rev. B 97, 201113(R) (2018).
[38] http://www-llb.cea.fr/logicielsllb/SpinWave/SW.html
[39] X. Fabr`eges, PhD thesis, Universit´e Paris Sud -Paris XI
(2010)
[40] P. Bowlan, S.A. Trugman, J. Bowlan, J.-X. Zhu, N.J. Hur, A.J. Taylor, D.A. Yarotski and R.P. Prasankumar, Phys. Rev. B 94, 100404(R) (2016).
[41] K. W. H. Stevens, Proc. Roy. Soc. (London) A65, 209 (1952).
[42] M. T. Hutchings, Solid State Physics: Advances in
Research and Applications, ed. F.Seitz and B.Turnbull (New York: Academic) 16, 227 (1965).
[43] W. Sikora, O.V. Gurin and V.N. Syromyatnikov, Journal of Magnetism and Magnetic Materials 71, 225 (1988). [44] S.G. Condran and M.L. PLumer, J. Phys.: Condens.
Matter 22, 162201 (2010).
[45] M. I. Aroyo, A. Kirov, C. Capillas, J. M. Perez-Mato and H. Wondratschek, Acta Cryst. A62, 115-128 (2006).