HAL Id: hal-01631578
https://hal.inria.fr/hal-01631578
Submitted on 9 Nov 2017
HAL is a multi-disciplinary open access
archive for the deposit and dissemination of
sci-entific research documents, whether they are
pub-lished or not. The documents may come from
teaching and research institutions in France or
abroad, or from public or private research centers.
L’archive ouverte pluridisciplinaire HAL, est
destinée au dépôt et à la diffusion de documents
scientifiques de niveau recherche, publiés ou non,
émanant des établissements d’enseignement et de
recherche français ou étrangers, des laboratoires
publics ou privés.
on diffusion tractography
Klaus Maier-Hein, Peter F. Neher, Christophe Houde, Marc-Alexandre Côté,
Eleftherios Garyfallidis, Jidan Zhong, Maxime Chamberland, Fang-Chen Yeh,
Ying-Chia Lin, Qing Ji, et al.
To cite this version:
Klaus Maier-Hein, Peter F. Neher, Christophe Houde, Marc-Alexandre Côté, Eleftherios Garyfallidis,
et al.. The challenge of mapping the human connectome based on diffusion tractography. Nature
Communications, Nature Publishing Group, 2017, 8 (1), �10.1038/s41467-017-01285-x�. �hal-01631578�
The challenge of mapping the human connectome
based on diffusion tractography
Klaus H. Maier-Hein
Tractography based on non-invasive diffusion imaging is central to the study of human brain
connectivity. To date, the approach has not been systematically validated in ground truth
studies. Based on a simulated human brain data set with ground truth tracts, we organized an
open international tractography challenge, which resulted in 96 distinct submissions from 20
research groups. Here, we report the encouraging
finding that most state-of-the-art
algo-rithms produce tractograms containing 90% of the ground truth bundles (to at least some
extent). However, the same tractograms contain many more invalid than valid bundles, and
half of these invalid bundles occur systematically across research groups. Taken together, our
results demonstrate and con
firm fundamental ambiguities inherent in tract reconstruction
based on orientation information alone, which need to be considered when interpreting
tractography and connectivity results. Our approach provides a novel framework for
esti-mating reliability of tractography and encourages innovation to address its current
limitations.
Correspondence and requests for materials should be addressed to K.H.M.-H. (email:[email protected]) or to M.D. (email:[email protected])
#A full list of authors and their affliations appears at the end of the paper
123456789
T
ractography, a computational reconstruction method based
on diffusion-weighted magnetic resonance imaging (DWI),
attempts to reveal the trajectories of white matter pathways
in vivo and to infer the underlying structural connectome of the
human brain
1. Numerous algorithms for tractography have been
developed and applied to connectome research in the
field of
neuroscience
2and psychiatry
3. Given the broad interest in this
approach, advantages and shortcomings of tractography have
been addressed using a wide range of approaches
1,4–8.
Particu-larly, in vivo tractography of the human brain has been evaluated
by subjective assessment of plausibility
9, 10or qualitative visual
agreement with post-mortem Klingler-like dissections
11, 12.
Reproducibility
13or data prediction errors
14–16have been
eval-uated in the context of tractography model verification. However,
these evaluations cannot validate the accuracy of reconstructions
due to the lack of ground truth information
17. Ex vivo imaging
and tracing
17–23or physically
24–30and numerically simulated
phantoms
31–34allow validation to some extent, and in specific
circumstances such as basic
fiber configurations. The nervous
system, however, is complex and precise ground truth
informa-tion on the trajectories of pathways and their origins, as well as
terminations in the human brain is lacking. This makes it hard to
obtain quantitative and comprehensive reliability estimations of
tractography and to determine which discoveries are reliable
when regarding brain connectivity in health and disease.
State-of-the-art tractography algorithms are driven by local
orientation
fields estimated from DWI, representing the local
tangent direction to the white matter tract of interest
1.
Conceptually, the principle of inferring connectivity from local
orientation
fields can lead to problems as soon as pathways
overlap, cross, branch, and have complex geometries
7,35,36. Since
the invention of diffusion tractography, these problems have been
discussed
in
schematic
representations
or
theoretical
arguments
7, 8, 37, but have not yet been quantified in brain
imaging. To determine the current state of the art in tractography,
we
organized
an
international
tractography
competition
(
tractometer.org/ismrm_2015_challenge
).
We
employed
simulated DWI of a brain-like geometry as a novel reliability
estimation method that allowed for a quantitative evaluation
of the submissions based on the Tractometer connectivity
metrics
38.
At the closing of the competition, we evaluated 96 distinct
tractography pipelines submitted by 20 different research groups,
in order to assess how well the algorithms were able to reproduce
the known connectivity. We also assessed essential processing
steps to pinpoint critical
flaws that many current pipelines have in
common. An important positive
finding is that most proposed
algorithms are able to produce tractograms containing 90% of the
ground truth bundles, recovering about one-third of their
volu-metric extent. At the same time, most algorithms produce large
amounts of false-positive bundles, even though they are not part
of the ground truth. Results do not improve when employing
higher-quality data or even using the gold standard
field of local
tract orientations at high spatial resolution. The
findings highlight
that novel technological and conceptual developments are needed
to address these limitations.
Real MRI image Bundle segmentation Synthetic bundle model Combined synthetic model Synthetic diffusion-weighted and T1 image CC Cg OR Fx CP CA SCP MCP ICP POPT CST FPT ILF SLF UF MCP-T SCP-R T ICP-RH FPT -RT CST -RT POPT -R T SCP-RH OR-R T CP-T ILF-R T SLF-R T OR-RH POPT -RH CA-T Fx-T UF-RT ICP-R T ICP-L T POPT -L T CST -LT FPT -LT ICP-LHSCP-L T MCP-HSCP-LH OR-L T CP-H ILF-L T SLF-L T OR-LHPOPT-LH CA-H Fx-H UF-LT Cg-LT CST-LH FPT-LH ILF-LH UF-LH Cg-LH SLF-LH CC-H CC-T SLF-RH Cg-RH UF-RH ILF-RH FPT-RH CST-RH Tractography Cg-RT
Fig. 1 Overview of synthetic data set. The top row summarizes the phantom generation process. The simulated images are generated from 25 major bundles, which are shown in the bottom part of thefigure. These were manually segmented from a whole-brain tractogram of a HCP subject and include the CC, cingulum (Cg), fornix (Fx), anterior commissure (CA), optic radiation (OR), posterior commissure (CP), inferior cerebellar peduncle (ICP), middle cerebellar peduncle (MCP), superior cerebellar peduncle (SCP), parieto-occipital pontine tract (POPT), cortico-spinal tract (CST), frontopontine tracts (FPT), ILF, UF, and SLF. The connectivity plot in the middle shows the phantom design. The segment positions correspond to the involved endpoint region (from top to bottom: frontal lobe, temporal lobe, parietal lobe, occipital lobe, subcortical region, cerebellum, brain stem). The radial segment length and the connection number in the plot are chosen according to the volume of the respective bundle endpoint region. Abbreviations: right (R) and left (L) hemisphere, head (H) and tail (T) of each respective bundle
Results
Data sets and submissions. Prior investigations of tractography
methodology have chosen artificial fiber geometries to construct
synthetic ground truth models
26,38. Here, we defined our models
based on the
fiber bundle geometry of a high-quality Human
Connectome Project (HCP) data set that was constructed from
multiple whole-brain global tractography maps
39(Fig.
1
). Following
the concepts introduced in ref.
40, an expert radiologist
(B.S.) extracted 25 major tracts (i.e., bundles of streamlines) from
the tractogram. This ground truth data set included association,
projection, and commissural tracts that have been previously
described using post-mortem anatomical and electrophysiological
methods
41. In total the tracts occupy 71% of the white matter
volume in the human brain. The data set features a brain-like
macro-structure of long-range connections, mimicking in vivo DWI
clinical-like acquisitions based on a simulated diffusion signal. An
additional anatomical image with T1-like contrast was simulated as
a reference. The
final data sets and all files necessary to perform the
simulation are openly available (see Data availability).
Twenty research groups with extensive expertise in diffusion
imaging from 12 countries (Fig.
2
a) participated in the
competi-tion and submitted a total of 96 tractograms (see Data availability)
generated using a large variety of tractography pipelines with
different pre-processing, local reconstruction, tractography, and
post-processing algorithms (Fig.
2
b, Supplementary Note
1
).
Performance metrics and evaluation. The Tractometer
con-nectivity metrics
38were used for a quantitative evaluation of the
submissions. Based on the known ground truth bundles, we
calculated true positives, corresponding to the valid connection
(VC) ratio, that is, the proportion of streamlines connecting valid
end points and the associated number of valid bundles (VB),
where a bundle is a group of streamlines. We also computed false
positives, corresponding to the invalid connection (IC) ratio and
the associated number of invalid bundles (IB), as well as
recon-structed volumes, based on the bundle volumetric overlap (OL)
and volumetric overreach (OR) in percent (see
“Methods” section
for details and Supplementary Figs.
1
,
2
for alternative metrics).
Tractograms contained most of the ground truth bundles. The
volumetric reconstruction of the existing bundles varied greatly
from tract to tract. Figure
3
a shows that identified VBs can be
arbitrarily grouped into three clusters of very hard, hard, and
medium difficulty, according to the percentage of OL. Figure
3
b
shows corresponding examples that were reconstructed by
dif-ferent tractography techniques. All submissions had difficulties
reconstructing the smallest tracts, that is, the anterior (CA) and
posterior commissures (CP) that have a cross-sectional diameter
of no more than 2 mm, or one or two voxels (very hard, 0%
<=
OL
< 10%). A family of hard bundles was partly recovered (10%
<= OL < 50%). Bundles of medium difficulty were the corpus
callosum (CC), inferior longitudinal fasciculus (ILF), superior
longitudinal fasciculus (SLF), and uncinate fasciculus (UF) with
an average of more than 50% volumetric recovery (50%
<= OL
<= 100%). A Pearson product-moment correlation coefficient
was computed to assess the relationship between OL and OR (r
=
0.88, p
< 10
–8), indicating a direct link between the probability of
reconstructing a greater portion of a tract (OL) and generating
artefactual trajectories (OR).
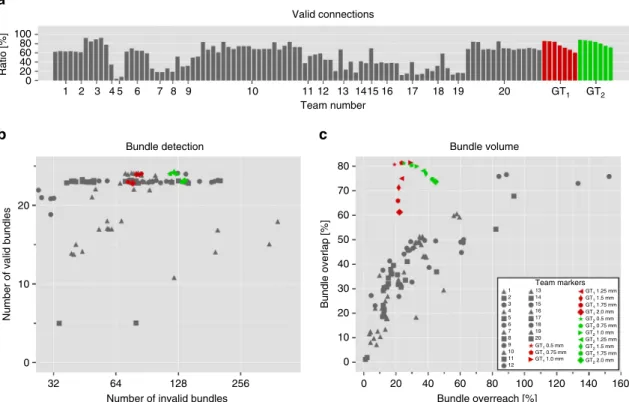
Figure
4
shows that on average 21 out of 25 VBs (median 23)
were identified by the participating teams with only four teams
submitting tractograms that contained an OL of more than 60%.
No submission contained all 25 VBs, but 10 submissions (10.4%)
recovered 24 VBs, and 69 submissions (71.9%) detected 23 or
more VBs (Fig.
5
a). However, tractography pipelines clearly need
to improve their recovery of the full spatial extent of bundles: the
mean value of bundle volume overlap (OL) across all submissions
was 36
± 16%, with an average overreach (OR) of 29 ± 26%
(Fig.
4
c). At the level of individual streamlines, an average of
54
± 23% connections were valid (Fig.
4
a).
Tractograms contained more invalid than valid bundles. Across
submissions, 36
± 17% of the reconstructed individual streamlines
connected regions that were not actually connected. The fraction of
streamlines not connecting any endpoints was 10
± 15%. Even
though not part of the ground truth, these streamlines often occur
in dense, structured, and coherent bundles. Submitted tractograms
Method A B C D E F G H I J K L Team number Pipeline configuration of teams
Lab location of teams
1 2 3 4 5 6 7 8 9 1 2 3 4 5 6 7 8 9 10 11 12 13 1415 16 17 18 19 20 20 Organisers 10 11 12 13 14 15 16 17 18 19
a
b
Fig. 2 Summary of teams and tractography pipeline setups. a Location of the teams’ affiliated labs. b Configuration of the different pipelines used for processing (A: motion correction, B: rotation of b-vectors, C: distortion correction, D: spike correction, E: denoising, F: upsampling, G: diffusion model beyond diffusion tensor imaging (DTI), H: tractography beyond deterministic, I: anatomical priors, J: streamlinefiltering, K: advanced streamline filtering, L: streamline clustering)
contained an average of 88
± 58 IBs, which is more than four times
the amount of VBs they contained on average (Fig.
4
b). This
demonstrates the inability of current state-of-the-art tractography
algorithms to control for false positives. Forty-one of these IBs
occurred in the majority of submissions (Fig.
5
, Supplementary
Fig.
3
). Overall average precision on the bundle level was 23
± 9%
(recall 85
± 15%, specificity 93 ± 5%). Submissions with at least 23
VBs showed no fewer than 37 IBs (mean 88
± 39, n = 69).
Sub-missions with 23 or more VBs and a volumetric bundle overlap of
>50% identified between 99 and 204 IBs.
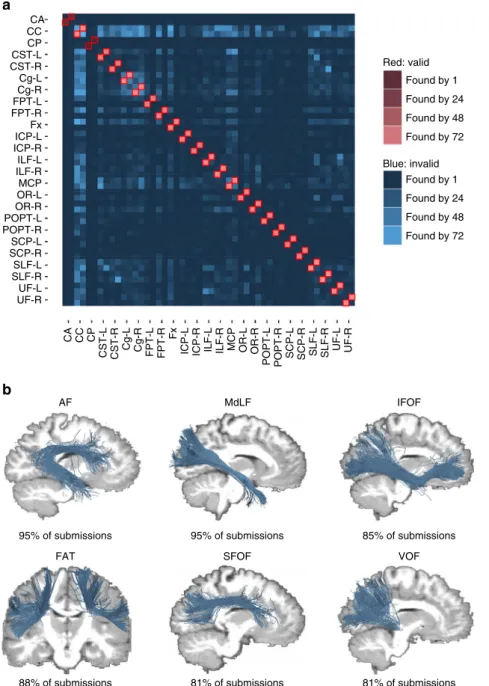
The bundles illustrated in Fig.
5
b were systematically found by
81–95% of submissions without being part of the ground truth.
Interestingly, several of these invalid streamline clusters exhibited
similarities in anatomical location to bundles known or
Ground truth DTI DET HARDI DET
Medium Difficulty ILF-L SLF-R SLF-L ILF-R UF-R CC UF-L ICP-L MCP FPT-R SCP-L ICP-R FPT-L Fx OR-R Found by N submissions Hard Very hard 75 50 25 0 10 20 30 40 50 60 Overreach [%] Ov er lap [%] HARDI PROBA 100/0% (OL/OR) 53/44% 85/185% 90/263% 100/0% 37/30% 52/67% 79/95% 100/0% 26/6% 48/53% 89/104% 100/0% 100/0% CA CST CST POPT SCP OR UF CA CP ILF SLF CP ICP FPT Hard Hard Medium Hard Ve ry hard 20/3% Not found 0/0% 15/21% 2/1% 42/24% 83/68% 50 40 30 20 10 0 POPT-L Cg-L Cg-R SCP-R POR T-R CST-L CST-R OR-L
a
b
Fig. 3 Tractography identifies most of the ground truth bundles, but not their full extent. a Overview of scores reached for different bundles in ground truth. Average overlap (OL) and average overreach (OR) scores for the submissions (red: very hard, green: hard, blue: medium, for abbreviations see Fig.1).b Representative bundles for DTI deterministic (DET) tracking come from submission 6/team 20, high angular resolution diffusion imaging (HARDI) deterministic tracking from submission 0/team 9, and HARDI probabilistic (PROBA) tracking from submission 2/team 12 (see Supplementary Note5for a discussion of these submissions). Thefirst column shows ground truth VBs for reference. The reported OL and OR scores correspond to the highest OL score reached within the respective class of algorithms
previously debated in tractography literature, such as the frontal
aslant tract (FAT)
42, the arcuate fasciculus (AF)
43, the inferior
frontal occipital fasciculus (IFOF)
44, the middle longitudinal
fasciculus (MdLF)
45, the extreme capsule fasciculus
46, the
super-ior fronto-occipital fasciculus (SFOF)
44, 47, and the vertical
occipital fasciculus (VOF)
48. These
findings suggest that evidence
for the existence of tracts should not be taken solely from
tractography at its current state but complemented by other
anatomical and electrophysiological methods.
Higher image quality may improve tractography validity. To
confirm that our findings revealed fundamental properties of
tractography itself and are not related to effects of our specific
phantom simulation process, we ran two independent
imple-mentations of deterministic streamline tractography
(Supple-mentary Note
2
) directly on the ground truth
field of fiber
orientations (Fig.
6
), that is, without using the diffusion-weighted
data at all. This experiment was repeated for multiple resolutions
(2, 1.75, 1.5, 1.25, 1.0, 0.75, and 0.5 mm). This setup was, thus,
independent of image quality, artifacts, and many other
influ-ences from specific pipeline configurations and the phantom
generation process. Based on the ground truth orientations, the
tractography pipelines achieved overlap scores (76
± 6%) that
were previously unreached at similar levels of overreach
(29
± 8%). VC ratios were between 71 and 82%. However, the
tractograms still contained 102
± 24 IBs (minimum 73).
Methodological innovation may improve tractography validity.
Our results show that the geometry of many junctions in the
simulated data set is too complex to be resolved by current
trac-tography algorithms, even when given a perfect ground truth
field
of orientations. Thus, the problems seem to relate to essential
ambiguities in the directional information (Fig.
7
). They persisted
in supplementary experiments performed to test the potential of
currently available anatomical constraints and global tractography
approaches (Supplementary Note
2
), in which none of the
addi-tionally ran methods surpassed the challenge submissions in
bundle detection performance (Supplementary Fig.
4
).
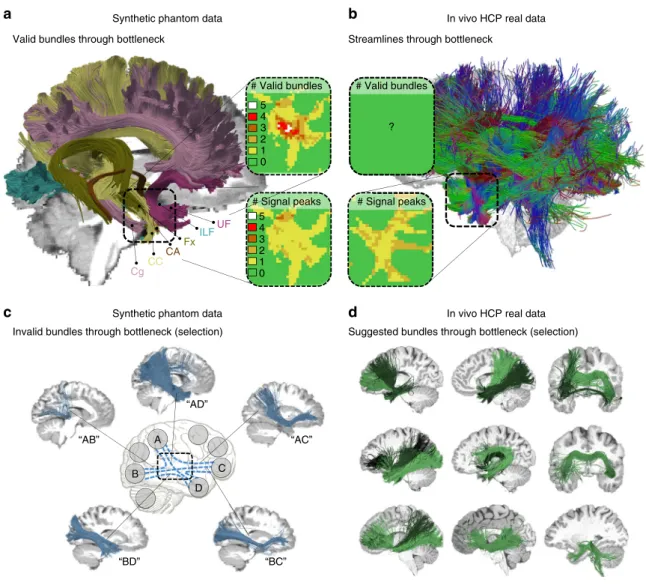
We further investigated the ambiguities tractography encounters
in the synthetic phantom as well as in an in vivo data set. In the
temporal lobe, for example, multiple bundles overlap and clearly
outnumber the count of
fiber orientations in most of the voxels. As
illustrated in Fig.
8
, single
fiber directions in the diffusion signal
regularly represent multiple bundles (see also Supplementary
Movie
1
). Such funnels embody hard bottlenecks for tractography,
leading to massive combinatorial possibilities of plausible
config-urations for connecting the associated bundle endpoints as sketched
in Figs.
7
c and
8
c. Consequently, for the real data set as well as the
synthetic phantom, dozens of structured and coherent bundles pass
through this bottleneck, exhibiting similar
fiber counts (cf.
Supplementary Figs.
5
,
6
) and a wide range of anatomically
reasonable geometries as illustrated in Supplementary Movie
2
. A
tractogram based on real HCP data exhibits a whole family of
theoretically plausible bundles going through the temporal lobe
bottleneck even though, locally, the diffusion signal often shows
only one
fiber direction (cf. Fig.
8
d). Methodological innovation will
be necessary to resolve these issues and better exploit additional
information sources that complement the local orientation
fields
estimated from DWI.
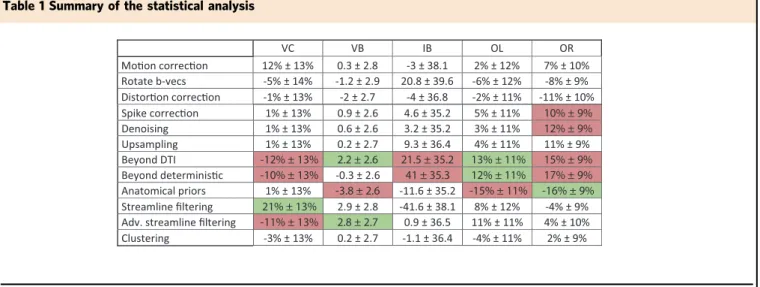
Statistical analysis of processing steps. Effects of the
methodo-logical setup of the different submissions on the results were
investigated in a multivariable linear mixed model and revealed the
influence of the individual processing steps on the tractography
outcome (Table
1
). The choice of tractography algorithm, as well as
the post-tracking
filtering strategy and the underlying diffusion
modeling had a strong effect on overall scores, revealing a clear
tradeoff between sensitivity and specificity (Supplementary Note
3
).
Manual editing of tractograms following anatomical priors had a
Team number 1 2 3 4 5 6 7 8 9 10 Valid connections 100 0 Ratio [%] 11 12 13 1415 16 17 18 19 20 Bundle detection
Number invalid bundles (IB)
Number valid bundles (VB)
32 64 128 256 20 10 0
a
b
Bundle overreach [%] Bundle volume Bundle overlap [%] 80 60 40 20 0 60 80 100 120 140 160 40 20 0c
Fig. 4 Between-group differences in tractography reconstructions of VBs and IBs. Overview of the scores reached by the different teams as a percentage of streamlines connecting valid regions,b number of detected VBs and IBs (data points are jittered to improve legibility), and c volume overlap (OL) and overreach (OR) scores averaged over bundles. Black arrows mark submissions used in the followingfigures (see Supplementary Note5for discussion)
negative impact on the number of VBs identified (mean effect: 3.8
± 2.6 bundles) and on the bundle overlap (mean effect: −15 ± 11%).
However, such techniques showed a positive impact on the average
bundle overreach (mean effect:
−16 ± 9%). Notably, Team 3
post-processed the tractograms using clustering, reaching 92% validly
connecting streamlines keeping only the larger clusters.
Discussion
We assessed current state-of-the-art
fiber tractography
approa-ches using a ground truth data set of white matter tracts and
connectivity that is representative of the challenges that may
occur in human in vivo brain imaging. Advanced tractography
strategies in combination with current diffusion modeling
techniques successfully recovered most VBs, covering up to 77%
of their volumetric extent. This result demonstrates the capability
of current methods and teams to adequately handle numerous
artifacts in DWI and overcome local crossing situations during
tract reconstruction. However, tractography also produced thick
and dense bundles of plausible looking streamlines in locations
where such streamlines did not actually exist. When focusing on
the 64 bundles that were systematically recovered by the majority
of submissions, 64% of them were in fact absent from the ground
truth. Current tractography pipelines, and even tracking of the
ground truth
fiber orientations on high-resolution images,
pro-duce substantial amounts of false-positive bundles. The employed
simulation-based approach cannot quantify the effects related to
in vivo connectivity in an absolute sense; that is, our results do
AF MdLF IFOF
FAT SFOF VOF
85% of submissions 81% of submissions 95% of submissions 81% of submissions 95% of submissions 88% of submissions CA CC CP CST-L CST-R Cg-L Cg-R FPT-L FPT-R Fx ICP-L ICP-R ILF-L ILF-R MCP OR-L OR-R POPT-L POPT-R SCP-L SCP-R SLF-L SLF-R UF-L UF-R CA CC CP CST-L CST-R Cg-L Cg-R FPT-L FPT-R Fx
ICP-L ICP-R ILF-L ILF-R MCP OR-L OR-R POPT-L POPT-R SCP-L SCP-R SLF-L SLF-R UF-L UF-R Found by 1 Found by 24 Found by 48 Found by 72 Found by 1 Found by 24 Found by 48 Found by 72 Red: valid Blue: invalid
a
b
Fig. 5 Overview of VBs and IBs and examples of invalid streamline clusters. a Each entry in the connectivity matrix indicates the number of submissions that have identified the respective bundle. The two rows and columns of each bundle represent the head-endpoint and tail-endpoint regions. The connectivity matrix indicates a high number of existing tracts that were identified by most submissions (red). It also indicates systematic artefactual reconstructions across teams (blue).b Examples of IBs that have been consistently identified by more than 80% of the submissions, but do not exist in the ground truth data set. The AF, for example, was generated from ILF and SLF crossing streamlines, whereas the IFOF was generated from by crossing ILF and UF streamlines. The MdLF, FAT, SFOF, and VOF were other examples of highly represented IBs
not mean that anyone who is doing tractography should expect
the reported VB-to-IB and coverage-to-overreach ratios.
How-ever, the presented
findings do expose the degree of ambiguity
associated with whole-brain tractography and show that the
computational problem of tractography goes far beyond the local
reconstruction of
fiber directions
1,7and issues of data quality.
Our
findings, therefore, present a core and open challenge for the
field of tractography and connectivity mapping in general.
Previous studies have reported high invalid-connection ratios
under simplified conditions
26,38(
www.tractometer.org
), and some
of the underlying ambiguities in tractography have been discussed
using schematic representations and theoretical arguments
1,7,8,37.
Regions of white matter bottlenecks have been discussed in the
past
35and have been highlighted as critical with respect to
tracto-graphic
findings
36. The current results reveal the consequences of
such limitations under more complex conditions as might be found
in human brain studies in vivo, addressing important questions that
previously remained speculative. The
findings were derived from a
brain-like geometry that encompasses some of the major known
long-range connections and covers 71% of the white matter. Future
versions of the phantom are planned to include additional bundles
such as the middle and inferior temporal projections of the AF, the
MdLF, and the IFOF, as well as smaller U-fibers, medial forebrain
fibers, deep nuclei, and connections between them. In addition,
more advanced diffusion modeling methods will allow generating
even more realistic DWI signals, potentially simulated at increased
spatial and q-space resolutions
49.
These developments, however, will not resolve the fundamental
ambiguities which tractography faces and thus will only have a
limited effect on the main
findings of our study. We showed that
false-positive bundles occur at similar rates even when using the
maximal angular precision of the signal, that is, using ground
truth orientations. These
findings confirm those shown in
pre-vious studies
5and relate to the fundamental problem formulation
in tractography: inferring connectivity from local orientation
fields. Increasing the anatomic complexity of the phantom by
adding more bundles most likely will even lead to further
increased false-positive rates. The construction process of the
current phantom resembles a potential limitation, since it
involves tractography itself and thus raises self-validation issues.
This aspect should be considered in direct method comparisons
as there may exist a possible bias toward algorithms that are
similar to the algorithm used for phantom generation. This
caveat, however, has only a very limited effect on our general
findings. It can be expected that the identified limitations of
tractography will become even more pronounced in phantoms of
higher anatomic complexity that might be achievable by involving
independent methods such as polarized light imaging
50. In
summary, our observations confirm the fundamental ill-posed
nature of the computational problem that current tractography
approaches strive to solve.
Accordingly, substantial methodological innovations will be
necessary to resolve the problem of IBs. Several directions of
current research might improve the specificity of tractography.
Streamline
filtering techniques can optimize the signal prediction
error in order to reduce tractography biases
14,16,51. They are part
of the more general trend to integrate non-local information, as
well as advanced diffusion microstructure modeling that goes
beyond the raw directional vectors
52–58. Recent advances in
machine-learning-driven tractography also show great potential
in improving the specificity of tractograms
59,60. Future versions
of our phantom will be generated with multiple b-values, better
signal-to-noise ratio (SNR), and fewer artifacts to further
encourage research in these directions.
In addition, tractography should increasingly employ reliable
anatomical priors from ex vivo histology, high-resolution
post-mortem DWI
61, or complementary electrophysiology for optimal
guidance. While manual or automated clean-up of streamlines
Team number 1 2 3 4 5 6 7 8 9 10 Valid connections 100 80 60 40 20 0 Ratio [%] 11 12 13 1415 16 17 18 19 20 GT1 GT2 Bundle detection
Number of invalid bundles
Number of valid bundles
32 64 128 256 20 10 0 Bundle overreach [%] Bundle volume Bundle overlap [%] 80 60 40 20 10 30 50 70 0 Team markers 60 80 100 120 140 160 40 20 0 1 13 14 15 16 GT1 1.25 mm GT1 1.5 mm GT1 1.75 mm GT1 2.0 mm GT2 0.5 mm GT2 0.75 mm GT2 1.0 mm GT2 1.25 mm GT2 1.5 mm GT2 1.75 mm GT2 2.0 mm 17 18 19 20 GT1 0.5 mm GT1 0.75 mm GT1 1.0 mm 2 3 4 5 6 7 8 9 10 11 12
a
b
c
Fig. 6 Tractography on ground truth directions with no noise still affected by IB problem. We applied deterministic tractography directly to the ground truth vectorfield with multiple resolutions (2, 1.75, 1.5, 1.25, 1.0, 0.75, and 0.5 mm). Two independent implementations of deterministic tractography methods were used to obtain the results (GT1and GT2, cf. Supplementary Note2).a Percentage of streamlines connecting valid regions. b Number of detected VBs
may help (as demonstrated by our results showing decreased
overreach at the expense of VB detection and volumetric
recon-struction), the real challenge is our limited knowledge of the
anatomy to be reconstructed. Currently, post-mortem dissection
with Klingler’s method reveals the macroscopic organization of
the human brain white matter
11, 62–64, although this method
shares some of the mentioned limitations of tractography in
complex
fiber configurations or near the cortex. In the future, the
community will have to gain further insights into the underlying
principles of white matter organization and increasingly learn
how to leverage such information for tractography
1,65,66.
Potential advances achieved in tractography will have an
important impact on graph-analytical studies of the structural
connectome
2, 67. The hitherto demonstrated diagnostic or
pre-dictive capability of such analyses (e.g., in psychiatric settings)
should not let us overlook which aspects of tractography are
reliable and which are not. One of the present
findings is
parti-cularly relevant for the
field of connectomics: the traditional
metrics that require streamlines to exactly end in head or tail
regions of a bundle are far too restrictive for bundle dissection
and connectivity assessment. None of the submissions generated
exact streamlines that perfectly overlap with ground truth bundles
and dilated endpoint masks. This
finding is in line with previous
reports, which found termination of tracts in the gray matter
(GM) to be inaccurate
5and highlights an important limitation of
approaches that use a voxel-wise definition of parcellations on the
T1 image for selecting relevant streamlines. Future versions of our
phantom will include ground-truth parcellations of the white
matter/GM cortical band to encourage further developments for
tackling these problems and extend the evaluation method to
apply to graph theory metrics.
Despite any limitations, DWI is currently the only tool to map
short and long-range structural brain connectivity in vivo and is
essential for comparing brains, detecting differences, and
simu-lating brain activity
39. Our
findings should foster the
develop-ment of novel tractography methods that are carefully evaluated
using the present approach. The most important goal for the next
generation of tractography algorithms is an improved ability to
reconstruct the full spatial extent of existing tracts while better
controlling for false-positive connections. A tighter integration of
anatomical priors, advanced diffusion microstructure modeling,
and multi-modality imaging should help to resolve ambiguities in
the signal and overcome current limitations of tractography
57,58.
Fundamentally, there is an urgent need for methodological
innovation in tractography in order to advance our knowledge of
human white matter anatomy and build anatomically correct
human connectomes
1,7.
Methods
Generation of ground truthfiber bundles. The set of ground truth long-range fiber bundles was designed to cover the whole human brain and features many of the relevant spatial configurations, such as crossing, kissing, twisting and fanning fibers, thus representing the morphology of the major known in vivo fiber bundles. The process to obtain these bundles consisted of three steps. First, a whole-brain global tractography was performed on a high-quality in vivo diffusion-weighted image. Then, 25 major long-range bundles were manually extracted from the resulting tractogram. In the third step, these bundles were refined to obtain smooth and well-defined bundles. Each of these steps is detailed in the following paragraphs.
We chose one of the diffusion-weighted data sets included in the Q3 data release of the HCP39, subject 100307, to perform whole-brain globalfiber
tractography52,68. Among other customizations, the HCP scanners are equipped with a set of high-end gradient coils, enabling diffusion encoding gradient strengths of 100 mT m−1. By comparison, most standard magnetic resonance scanners feature gradient strengths of about 30 to 40 mT m−1. This hardware setup allows the acquisition of data sets featuring exceptionally high resolutions (1.25 mm isotropic, 270 gradient directions) while maintaining an excellent SNR. All data sets were corrected for head motion, eddy currents and susceptibility distortions and are, in general, of very high quality69–73. Detailed information regarding the employed imaging protocols as well as the data sets themselves may be found on
http://humanconnectome.org.
Globalfiber tractography was performed using MITK Diffusion74with the following parameters: 900,000,000 iterations, a particle length of 1 mm, a particle width of 0.1 mm, and a particle weight of 0.002. Furthermore, we repeated the tractography six times and combined the resulting whole-brain tractograms into one large data set consisting of overfive million streamlines. The selected parameters provided for a very high sensitivity of the tractography method. The specificity of the resulting tractogram was of lesser concern since the tracts of interest were extracted manually in the second step.
Bundle segmentation was performed by an expert radiologist using manually placed inclusion and exclusion regions of interest (ROI). We followed the concepts introduced in ref.40for the ROI placement andfiber extraction. Twenty-five
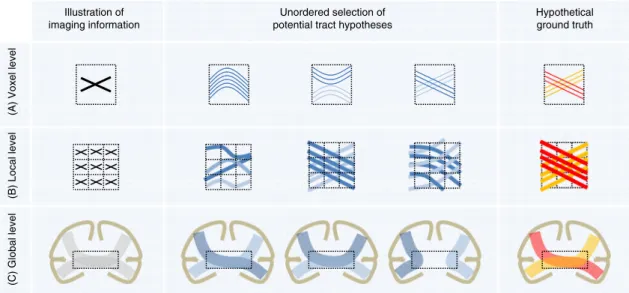
(A) Voxel level
(B) Local level (C) Global level Hypothetical ground truth Illustration of imaging information Unordered selection of potential tract hypotheses
Fig. 7 Ambiguous correspondences between diffusion directions andfiber geometry. The three illustrations at voxel, local, and global level are used as an example to illustrate the possible ambiguities contained in the diffusion imaging information that may lead to alternative tract reconstructions. (A) The intra-voxel crossing offibers in the hypothetical ground truth leads to ambiguous imaging information at voxel level7. (B) Similarly, the imaging representation of localfiber crossings can be explained by several other configurations7. (C) At a global level, white matter regions that are shared by
multiple bundles (so-called“bottlenecks”, dotted rectangles)35can lead to many spurious tractographic reconstructions36. With only two bundles in the hypothetical ground truth (red and yellow bundle), four potential false-positive bundles emerge. Please note that the hypothetical ground truth used in the global-level example is anatomically incorrect as most of the callosalfibers are homotopically distributed (i.e., connect similar regions on both hemispheres)
bundles were extracted, covering association, projection, and commissuralfibers across the whole brain (Fig.1): CC, left and right cingulum (Cg), Fornix (Fx), anterior commissure (CA), left and right optic radiation (OR), posterior commissure (CP), left and right inferior cerebellar peduncle (ICP), middle cerebellar peduncle (MCP), left and right superior cerebellar peduncle (SCP), left and right parieto-occipital pontine tract (POPT), left and right cortico-spinal tract (CST), left and right frontopontine tracts (FPT), left and right ILF, left and right UF, and left and right SLF. As mentioned in the“Discussion” section, the IFOF, the MdLF, as well as the middle and inferior temporal projections of the AF were not included. After manual extraction, the individual long-range bundles were further refined to serve as ground truth for the image simulation as also shown in Fig.1. The original extracted tracts featured a large number of prematurely endingfibers and the individual streamlines were not smooth. To obtain smooth tracts without prematurely endingfibers, we simulated a diffusion-weighted image from each original tract individually using Fiberfox (www.mitk.org33). Since no complexfiber configurations, such as crossings, were present in the individual tract images and no artifacts were simulated, it was possible to obtain very smooth and complete tracts from these images with a simple tensor-based streamline tractography.
Supplementary Fig.7illustrates the result of this refining procedure on the left CST.
Simulation of phantom images with brain-like geometry. The phantom diffusion-weighted images (Supplementary Movie3) were simulated using Fiberfox
(www.mitk.org33), which is available as open-source software. We employed a
four-compartment model of brain tissue (intra and inter-axonal), GM, and cere-brospinalfluid (CSF)33. The parameters for simulation of the four-compartment diffusion-weighted signal were chosen to obtain representative diffusion properties and image contrasts (compare75for details on the models). The intra-axonal
compartment was simulated using the stick model with a T2 relaxation time of 110 ms and a diffusivity of 1.2 × 10⁻⁹m2s−1. The inter-axonal compartment was
simulated using the zeppelin model with a T2 relaxation time of 110 ms, an axial diffusivity of 1.2 × 10⁻⁹m2s−1and a radial diffusivity of 0.3 × 10⁻⁹m2s−1. The GM compartment was simulated using the ball model with a T2 relaxation time of 80 ms and a diffusivity of 1.0 × 10⁻⁹m2s−1. The CSF compartment was also simulated
using the ball model with a T2 relaxation time of 2500 ms and a diffusivity of 2.0 × 10⁻⁹m2s−1.
Using Fiberfox, one set of diffusion-weighted images and one T1-weighted image were simulated. Thefinal data sets as well as all files needed to perform the simulation are available online (see Data availability).
The acquisition parameters that we report below were chosen to simulate images that are representative for a practical (e.g., clinical) setting, specifically a 5–10-min single shot echo-planar imaging scan with 2 mm isotropic voxels, 32 gradient directions, and a b-value of 1000 s mm−2. The chosen acquisition setup represents a typical scenario for an applied tractography study and embodies a common denominator supported by the large majority of methods. Since acquisitions with higher b-values, more gradient directions and fewer artifacts are Synthetic phantom data
# Signal peaks
C D B
A
Invalid bundles through bottleneck (selection) Valid bundles through bottleneck
Suggested bundles through bottleneck (selection) Streamlines through bottleneck
CC Cg FxILF CA UF “AB” “AD” “AC” “BC” “BD” # Signal peaks # Valid bundles 5 4 3 2 1 0 5 4 3 2 1 0 ? # Valid bundles
In vivoHCP real data
Synthetic phantom data In vivoHCP real data
a
b
c
d
Fig. 8 Bottlenecks and the fundamental ill-posed nature of tractography. a Visualization of six ground truth bundles converging into a nearly parallel funnel in the bottleneck region of the left temporal lobe (indicated by square region). The bundles per voxel (box“# Valid bundles”) clearly outnumber the peak directions in the diffusion signal (box“# Signal peaks”). b Visualization of streamlines from a HCP in vivo tractogram passing through the same region. c Exemplary IBs that have been identified by more than 50% of the submissions, showing that tractography cannot differentiate between the high amount of plausible combinatorial possibilities connecting different endpoint regions (see Supplementary Movie1).d Automatically QuickBundle-clustered streamlines from the in vivo tractogram going through the temporal ROI. The clustered bundles are illustrated in different shades of green. These clusters represent a mixture of true-positive and false-positive bundles going through that bottleneck area of the HCP data set (see Supplementary Movie2)
beneficial for tractography, we additionally report a least upper bound tractography performance under perfect image quality conditions using a data set that directly contains ground truthfiber orientation information at high spatial resolution with no artifacts (Fig.6and Supplementary Note2).
The parameters are a matrix size of 90 × 108 × 90, echo time (TE) 108 ms, dwell time 1 ms; T2′ relaxation time 50 ms. The simulation corresponded to a single-coil acquisition with constant coil sensitivity, no partial Fourier and no parallel imaging. Phase encoding was posterior-anterior. Two unweighted images with posterior-anterior/anterior-posterior phase encoding were also generated.
Since Fiberfox simulates the actual k-space acquisition, it was possible to introduce a number of common artifacts into thefinal image. Complex Gaussian noise was simulated yielding afinal SNR relative to the mean white matter baseline signal of about 20. Ten spikes were distributed randomly throughout the image volumes (Fig.9a). N/2 ghosts were simulated (Fig.9b). Distortions caused by B0
field inhomogeneities are introduced using an existing field map measured in a real acquisition and registered to the employed reference HCP data set (Fig.9c). Head motion was introduced as random rotation (±4° around z-axis) and translation (±2 mm along x-axis) in three randomly chosen volumes. Volume 6 was rotated by 3.36° and translated by−1.74 mm, volume 12 was rotated by 1.23° and translated by−0.72 mm, and volume 24 was rotated by −3.12° and translated by −1.55 mm. The image with the T1-like contrast was generated at an isotropic resolution of 1 mm, an SNR of about 40 and no further artifacts as an anatomical reference. Performance metrics and evaluation. The groups submitted sets of streamlines (see Data availability) and a brief description of their methods which is available in Supplementary Note1. Potential operator-dependent errors were not taken into account but these are likely to have contributed to the quality of thefinal results. Probabilistic tractography techniques were preprocessed with a user-defined uncertainty threshold that each group decided independently before submission.
The Tractometer definition of a VC is extremely restrictive for current tractography algorithms, as it requires streamlines (1) not to exit the area of the ground truth bundle at any point and (2) to terminate exactly within the endpoint region that is defined by the dilated ground truth fiber endpoints (Supplementary Figs.8,9)38. Hence, we adopted an alternative definition with less stringent criteria
based on robust shape distance measures76and clustering between streamlines77, as
detailed in Supplementary Note4. The bundle-specific thresholds were manually
configured to account for bundle shape and proximity to other bundles. The following distances were used, with identical distances on both sides for lateralized bundles: 2 mm for CA and CP; 3 mm for CST and SCP; 5 mm for Cingulum; 6 mm for Fornix, ICP, OR, and UF; 7 mm for FPT, ILF, and POPT; 10 mm for CC, MCP, and SLF. The full script used to run this bundle recognition implementation was based on the DIPY library78(www.dipy.org) and is available online
(Supplementary Software1).
Once VCs are identified, the remaining streamlines can be classified into ICs and non-connecting streamlines. The details of this procedure are described in Supplementary Note4. We clustered the remaining invalid streamlines using a QuickBundles-based clustering algorithm77. The best matching endpoint regions for each resulting cluster were identified by majority voting of the contained streamlines. If multiple clusters were assigned to the same pair of regions, they were merged. Streamlines that were not assigned to any cluster or that fell below a length threshold were labeled as non-connecting.
On the basis of this classification of streamlines, the following metrics were calculated:
1. VC ratio: Number of VCs/total number of streamlines (percentage between 0 and 100).
2. VB: For each bundle that has at least one valid streamline associated with it, this counter is incremented by one (integer number between 0 and 25). 3. IB: With 25 bundles in the ground truth, each having two endpoint regions,
there are 1275 possible combinations of endpoint regions. Taking the 25 VBs out of the equation, 1250 potential IBs remain (integer number between 0 and 1250).
4. Overlap: Proportion of the voxels within the volume of a ground truth bundle that is traversed by at least one valid streamline associated with the bundle. This value shows how well the tractography result recovers the original volume of the bundle (percentage between 0 and 100).
5. Overreach: Fraction of voxels outside the volume of a ground truth bundle that is traversed by at least one valid streamline associated with the bundle
a
b
c
Fig. 9 Illustration of artifacts included in the synthetic data set. Exemplary illustration of the spike (a), N/2 ghost (b), and distortion artifacts (c) contained in thefinal diffusion-weighted data set. Supplementary Movie3gives an impression of the complete synthetic data set provided
Table 1 Summary of the statistical analysis
Green cells indicate a significant positive influence (p < 0.05) and red cells indicate a significant negative impact (p < 0.05). Numbers indicate the estimated mean effect on the metric and its standard deviation. Thefirst column of the table represents the different parts of the processing pipeline that we have grouped into categories. The other columns represent the metrics: VC valid connections, VB valid bundles, IB invalid bundles, OL overlap, OR overreach
over the total number of voxels within the ground truth bundle. This value shows how much the VCs extend beyond the ground truth bundle volume (percentage between 0 and 100). This value is always zero for the traditional definition of a VC, but can be non-zero for the non-stringent criteria we adopted in our study.
Following previously defined criteria of evaluation79, our study is mainly about
accuracy with respect to the reference, rather than reproducibility or robustness of tractography.
Statistical multi-variable analysis. Effects of the experimental settings were investigated in a multivariable linear mixed model. The experimental variables describing the methods used for the different submissions were included asfixed effects (Fig.2b). The VC ratio, the VB count, the IB count, the bundle overlap percentage, and the bundle overreach percentage were modeled as dependent variables, each of which is used for the calculation of a separate model. The submitting group was modeled as a random effect. The software SAS 9.2, Proc Mixed, SAS Institute Inc., Cary, NC, USA, was used for the analysis.
Data availability. The authors declare that the data supporting thefindings of this study are available within the paper and itsSupplementary Informationfiles. The ISMRM 2015 Tractography Challenge data sets and the submitted tractograms are available under doi.org/10.5281/zenodo.572345 and doi.org/10.5281/
zenodo.840086, respectively.
Received: 21 November 2016 Accepted: 1 September 2017
References
1. Jbabdi, S., Sotiropoulos, S. N., Haber, S. N., Van Essen, D. C. & Behrens, T. E. Measuring macroscopic brain connections in vivo. Nat. Neurosci. 18, 1546–1555 (2015).
2. Bullmore, E. & Sporns, O. Complex brain networks: graph theoretical analysis of structural and functional systems. Nat. Rev. Neurosci. 10, 186–198 (2009). 3. Deco, G. & Kringelbach, M. L. Great expectations: using whole-brain
computational connectomics for understanding neuropsychiatric disorders. Neuron 84, 892–905 (2014).
4. Craddock, R. C. et al. Imaging human connectomes at the macroscale. Nat. Methods 10, 524–539 (2013).
5. Thomas, C. et al. Anatomical accuracy of brain connections derived from diffusion MRI tractography is inherently limited. Proc. Natl Acad. Sci. USA 111, 16574–16579 (2014).
6. Reveley, C. et al. Superficial white matter fiber systems impede detection of long-range cortical connections in diffusion MR tractography. Proc. Natl. Acad. Sci. USA 112, E2820–E2828 (2015).
7. Jbabdi, S. & Johansen-Berg, H. Tractography: where do we go from here? Brain Connect. 1, 169–183 (2011).
8. Jones, D. K. Challenges and limitations of quantifying brain connectivity in vivo with diffusion MRI. Imaging Med. 2, 341–355 (2010).
9. Pujol, S. et al. The DTI challenge: toward standardized evaluation of diffusion tensor imaging tractography for neurosurgery. J. Neuroimaging 25, 875–882 (2015).
10. Feigl, G. C. et al. Magnetic resonance imaging diffusion tensor tractography: evaluation of anatomic accuracy of differentfiber tracking software packages. World Neurosurg. 81, 144–150 (2014).
11. Martino, J. et al. Cortex-sparingfiber dissection: an improved method for the study of white matter anatomy in the human brain. J. Anat. 219, 531–541 (2011).
12. Wang, X. et al. Subcomponents and connectivity of the superior longitudinal fasciculus in the human brain. Brain Struct. Funct. 221, 2075–2092 (2015). 13. Wakana, S. et al. Reproducibility of quantitative tractography methods applied
to cerebral white matter. Neuroimage 36, 630–644 (2007).
14. Pestilli, F., Yeatman, J. D., Rokem, A., Kay, K. N. & Wandell, B. A. Evaluation and statistical inference for human connectomes. Nat. Methods 11, 1058–1063 (2014).
15. Neher, P. F., Descoteaux, M., Houde, J.-C., Stieltjes, B. & Maier-Hein, K. H. Strengths and weaknesses of state of the artfiber tractography pipelines—a comprehensive in-vivo and phantom evaluation study using Tractometer. Med. Image Anal. 26, 287–305 (2015).
16. Daducci, A., Dal Palù, A., Lemkaddem, A. & Thiran, J.-P. COMMIT: convex optimization modeling for microstructure informed tractography. IEEE Trans. Med. Imaging 34, 246–257 (2015).
17. Dyrby, T. B. et al. Validation of in vitro probabilistic tractography. Neuroimage 37, 1267–1277 (2007).
18. Campbell, J. S., Siddiqi, K., Rymar, V. V., Sadikot, A. F. & Pike, G. B. Flow-basedfiber tracking with diffusion tensor and q-ball data: validation and comparison to principal diffusion direction techniques. Neuroimage 27, 725–736 (2005).
19. Dauguet, J. et al. Comparison offiber tracts derived from in-vivo DTI tractography with 3D histological neural tract tracer reconstruction on a macaque brain. Neuroimage 37, 530–538 (2007).
20. Schmahmann, J. D. et al. Associationfibre pathways of the brain: parallel observations from diffusion spectrum imaging and autoradiography. Brain 130, 630–653 (2007).
21. Seehaus, A. K. et al. Histological validation of DW-MRI tractography in human postmortem tissue. Cereb. Cortex 23, 442–450 (2013).
22. Knösche, T. R., Anwander, A., Liptrot, M. & Dyrby, T. B. Validation of tractography: comparison with manganese tracing. Hum. Brain Mapp. 36, 4116–4134 (2015).
23. Donahue, C. J. et al. Using diffusion tractography to predict cortical connection strength and distance: a quantitative comparison with tracers in the monkey. J. Neurosci. 36, 6758–6770 (2016).
24. Bach, M., Maier-Hein (ne Fritzsche), K. H., Stieltjes, B. & Laun, F. B. Investigation of resolution effects using a specialized diffusion tensor phantom. Magn. Reson. Med. 71, 1108–1116 (2013).
25. Fieremans, E. et al. The design of anisotropic diffusion phantoms for the validation of diffusion weighted magnetic resonance imaging. Phys. Med. Biol. 53, 5405–5421 (2008).
26. Fillard, P. et al. Quantitative evaluation of 10 tractography algorithms on a realistic diffusion MR phantom. Neuroimage 56, 220–234 (2011). 27. Maier-Hein (ne Fritzsche), K. H., Laun, F. B., Meinzer, H.-P. & Stieltjes, B.
Opportunities and pitfalls in the quantification of fiber integrity: what can we gain from Q-ball imaging? Neuroimage 51, 242–251 (2010).
28. Moussavi-Biugui, A., Stieltjes, B., Fritzsche, K., Semmler, W. & Laun, F. B. Novel spherical phantoms for Q-ball imaging under in vivo conditions. Magn. Reson. Med. 65, 190–194 (2011).
29. Poupon, C. et al. New diffusion phantoms dedicated to the study and validation of high-angular-resolution diffusion imaging (HARDI) models. Magn. Reson. Med. 60, 1276–1283 (2008).
30. Pullens, P., Roebroeck, A. & Goebel, R. Ground truth hardware phantoms for validation of diffusion-weighted MRI applications. J. Magn. Reson. Imaging 32, 482–488 (2010).
31. Close, T. G. et al. A software tool to generate simulated white matter structures for the assessment offibre-tracking algorithms. Neuroimage 47, 1288–1300 (2009). 32. Leemans, A., Sijbers, J., Verhoye, M., Van der Linden, A. & Van Dyck, D.
Mathematical framework for simulating diffusion tensor MR neuralfiber bundles. Magn. Reson. Med. 53, 944–953 (2005).
33. Neher, P. F., Laun, F. B., Stieltjes, B. & Maier-Hein, K. H. Fiberfox: facilitating the creation of realistic white matter software phantoms. Magn. Reson. Med. 72, 1460–1470 (2014).
34. Perrone, D. et al. D-BRAIN: anatomically accurate simulated diffusion MRI brain data. PLoS ONE 11, e0149778 (2016).
35. Mangin, J.-F., Regis, J. & Frouin, V. Shape bottlenecks and conservativeflow systems. In Proceedings of the 1996 Workshop on Mathematical Methods in Biomedical Image Analysis 131-138 (IEEE Computer Society, 1996). 36. Guevara, P. et al. Robust clustering of massive tractography datasets.
Neuroimage 54, 1975–1993 (2011).
37. Basser, P. J. Fiber-tractography via diffusion tensor MRI. in Proc. International Society for Magnetic Resonance in Medicine 1226 (1998).
38. Cote, M. A. et al. Tractometer: towards validation of tractography pipelines. Med. Image Anal. 17, 844–857 (2013).
39. Glasser, M. F. et al. The Human Connectome Project’s neuroimaging approach. Nat. Neurosci. 19, 1175–1187 (2016).
40. Stieltjes, B., Brunner, R. M., Maier-Hein (ne Fritzsche), K. H. & Laun, F. B. Diffusion Tensor Imaging: Introduction and Atlas. (Springer, Berlin Heidelberg, 2013). 41. Catani, M. & Schotten, M. T. de. Atlas of Human Brain Connections. (OUP,
Oxford, 2012).
42. Catani, M. et al. A novel frontal pathway underlies verbalfluency in primary progressive aphasia. Brain J. Neurol. 136, 2619–2628 (2013).
43. de Schotten, M. T. et al. A lateralized brain network for visuospatial attention. Nat. Neurosci. 14, 1245–1246 (2011).
44. Forkel, S. J. et al. The anatomy of fronto-occipital connections from early blunt dissections to contemporary tractography. Cortex 56, 73–84 (2014). 45. Makris, N. et al. Human middle longitudinal fascicle: variations in patterns of
anatomical connections. Brain Struct. Funct. 218, 951–968 (2013).
46. Mars, R. B. et al. The extreme capsulefiber complex in humans and macaque monkeys: a comparative diffusion MRI tractography study. Brain Struct. Funct. 221, 4059–4071 (2015).
47. Meola, A., Comert, A., Yeh, F.-C., Stefaneanu, L. & Fernandez-Miranda, J. C. The controversial existence of the human superior fronto-occipital fasciculus: connectome-based tractographic study with microdissection validation. Hum. Brain Mapp. 36, 4964–4971 (2015).
48. Yeatman, J. D. et al. The vertical occipital fasciculus: a century of controversy resolved by in vivo measurements. Proc. Natl Acad. Sci. USA 111, E5214–E5223 (2014).
49. Maier-Hein, K. H. et al. Tractography challenge ISMRM 2015 high-resolution data. Zenodohttps://doi.org/10.5281/zenodo.579933(2017).
50. Larsen, L., Griffin, L. D., Graessel, D., Witte, O. W. & Axer, H. Polarized light imaging of white matter architecture. Microsc. Res. Tech. 70, 851–863 (2007). 51. Smith, R. E., Tournier, J.-D., Calamante, F. & Connelly, A. The effects of SIFT on the reproducibility and biological accuracy of the structural connectome. Neuroimage 104, 253–265 (2015).
52. Neher, P. F. et al. MITK global tractography. In SPIE Medical Imaging: Image Processing (Eds. Haynor, D. R. & Ourselin, S.) 83144D (SPIE, 2012). 53. Mangin, J.-F. et al. Toward global tractography. Neuroimage 80, 290–296
(2013).
54. Jbabdi, S., Woolrich, M. W., Andersson, J. L. R. & Behrens, T. E. J. A Bayesian framework for global tractography. Neuroimage 37, 116–129 (2007). 55. Christiaens, D. et al. Global tractography of multi-shell diffusion-weighted
imaging data using a multi-tissue model. Neuroimage 123, 89–101 (2015). 56. Reisert, M., Kiselev, V. G., Dihtal, B., Kellner, E. & Novikov, D. S. MesoFT:
unifying diffusion modelling andfiber tracking. Med. Image Comput. Comput. Assist. Interv. 17, 201–208 (2014).
57. Girard, G., Fick, R., Descoteaux, M., Deriche, R. & Wassermann, D. AxTract: microstructure-driven tractography based on the ensemble average propagator. Inf. Process. Med. Imaging Proc. Conf. 24, 675–686 (2015).
58. Daducci, A., Dal Palú, A., Descoteaux, M. & Thiran, J.-P. Microstructure informed Tractography: pitfalls and open challenges. Front. Neurosci. 10, 247 (2016).
59. Neher, P. F., Götz, M., Norajitra, T., Weber, C. & Maier-Hein, K. H. A machine learning based approach tofiber tractography using classifier voting. in International Conference on Medical Image Computing and Computer-Assisted Intervention (Eds. Navab, N., Hornegger, J., Wells, W. & Frangi, A.) 45–52 (Springer, 2015).
60. Neher, P. F., Côté, M.-A., Houde, J.-C., Descoteaux, M. & Maier-Hein, K. H. Fiber tractography using machine learning. Neuroimage 158, 417–429 (2017). 61. Dell’Acqua, F., Bodi, I., Slater, D., Catani, M. & Modo, M. MR diffusion
histology and micro-tractography reveal mesoscale features of the human cerebellum. Cerebellum 12, 923–931 (2013).
62. Zemmoura, I. et al. FIBRASCAN: a novel method for 3D white matter tract reconstruction in MR space from cadaveric dissection. Neuroimage 103, 106–118 (2014).
63. De Benedictis, A. et al. New insights in the homotopic and heterotopic connectivity of the frontal portion of the human corpus callosum revealed by microdissection and diffusion tractography. Hum. Brain Mapp. 37, 4718–4735 (2016). 64. Hau, J. et al. Revisiting the human uncinate fasciculus, its subcomponents and
asymmetries with stem-based tractography and microdissection validation. Brain Struct. Funct. 222, 1645–1662 (2016).
65. Wedeen, V. J. et al. The geometric structure of the brainfiber pathways. Science 335, 1628–1634 (2012).
66. Galinsky, V. L. & Frank, L. R. The lamellar structure of the brainfiber pathways. Neural Comput. 28, 2533–2556 (2016).
67. Sporns, O. Contributions and challenges for network models in cognitive neuroscience. Nat. Neurosci. 17, 652–660 (2014).
68. Reisert, M. et al. Globalfiber reconstruction becomes practical. Neuroimage 54, 955–962 (2011).
69. Andersson, J. et al. A comprehensive Gaussian process framework for correcting distortions and movements in diffusion images. in Proceedings of International Society of Magnetic Resonance in Medicine 2426 (2012). 70. Andersson, J. L. R., Skare, S. & Ashburner, J. How to correct susceptibility
distortions in spin-echo echo-planar images: application to diffusion tensor imaging. Neuroimage 20, 870–888 (2003).
71. Fischl, B. FreeSurfer. Neuroimage 62, 774–781 (2012).
72. Jenkinson, M., Beckmann, C. F., Behrens, T. E. J., Woolrich, M. W. & Smith, S. M. FSL. Neuroimage 62, 782–790 (2012).
73. Jenkinson, M., Bannister, P., Brady, M. & Smith, S. Improved optimization for the robust and accurate linear registration and motion correction of brain images. Neuroimage 17, 825–841 (2002).
74. Maier-Hein (ne Fritzsche), K. H. et al. MITK diffusion imaging. Methods Inf. Med. 51, 441–448 (2012).
75. Panagiotaki, E. et al. Compartment models of the diffusion MR signal in brain white matter: a taxonomy and comparison. Neuroimage 59, 2241–2254 (2012). 76. Garyfallidis, E., Ocegueda, O., Wassermann, D. & Descoteaux, M. Robust and efficient linear registration of white-matter fascicles in the space of streamlines. Neuroimage 117, 124–140 (2015).
77. Garyfallidis, E., Brett, M., Correia, M. M., Williams, G. B. & Nimmo-Smith, I. QuickBundles, a method for tractography simplification. Front. Neurosci. 6, 175 (2012).
78. Garyfallidis, E. et al. Dipy, a library for the analysis of diffusion MRI data. Front. Neuroinform. 8, 8 (2014).
79. Jannin, P. et al. Validation of medical image processing in image-guided therapy. IEEE Trans. Med. Imaging 21, 1445–1449 (2002).
Acknowledgements
K.H.M.-H. was supported by the German Research Foundation (DFG), grants MA 6340/10-1, MA 6340/12-1. M.D. was supported by the NSERC Discovery Grant program as well as the institutional Université de Sherbrooke Research Chair in Neuroinformatics. C.M.W.T. was supported by a grant (No. 612.001.104) from the Physical Sciences division of the Netherlands Organization for Scientific Research (NWO). The research of H.Y.M., S.D., S.S., A.M.H., and A.L. was supported by VIDI grant 639.072.411 from NWO. The research of F.G. was funded by the Chinese Scholarship Council (CSC). M.Ch. was supported by the Alexander Graham Bell Canada Graduate Scholarships-Doctoral Program (CGS-D3) from the Natural Sciences and Engineering Research Council of Canada (NSERC). M.C. was supported by the Investigator Award No. 103759/ Z/14/Z from the Wellcome Trust. C.C.H. was supported by DFG SFB grants 936/A1, Z3 and TRR 169/A2. The research of J.-P.T., D.R., M.B., A.A., A.L., and A.D. was supported by the Center for Biomedical Imaging (CIBM) of the Geneva-Lausanne Universities and the EPFL, as well as the foundations Leenaards and Louis-Jeantet, and by the Swiss National Science Foundation grants 205321_144529 and 31003A_157063. W.E.R. was supported by CA90246 from National Cancer Institute. The research of Y.F., C.G., Y.W., J.M., H.R., Q.L., and C.-F.W. was supported by grant 61379020 from National Nature Science Foundation of China. C.-F.W. was supported by NIH grants P41EB015902 and P41EB015898.
Author contributions
K.H.M.-H., M.D., and J.-C.H. performed the data analysis and wrote the paper with input from all authors. P.F.N. and B.S. designed the phantom. P.F.N. and J.-C.H. sup-ported the data analysis and J.-C.H. handled the Tractometer scoring and evaluation metrics proposed. M.-A.C. and E.G. developed the clustering and bundle recognition algorithm for the relaxed scoring system. K.H.M.-H., P.F.N., J.-C.H., E.C., A.D., T.D., B.S., and M.D. coordinated the tractography challenge at the International Society for Magnetic Resonance in Medicine (ISMRM) 2015 Diffusion Study Group meeting. T.H.-L. set up the multivariable statistical model. P.F.N. wrote parts of the Online Methods. L.P. and C.C.H. were mentors in the discussion of the paper and neuroana-tomical, as well as neuroscientific context. Submissions were made by the following teams: J.Z. team 1; M.Ch. and C.M.W.T. team 2; F.-C.Y. team 3; Y.-C.L. team 4; Q.J. team 5; D.Q.C. team 6; Y.F., C.G., Y.W., J.M., H.R., Q.L., and C.-F.W. team 7; S.D.-G., J.O.O. G., M.P., S.S.-J., and G.G. team 8; S.S.-J., F.R., and J.S. team 9; C.M.W.T., F.G., H.Y.M., S. D., M.F., A.M.H., and A.L. team 10; S.S.-J., G.G., and F.R. team 11; J.O.O.G., M.P., G.G., and F.R. team 12; A.B., B.P., C.B., M.D., S.B., and J.D. team 13; A.S., R.V., A.C., A.Q., and J.Y. team 14; A.R.K., W.H., and S.A. team 15; D.R., M.B., A.A., O.E., A.L., and J.-P.T. team 16; D.R., M.B., A.A., O.E., A.L., and J.-P.T. team 17; H.E.C., B.L.O., B.M., and M.S. N. team 18; F.P., G.P., J.E.V.-R., J.G., and P.M.T. team 19; F.D.S.R., P.L.L., L.M.L., R.B., and F.D.’A. team 20.
Additional information
Supplementary Informationaccompanies this paper at doi:10.1038/s41467-017-01285-x. Competing interests:The authors declare no competingfinancial interests.
Reprints and permissioninformation is available online athttp://npg.nature.com/ reprintsandpermissions/
Publisher's note:Springer Nature remains neutral with regard to jurisdictional claims in published maps and institutional affiliations.
Open Access This article is licensed under a Creative Commons Attribution 4.0 International License, which permits use, sharing, adaptation, distribution and reproduction in any medium or format, as long as you give appropriate credit to the original author(s) and the source, provide a link to the Creative Commons license, and indicate if changes were made. The images or other third party material in this article are included in the article’s Creative Commons license, unless indicated otherwise in a credit line to the material. If material is not included in the article’s Creative Commons license and your intended use is not permitted by statutory regulation or exceeds the permitted use, you will need to obtain permission directly from the copyright holder. To view a copy of this license, visithttp://creativecommons.org/ licenses/by/4.0/.