HAL Id: hal-00316834
https://hal.archives-ouvertes.fr/hal-00316834
Submitted on 1 Jan 2000
HAL is a multi-disciplinary open access
archive for the deposit and dissemination of sci-entific research documents, whether they are pub-lished or not. The documents may come from teaching and research institutions in France or abroad, or from public or private research centers.
L’archive ouverte pluridisciplinaire HAL, est destinée au dépôt et à la diffusion de documents scientifiques de niveau recherche, publiés ou non, émanant des établissements d’enseignement et de recherche français ou étrangers, des laboratoires publics ou privés.
Delhi
J. K. Gupta, L. Singh
To cite this version:
J. K. Gupta, L. Singh. Long term ionospheric electron content variations over Delhi. Annales Geo-physicae, European Geosciences Union, 2000, 18 (12), pp.1635-1644. �hal-00316834�
Long term ionospheric electron content variations over Delhi
J. K. Gupta and Lakha Singh
Radio and Atmospheric Sciences Division, National Physical Laboratory, Dr K S Krishnan Marg, New Delhi-110012, India Received: 10 May 2000 / Revised: 5 September 2000 / Accepted: 25 September 2000
Abstract. Ionospheric electron content (IEC) observed at Delhi (geographic co-ordinates: 28.63°N, 77.22°E; geomagnetic co-ordinates: 19.08°N, 148.91°E; dip Lat-itude 24.8°N), India, for the period 1975±80and 1986± 89 belonging to an ascending phase of solar activity during ®rst halves of solar cycles 21 and 22 respectively have been used to study the diurnal, seasonal, solar and magnetic activity variations. The diurnal variation of seasonal mean of IEC on quiet days shows a secondary peak comparable to the daytime peak in equinox and winter in high solar activity. IECmax(daytime maximum
value of IEC, one per day) shows winter anomaly only during high solar activity at Delhi. Further, IECmax
shows positive correlation with F10.7 up to about 200
¯ux units at equinox and 240units both in winter and summer; for greater F10.7values, IECmaxis substantially
constant in all the seasons. IECmaxand magnetic activity
(Ap) are found to be positively correlated in summer in
high solar activity. Winter IECmax shows positive
correlation with Ap in low solar activity and negative
correlation in high solar activity in both the solar cycles. In equinox IECmax is independent of Ap in both solar
cycles in low solar activity. A study of day-to-day variations in IECmaxshows single day and alternate day
abnormalities, semi-annual and annual variations con-trolled by the equatorial electrojet strength, and 27-day periodicity attributable to the solar rotation.
Key words: Ionosphere (equatorial ionosphere) ± Magnetospheric physics (magnetosphere ± ionosphere interactions) ± Radio science (ionospheric physics)
1 Introduction
Remote sensing of the earth from satellites or of space features from the ground is aected by the ionosphere
due to time delay, refraction, diraction and scattering of waves in the ionosphere. Because there are large diurnal, seasonal and other solar-induced variations in the ionosphere, users of radio systems must cope with large ¯uctuations in ionospheric eects. Ionospheric electron content (IEC) is a parameter which is used to monitor the temporal and spatial behaviour of the ionosphere. It is easily measured using satellite trans-missions in the VHF band. It is subjected to signi®cant dynamical changes, particularly in the equatorial and low latitude regions, owing to the changes in the electric ®elds (Kelley, 1989). At mid-latitudes, these eects are not signi®cantly seen, as the dynamical processes are mainly controlled by neutral winds in that region. Studies of diurnal and seasonal variations of IEC (in units of 1016 electrons/m2, denoted by TECU) as
measured from orbiting as well as geostationary satel-lites have been made by a large number of workers worldwide, and summarised in some excellent reviews by Tyagi and Das Gupta (1990), Davies (1991) and Rama Rao et al. (1994). Recently Chakraborty et al. (1999) have reported 13 years' observations of post-sunset total electron content and scintillations, emphas-ising the coupling between equatorial and low-latitude dynamics.
This work analyses the diurnal, seasonal, solar and magnetic activity variations of IEC observed at Delhi (geographic co-ordinates: 28.63°N, 77.22°E; geomag-netic coordinates: 19.08°N, 148.91°E) during the period 1975±80and 1986±89 belonging to solar cycles 21 and 22 respectively. IEC observations at Delhi were made by means of the Faraday rotation technique using the geostationary satellites ATS-6, Symphonie-II and ETS-II. In addition, the characteristics of day-to-day vari-ability in IECmax(the daytime maximum values of IEC,
one per day) at Delhi are discussed and compared with those of other low-latitude stations. An eort has also been made to explore the relationship of IECmax with
magnetic activity (Ap), solar ¯ux (F10.7) and equatorial
electrojet strength measured by the parameter DH, where H is the horizontal component of geomagnetic ®eld in nano Tesla (nT) units.
Correspondence to: J. K. Gupta
2 Data and method of analysis
Faraday rotation (FR) of signals from geostationary satellites viz.; ATS-6 at 140MHz for the period October 1975±July 1976, Symphonie-II at 137 MHz for the period May 1978±April 1979 and ETS-II at 136 MHz from May 1979 to December 1980, and then again for ETS-II from March 1986 to December 1989 recorded at Delhi, have been utilised for the present study. The daytime maximum values of IEC (IECmax) have been
examined on a daily basis. The daily values of equatorial electrojet strength parameter (DH) have been computed using the scheme suggested by Chandra and Rastogi (1974), according to which electrojet strength is deter-mined by the term H (equator) ± H (away from equator). In the present case, Trivandrum (geographic co-ordinates: 8.48°N, 76.95°E; geomagnetic co-ordi-nates: 0.92°S, 146.37°E; magnetic latitude=0.3°N) is taken as an equatorial station and Alibag (geographic co-ordinates: 18.39°N, 72.55°E; geomagnetic co-ordi-nates: 9.63°N, 143.6°E; magnetic latitude=9.5°N) as a low-latitude station. Figure 1 shows a map containing the locations of IEC station (Delhi) and the stations used in the calculations of the electrojet strength (Trivandrum and Alibag) alongwith their geographic co-ordinates and dip latitudes. It is well known that IEC at stations in the equatorial anomaly region can be aected by variations in electrojet strength through the ``fountain eect'', with a delay of 1 to 4 h and a maximum probability of a delay of about 3 h (Malkiat Singh et al., 1979). In the present analysis, in order to see the eect of the electrojet strength in causing a variation on the value of IEC diurnal maximum, IECmax, at a low latitude (Delhi), the diusion time is
taken as 3 h; that is, if IECmax,at Delhi corresponds to
the hour t, then the value of electrojet strength is taken for the hour (t ) 3).
3 Morphology of ionospheric electron content 3.1 Diurnal variation of ionospheric electron content To study the diurnal variation of IEC during high solar activity at Delhi, international quiet days (10days each month) have been selected. Hourly values of IEC have been computed from 0000 to 1600 and values at ®ve-minute intervals from 1605 to 2100 (to study the post-sunset secondary maximum), and then hourly values again from 2100 to 2300 h IST for each day during 1979±80and 1988±89 which are high solar activity periods. Then the monthly and seasonal mean of IEC is calculated. Figure 2a, b shows the seasonal mean (middle curve), upper quartile (r95, upper curve) and
lower quartile (r95, lower-most curve) for quiet days in
summer, winter and equinox seasons of 1979±80and 1988±89 respectively. Upper and lower curves show the con®dence level limits between which 95% of the IEC values lie. Diurnal variation of IEC during low solar activity has been reported by Garg et al. (1977). These studies show that though the behaviour of IEC in summer in high solar activity is similar to that reported by Garg et al. (1977) in low solar activity, it is considerably dierent in winter and equinox seasons. In winter and equinox a secondary peak called post-sunset secondary maximum (PSSM) is found to occur around 2000 h, as shown in Fig 2a, b. The amplitude of the secondary peak is comparable to the daytime peak being about 90% and 84% in the equinoxes of 1979 and 1989 respectively, whereas in the winters of 1979±80and 1988±89 it is 75% and 73% respectively. Garg et al. (1983) also reported post-sunset enhancements in IEC at 16°N or higher geomagnetic latitudes during high solar activity. They attributed it to the development and decay of the post-sunset equatorial anomaly which is primarily controlled by the meridional winds in association with E ´ B drifts. Lakha Singh et al. (1996) computed the diurnal variation of Faraday rotation for low (1975±76) and high solar activity (1980) periods from option-II of the International Reference Ionosphere (IRI) model (Bilitza, 1990) and found that IRI model does not predict the post-sunset secondary maximum.
3.2 Seasonal anomaly in IEC
To study the eect of seasons, solar and magnetic activity on ionospheric electron content, the daytime maximum of IEC (IECmax) has been averaged on a
seasonal basis in each of the two solar cycles 21 and 22. It is found that the value of daytime IECmaxundergoes
appreciable change in the course of dierent seasons of the year. As seen from Table 1 during low solar activity, the winter IECmax is appreciably lower compared to
summer and equinox IECmax. As the solar activity
increases (F10.7 > 100), the winter IECmax overtakes
that of the summer; giving rise to the `winter anomaly' or the `seasonal anomaly'. Equinoctial IECmaxis greater
than both summer as well as winter IECmax during all
solar activity periods at Delhi except for 1980when it is Fig. 1. A map showing the location of IEC station (Delhi) and the
stations used in the calculation of electrojet strength (Trivandrum and Alibag)
equal to winter. The absence of seasonal anomaly at Delhi during 1975±76 was reported by Garg et al. (1977). The observational data for the period 1986±89 con®rm the earlier ®ndings of Bhuyan et al. (1983). However, Lakha Singh et al. (1996) found that IRI (1990) model does not predict the seasonal anomaly in any type of solar activity.
Modi and Iyer (1988) also reported low IECmax
values in summer during 1980. Davies (1991) using GPS satellite time delay measurements, at Boulder (geo-graphic ordinates: 40°N, 254.7°E; geomagnetic co-ordinates: 48.8°N, 223.4°E), Colorado, USA, has also reported higher IECmaxin winter than in summer, and
attributed this to increased plasma loss. Bhuyan (1992) and Huang and Cheng (1995), using IEC data of Lunping (geographic co-ordinates: 25°N, 121.2°E; geo-magnetic co-ordinates: 14.3°N, 191.3°E), Taiwan, for the descending phase of solar activity during 1979±83, have found higher values of IECmax in winter than in
summer in moderate and high solar activity conditions. Rama Rao et al. (1994) have also reported a winter anomaly during high solar activity at Waltair (geo-graphic ordinates: 17.44°N, 83.23°E; geomagnetic co-ordinates: 7.38°N, 153.37°E). Torr et al. (1980) found the daytime F-region winter anomaly at mid-latitudes.
Most of the contribution to ionospheric electron content comes from the F-region. In F-region, electrons are produced by the photo-ionisation of atomic oxygen; the radiation absorbed by molecular nitrogen does not contribute appreciably to the observed ionisation be-cause molecular ions are short-lived in the F-region. Consequently a change in the concentrations of these gases can alter the eective production as well as the loss rate which depends on the concentration of molecular gases. Rishbeth and Setty (1961) suggested that the seasonal changes result from changes in the ratio of the concentration of atomic oxygen and molecular nitrogen in the F-region. Yeh and Liu (1976) showed that the ratio O/N2 increases in winter as compared to that in
summer in high solar activity. Titheridge and Buonsanto (1983) reported that changes in the composition and in the zenith angle can account for the seasonal anomaly. Torr et al. (1980) and Richards and Torr (1986) have shown through model computations that vibrational excitation of N2 can decrease the daytime peak O+
density by more than a factor of 2 during summer, whereas the decrease is less than 10% during winter at solar maximum. Thus increase of the vibrationally excited N2 with increasing solar activity can also
contribute to the increase of winter anomaly in IECmax.
Titheridge (1995) mentioned that strong downward winds occur during the daytime in summer, particularly at latitudes near 30°, producing daytime densities that are appreciably lower than in winter. In high solar activity, the concentration of atomic oxygen in the winter hemisphere is more than twice that in the summer hemisphere. The cause of an atomic oxygen-rich winter atmosphere is believed to be due to the global meri-dional wind. The thermospheric winds transport freshly
Fig. 2. a Diurnal variation of average IEC showing mean (solid curve), Upper quartile (r95,dot
dashed curve) and lower quartile (r95,dashed curve) for quiet days
of summer 1979, winter 1979±80 and equinox 1979 b Shows same but for quiet days of summer 1989, winter 1988±89 and equinox 1989
Table 1. Average daytime IECmax(1016el/m2)
Seasons 1975±76 1978 1979 19801986 1987 1988 1989 Summer 3049 62 8032 37 58 76 Winter 24 91 110132 25 50 120140 Equinox 40 110130132 42 63 135 150
produced atomic oxygen (in the summer hemisphere) to the winter hemisphere. Since the production time is large compared with the transport time, as observed by Yeh and Liu (1976), this process more than compensates for the expected higher value of IECmax that would
other-wise be expected in summer, and there is more IECmaxin
winter than in summer in high solar activity. 3.3 Solar activity control on IEC
As solar UV radiation is the atmosphere's primary energy source, its variability is expected to cause changes in the atmospheric temperature, dynamics and composition. The part of the UV spectrum important for the produc-tion of the Earth's ionosphere is the EUV spectrum and H Lyman-a (121.6 nm), because these radiations ionise the primary atmospheric constituents O, O2, N2, NO, He and
H. Information about the variability of EUV and Lyman-a is necessary for many studies of ionospheric variability. However, because reliable time series of EUV and Lyman-a irradiances are not readily available for long periods (in contrast to the ready availability for 10.7 cm solar ¯ux data), solar emission data at longer wavelengths, by means of the 10.7 cm solar ¯ux index (F10.7), is most frequently used for this purpose.
To study the solar cycle variation of maximum electron content observed on any day, IECmax values
(one per day) corresponding to SKp< 15 are chosen to
minimise the eect of magnetic activity. Data were grouped into three seasons as usual, i.e. summer (May, June, July and August), winter (November, December, January and February) and equinox (March, April, September and October) for each solar cycle. Most of the previous workers, e.g. Titheridge (1973), Koparkar (1987), Rao et al. (1988), Dabas et al. (1993), Balan et al. (1993) and Prasad and Rama Rao (1993) have shown a linear relationship of IECmaxwith F10.7 up to
about 200 ¯ux units, and then a saturation. In the present study separate critical examinations are made of IECmax
and F10.7. After comparing the results of the two
examinations, preference is given to using the 2nd degree polynomial in curve-®tting of the data, because this led to minimal estimated standard errors. As IECmaxwas found
to be independent of solar ¯ux up to about 60units, the independent variable is taken as F10.7-60instead of F10.7.
This gave a reasonable value of IECmaxat lower values of
F10.7¯ux. The study shows the following results.
3.3.1 Solar cycle-21 (1975±80) results. 1. In equinox, the diurnal IECmaxincreases with F10.7up to about 200 ¯ux
units, after which IECmax saturates at a value of
approximately 140TECU, as shown in Fig 3a. The correlation coecient and the second degree polynomial are given by r = 0.88 and y = 5.51 + 1.63X ) 0.005X2
respectively, where y represents IECmax and X
repre-sents solar ¯ux. The correlation coecient for linear ®tting was found to be 0.84.
2. In winter, IECmaxincreases with F10.7up to about 240
units, after which the increase is found to be slowly approaching a value of approximately 140TECU, as
shown in Fig 3b. The correlation coecient and the second degree polynomial are given by r=0.85 and y= )1.99 + 1.23X ) 0.003X2respectively. The correlation
coecient for linear ®tting was found to be 0.82. 3. In summer, the IECmax increases with F10.7 up to
about 240units, after which saturation is observed at a value of approximately 100 TECU, as shown in Fig 3c. The correlation coecient and the second degree polynomial are given by r=0.86 and y=14.28 + 0.87X ) 0.002X2 respectively. The correlation
coe-cient for linear ®tting was found to be 0.83.
3.3.2 Solar cycle-22 (1986±89) results. 1. In equinox season, IECmaxis found to be positively correlated with
F10.7up to about 200 units after which it saturates at a
value of approximately 150TECU, as shown in Fig 4a. The correlation coecient and the second degree Fig. 3a±c. Variation of IECmaxwith solar ¯ux (F10.7) in solar cycle 21
for a equinox, b winter and c summer (the black diamonds show the points of 2nd degree polynomial ®tting)
polynomial are given by: r=0.84 and y=16.78 + 1.68X ) 0.005X2respectively.
2. In winter, IECmaxis found to increase with F10.7up to
about 240units at which IECmax is approximately 150
TECU, as shown in Fig 4b. The correlation coecient and the second degree polynomial are given by r=0.90 and y=7.08 + 1.54X ) 0.002X2respectively.
3. In summer, IECmaxis found to increase with F10.7up
to about 240units, after which IECmax saturates at a
value of approximately 70TECU, as shown in. Fig 4c Here the correlation coecient and the second degree polynomial are given by r=0.88 and y=20.95 + 0.57X ) 0.002X2respectively.
The results of non linear variation of IECmax with
F10.7 in solar cycles 21 and 22 are almost of a similar
nature. In general, we may say that IECmax increases
with F10.7 up to about 200±240 ¯ux units depending
upon season, after which it generally saturates at a value of approximately 70±150 TECU which is seasonally dependent. The results are slightly better described in solar cycle-22 as IECmaxdata for higher values of solar
¯ux are available.
Bhuyan et al. (1983) and Rao et al. (1988) also reported saturation of IECmax at northern latitudes
during solar cycle-21. Koparkar (1987) reported the relationship between IECmaxand F10.7to be linear up to
150TECU which agrees substantially with the present data. Prasad and Rama Rao (1993), using low solar activity data from Waltair (a station within the equa-torial anomaly region), found a linear relationship between IECmax and F10.7 up to 100 TECU. Their
observations indicated that the correlation coecient was higher (0.43) in summer than in equinox (0.25) and winter (0.34). They also found that the gradient of IECmaxversus solar ¯ux in winter was more than that in
equinox and summer, compared with the present observations of minimum gradients in summer but maximum gradients in equinox. Balan et al. (1993) found the IECmax increasing linearly with F10.7 up to
about 200 ¯ux units and saturation at higher ¯ux values at all latitudes from 17°N to 47°N, and in all the seasons. They found convincing ionospheric evidence of a non-linear relationship between the solar EUV and 10.7 cm solar ¯uxes during intense solar cycles. They also found that plots for magnetically quiet days showed less scatter compared with data observed on all mag-netically active conditions.
3.4 Magnetic activity control on IEC
Solar wind aects the ionosphere by producing changes in the Earth's magnetic ®eld and in particle precipita-tion. To study the control of geomagnetic activity on the ionosphere, IECmax behaviour observed at Delhi is
analysed. Jain et al. (1978), Dabas et al. (1980, 1984) and Kane (1981) studied the same phenomena using magnetic storms' data from 23°N±30°N latitudes in low solar activity, and inferred that IECmax does not show
any systematic variation during magnetic storms. As distinct from the behaviour during magnetic storms, Koparkar (1987) examined the average behaviour during low solar activity using data from Bombay (geographic co-ordinates: 18.55°N, 72.55°E; geomag-netic co-ordinates: 9.58°N, 143.28°E). She also found that IECmaxdid not have any clear dependence on Ap.
Prasad and Rama Rao (1993) using Waltair IECmax
data also did not ®nd any clear dependence on Apduring
low, as well as high, solar activity. The absence of any signi®cant correlation between IECmax and Ap may
partly be due to the averaging eect of quiet and disturbed day indices which the authors have not taken into account. In the present study storm days' data have been excluded.
Another diculty in studying the control of magnetic activity over an extended period is that changing solar activity also aects the IECmax. Therefore, to minimise
Fig. 4a±c. Variation of IECmaxwith solar ¯ux (F10.7) in solar cycle 22
for a equinox, b winter and c summer (the black diamonds show the points of 2nd degree polynomial ®tting)
solar activity bias, the data are grouped into two periods: (1) low solar activity and (2) high solar activity. For the low solar activity period, IECmax data having
F10.7in the range from 60±100 units is used whereas for
high solar activity, F10.7in the range of 180±220 units is
used. The correlation coecients of IECmaxwith Ap in
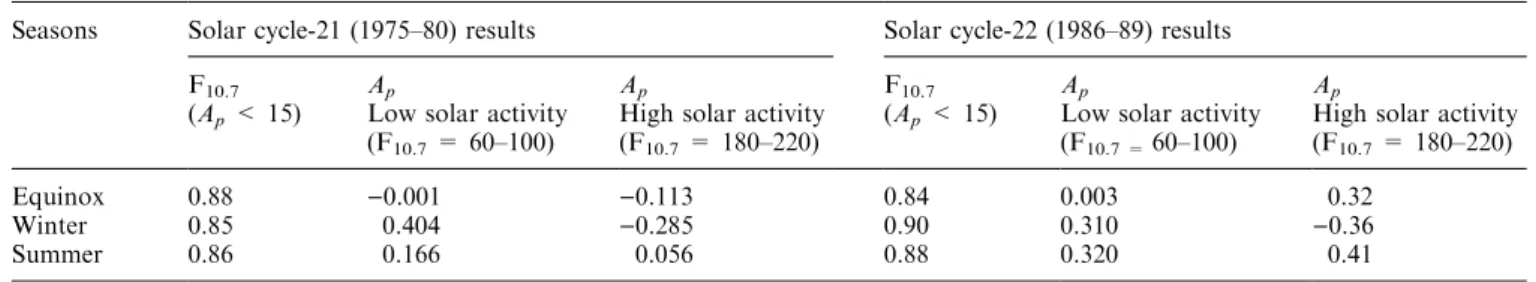
low as well as high solar activity for solar cycles 21 and 22 are presented in Table 2. Other results of the study are given:
3.4.1 Solar cycle-21 (1975±80). 1. Low solar activity (1975±76) results: in equinox, IECmaxis independent of
Ap. It is found to increase linearly with Apin winter and
summer.
2. High solar activity (1979±80) results: IECmaxis found
to decrease linearly with Ap in equinox and winter
whereas in summer it shows slight increase with Ap.
3.4.2 Solar cycle-22 (1986±89). 1. Low solar activity (1986) results: in equinox, IECmaxis almost independent
of Apwhereas it increases linearly with Apin winter and
summer.
2. High solar activity (1989) results: while in equinox IECmax shows a linear increase with Ap, in winter it
decreases linearly with Ap and in summer it again
increases with Ap.
From the low solar activity results of solar cycles 21 and 22, the linear relationship of IECmaxand Apis seen
to be similar in all seasons. However, the gradients are greater in all the seasons of 1986 compared with those in the seasons of 1975±76. During the high solar activity period of 1980, IECmax and Ap are more or less
independent in equinox and summer, but they show negative correlation in winter, whereas in 1989 there is a good positive linear relationship between IECmaxand Ap
during equinox and summer, but winter 1989 shows linear decrease.
4 Day-to-day variability in IEC
The large day-to-day variability in IECmax has been
observed world wide, irrespective of geographic loca-tion, local time, season of the year, solar EUV ¯ux and magnetic activity conditions. On a given day at any one location, changes in IECmax up to one order of
magnitude are common. Lakha Singh et al. (1996) compared the actual Faraday rotation (FR) observa-tions monitored at Delhi with Faraday rotation
com-puted from Option-II of the International Reference Ionosphere (IRI) model (Bilitza, 1990) and reported that the IRI (1990) model grossly overestimates the daytime as well as night time FR in low (1975±76) and high solar activity (1980) periods. During low solar activity (1975± 76), the daytime overestimations in FR in all seasons are found to lie between 185 and 320%. and post-midnight overestimations in FR values lie in the range of 130± 205% and 95±200% respectively. During high solar activity (1980), the daytime FR values predicted by the IRI are overestimated by 70to 110%. The pre-midnight and post-midnight values are also overestimated by 55 to 115% and 100 to 280% respectively. However, in the 0500±0600 h time slot, the estimates are within 20% in all seasons during low solar activity and in winter and autumnal equinox of high solar activity. Though a number of theories have been put forward by various workers to explain the day-to-day variability in iono-spheric electron content, many events could not be explained.
To study the day-to-day changes in daytime IECmax,
data obtained at Delhi during ascending phases of solar activity during 1975±80(solar cycle-21) and 1986±89 (solar cycle-22) are used. The variations in daytime IECmaxon a day-to-day basis observed in this study may
be classi®ed into three categories i.e. single-day, alter-nate-day and long-term variability, as discussed next. 4.1 Single-day abnormality
A single day abnormality in IECmax is one which is
observed on a particular day only, i.e. on this day the IECmaxis high or low compared to that on the preceding
and following days. There are six cases of single day abnormality worth noting in 1975±76, whereas in 1986 ten such cases are present. It is found that they have no pattern with regard to their seasonal occurrence. Figure 5a shows an example of a single day abnormality observed on April 21, 1986, when magnetic activity and solar activity were found to be normal, but the electrojet strength showed some abnormal behaviour during this period. This shows that this single day abnormal increase in IECmaxmay have a correlation with
electro-jet strength. Sometimes the single day abnormality does not show any correlation with F10.7, DH (de®ned as the
change in the horizontal component of the geomagnetic ®eld) and Ap. A single day abnormality may be of
localised nature. The present results agree well with Table 2. Correlation coecients of IECmaxwith F10.7and Ap
Seasons Solar cycle-21 (1975±80) results Solar cycle-22 (1986±89) results
F10.7 Ap Ap F10.7 Ap Ap
(Ap< 15) Low solar activity High solar activity (Ap< 15) Low solar activity High solar activity
(F10.7= 60±100) (F10.7= 180±220) (F10.7 =60±100) (F10.7= 180±220)
Equinox 0.88 )0.001 )0.113 0.84 0.003 0.32 Winter 0.85 0.404 )0.285 0.90 0.310 )0.36 Summer 0.86 0.166 0.056 0.88 0.320 0.41
those of Tyagi and Mitra (1970) and Tyagi (1978) for Delhi, and Dabas et al. (1984) for locations around the crest of the equatorial anomaly; these workers found the single day abnormality events of localised nature. They attributed abnormal increases in daytime IECmaxduring
low solar activity to temperature and composition changes in the thermosphere. Jayachandran et al. (1995) found that short-term day-to-day variability in IECmaxdid not have any dependence on solar ¯ux at low
latitudes. At temperate latitudes, Rama Rao et al. (1981) interpreted the day-to-day changes in the F-region as being due to changes in local atmospheric conditions in the thermosphere. At middle latitudes, Kane (1975) suggested that the day-to-day variability in IECmaxis due to erratic equatorward neutral winds that
originate in polar regions intermittently even under quiet conditions, creating convective cells that wander slowly around the globe, and result in ionospheric irregularities of scale length about 3000 km.
Single day abnormality in IECmaxis not restricted to
low solar activity only; it is observed during high solar activity also. There are a few cases showing single day
abnormality features in 1979 and 1989, but increases in IECmaxon these days are always found to be associated
with increases in one or more of the geophysical parameters DH, F10.7 or Ap. This is as expected, and
not simply a localised eect. 4.2 Alternate day abnormality
IECmax also shows increase and decrease on alternate
days for a few days continuously. This is called alternate day abnormality. IECmaxvalues are found to ¯uctuate
for many days during low as well as high solar activity at Delhi. From Fig. 5b which shows alternate days ¯uctu-ations in IECmaxfor several days during January 1989, it
is obvious that there is no substantial variation in the values of magnetic activity (Ap) and solar ¯ux (F10.7),
whereas equatorial electrojet parameter (DH) ¯uctuates almost in unison with IECmax. There is almost
one-to-one correspondence between daytime IECmax and
equatorial electrojet strength. Similar behaviour has also been observed in low solar activity. This shows that IECmax values are aected by the strength of the
equatorial electrojet observed at Delhi in low, as well as in high, solar activity of both solar cycles. Dabas et al. (1984) reported one-to-one correspondence of equatorial electrojet strength with IECmax recorded in
November 1975 even at Patiala (geographic co-ordi-nates: 30.20°N, 76.25°E; geomagnetic co-ordico-ordi-nates: 20.74°N, 148.21°E) which is considered to be outside the anomaly belt. Rama Rao et al. (1994) found day-to-day IECmax variations to be controlled by equatorial
electrojet strength at Waltair during summer. Prasad and Rama Rao (1993) also found day-to-day changes in IECmax at Waltair particularly in summer during low
solar activity, and inferred that the changes are mainly controlled by the strength of the equatorial electrojet. Alex and Rastogi (1989) observed more day-to-day variations at Ahmedabad (geographic co-ordinates: 23.03°N, 72.40°E; geomagnetic co-ordinates: 14.05°N, 143.71°E) which is situated near the crest of equatorial anomaly region, than at the equatorial stations of Ootacamund (geographic co-ordinates: 11.24°N, 76.44°E; geomagnetic co-ordinates: 1.88°N, 146.77°E) and Kodaikanal (geographic co-ordinates: 10.13°N, 77.32°E; geomagnetic co-ordinates: 0.69°N, 146.91°E) and Huancayo (geographic co-ordinates: 12°S, 284.7°E; geomagnetic co-ordinates: 0.7°S, 186.1°E). They ex-plained their observations as being due to the resultant eect of dumping of ionisation at these latitudes through the equatorial `fountain eect'.
The alternate day variability or two-day oscillation of the ionospheric electron content and equatorial electrojet may be attributed to the planetary waves which have a period of more than one day. The planetary wave with a period of two days modulates the tidal wind which results in alternate day oscillation of equatorial electrojet which in turn controls the IECmaxwithin the equatorial anomaly region.
Pei-Ren-Chen (1992) has con®rmed this relationship using numerical simulation. APRIL 1996 75 50 25 0 0 50 50 0 0 4 8 12 16 20 24 28
DAYS OF THE MONTH JANUARY 1989 100 50 0 −50 300 250 200 150 100 50 0 0 15 20 25
DAYS OF THE MONTH
IEC F10.7 Ap ∆ H ∆ H Ap F10.7 IEC
Fig. 5. a Single day and b alternate day abnormalities in IECmax
(1016el/m2) and DH (nano Tesla, nT) but not in F
10.7(10)22Watts/
square meter/cycle per second bandwidth) and Ap
Deshpande et al. (1977), Sethia et al. (1980) and Lakshmi et al. (1985) showed that there exists a close correlation between the development of equatorial anomaly in IECmax and the electrojet strength at the
crest location whereas there exists no such correlation at the equator. Dabas et al. (1984) studied the day-to-day changes in IECmaxusing multi-station data covering the
15°N±30°N latitude range in the Indian zone during solar minimum. They found that short-term, as well as long-term variations in the daytime maximum electron content within and near the crest of the equatorial belt are mainly controlled by the equatorial electrojet strength. Alex and Rastogi (1989) found the day-to-day variability in IECmax at the crest location of
Ahmedabad higher than the equatorial values, and attributed this to day-to-day changes in the equatorial electric ®eld.
Dabas et al. (1984) studied the diurnal variation of the average percentage variation of IECmaxduring quiet
(QQ) and disturbed (DD) days. They found the QQ and DD (time variations of IECmax) to be mirror images of
each other at low latitudes at Ahmedabad, Gauhati (geographic co-ordinates: 26.11°N, 91.47°E; geomag-netic co-ordinates: 15.41°N, 161.86°E) and Patiala in winter for all local times, and in summer at Kurukshetra (geographic co-ordinates: 29.9°N, 76.8°E; geomagnetic co-ordinates: 20.39°N, 148.68°E). Prasad and Rama Rao (1993), using Waltair IECmax data observed QQ
and DD curves to be the mirror images of each other excepting at about 0700 h LT in summer in low, as well as in high, solar activity periods. They reported that although no direct correlation with magnetic activity is apparent, there is a systematically higher variability on QQ than on DD days in daytime hours of winter months in low solar activity period. However, Arvindan and Iyer (1990) using Hawaii (geographic co-ordinates: 20°N, 155°W; geomagnetic co-ordinates: 11.71°N, 221.81°E) data found a systematically higher variability on DD days than on QQ days during daytime in high solar activity periods. No signi®cant dierence between quiet and disturbed day values is found at Tokyo (geographic co-ordinates: 35.40°N, 138.45°E; geomag-netic co-ordinates: 25.45°N, 154.51°E).
4.3 Longterm periodic ¯uctuations
Apart from shortterm ¯uctuations in IECmax values,
long-term periodic variations from the average values have also been observed at Delhi. During a high solar activity period of 1979 (March, November and Decem-ber), a 27-day periodicity was observed in IECmax. In
equinox, the 27-day periodicity in IECmax is
accompa-nied by similar variations in F10.7, but DH and Apdo not
show such periodicity. In November and December, a 27-day periodicity is found in IECmax, F10.7and DH, but
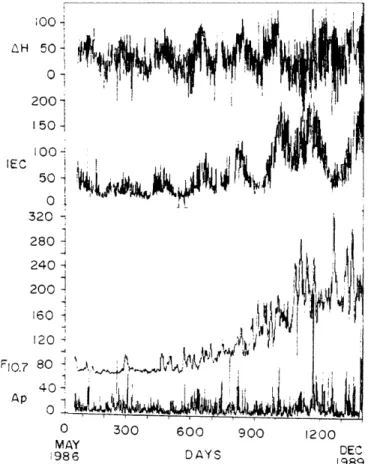
no such periodicity is observed in Ap. Figure 6 shows
15-day running means of the data from November 1988 to February 1989 (winter). The running means were taken to reduce the scatter. A 27-day variation in IECmaxand
F10.7 solar ¯ux is clearly seen from the ®gure. Dabas
et al. (1984) also observed that in summer, IECmax
shows a periodicity of about 27-days at Delhi, Ahme-dabad, Gauhati and Bombay which is similar to the solar ¯ux variation, and also to the variation in the electrojet strength. However, shortterm variations are again mainly controlled by electrojet strength, and not by solar ¯ux which shows small variability.
Annual and semi-annual variations in IECmax are
quite evident from the data of solar cycle 21 and 22 at Delhi during low, as well as high, solar activity periods. Figure 7 shows that the annual and semi-annual ¯uctu-ations in IECmax tend to be in phase with equatorial
electrojet variations. Such periodic variations are not seen in Ap and F10.7 at Delhi. Bhuyan (1992) found
annual and semi-annual variations in IECmax at
Lun-ping under all levels of solar activity. Based on calcu-lations of scale height of the absorbing gas, it is found that in equinoctial months, solar radiation is absorbed mainly by atomic oxygen. This causes high values of IECmax in the equinoxes (March and October), and is
Fig. 6. Diagram showing 27-day periodicity in IECmax(1016el/m2)
and solar ¯ux, F10.7 (10)22Watts/square meter/cycle per second
responsible for semi-annual variations. Low IECmax is
observed in winter when solar activity is low and also in summer when solar activity is high. This gives rise to annual variations in IECmax during both low and high
solar activity periods. Mayr and Mahajan (1971) have shown that the observed variation in the neutral composition ratios, O/O2 and O/N2, is sucient to
produce semiannual variations in the F2 maximum
density. Titheridge (1973) has attributed this to changes in global atmospheric circulation at the equinox, giving a rapid decrease in the loss rate and a change in the pattern of vertical drifts. Prasad et al. (1987) using 1978 IECmaxdata of Waltair noted the semi-annual variation
in IECmax which they explained on the basis of the
strong control which the sun's radiation exerts on the ionisation density during equinoxes.
Huang and Cheng (1995) using Lunping IECmaxdata
also observed two maxima and two minima annually during high solar activity. In general, IECmax has
comparable values in both the solar cycles in low solar activity, whereas in high solar activity IECmaxis found
to be slightly more (220TECU) in solar cycle 22 as compared to (200 TECU) in solar cycle 21 at Delhi. Koparkar (1987) reported that in low solar activity of 1984 IECmax was double that of 1975±76 at Bombay,
close to the anomaly peak, but it is not so at Delhi. IECmax variations observed at Delhi appear to be
controlled by the equatorial electrojet strength and are
related to the coupling between the equatorial and low latitude ionisation as a result of electrodynamic drift and diusion. The F-region ionisation between 15° dip latitudes is dominantly controlled by the well-known `fountain eect'. A strong electrojet implies a larger E ´ B drift at the magnetic equator, and the develop-ment of a pronounced equatorial anomaly. Hence the observed day-to-day variability of IECmax at low
latitudes, and its correlation with DH variability, is a manifestation of the electrodynamic coupling between the equatorial and low-latitude ionosphere. Thus the present study made at Delhi of day-to-day variability based on IECmaxdata and other geophysical parameters
for varying levels of solar activity, supports the conclu-sions of previous studies, and highlights the importance of electrodynamic coupling between the equatorial and low latitude ionosphere.
5 Conclusion
Data spread over two solar cycles have been utilised to examine the response of the ionosphere over Delhi for various geophysical conditions using ionospheric elec-tron content as a parameter. Data for abnormal conditions (disturbed days) have not been included. The diurnal variation of seasonal mean of IEC on quiet days shows a secondary peak comparable to the daytime peak in equinox and winter in high solar activity. This may be produced by the combined eect of meridional winds and E ´ B drifts. IECmax shows winter anomaly
only during high solar activity at Delhi. Composition changes (Titheridge and Buonsanto, 1983) and decrease of O+ density during summer due to vibrational
excitation of N2 may be responsible for the seasonal
anomaly (Torr et al., 1980; Richards and Torr, 1986). IECmaxshows positive correlation with F10.7up to about
200 ¯ux units in equinox and 240 units both in winter and summer; for greater F10.7 values, IECmax is
sub-stantially constant in all the seasons. IECmax and
magnetic activity (Ap) are found to be positively
correlated in summer in high solar activity. This is in conformity with the results of Balan et al. (1993) at dierent latitudes. Winter IECmaxshows positive
corre-lation with Ap in low solar activity and negative
correlation in high solar activity in both the solar cycles. In equinox IECmax is independent of Ap in both solar
cycles in low solar activity. A study of day-to-day variations in IECmaxshows single day and alternate day
abnormalities, semi-annual and annual variations. It is found that IECmaxvalues observed at Delhi during low
as well as high solar activity of both solar cycles are aected by strength of the equatorial electrojet. Alter-nate day abnormalities may have been produced by planetary scale waves. The results have been compared with IRI (1990) model and found that actual FR observations and those derived from the model dier to a great extent at low latitudes.
Acknowledgements. Topical Editor M. Lester thanks E.A. Engi and G. Goodwin for their help in evaluating this paper.
Fig. 7. Semi-annual and annual variations in IECmax(1016el/m2) and
DH (nano Tesla, nT) but not in F10.7 (10)22Watts/square meter/
cycle per second bandwidth) and Apduring solar cycle 22
References
Alex, S., and R. G. Rastogi, Day-to-day variability of maximum electron density and ionospheric electron content at equatorial stations, Ind. J. Radio Space Phys., 18, 99±102, 1989.
Arvindan, P., and K. N. Iyer, Day-to-day variability in ionospheric electron content at low latitudes, Planet. Space Sci., 38, 743± 750, 1990.
Balan, N., G. J. Bailey, and B. Jayachandran, Ionospheric evidence for a nonlinear relationship between the solar e.u.v. and 10.7 cm ¯uxes during an intense solar cycle, Planet Space Sci., 41, 141± 145, 1993.
Bhuyan, P. K., Diurnal, seasonal and solar cycle variation of TEC, NmF2 and slab thickness at Lunping, Ind. J. Radio Space Phys., 21, 170±178, 1992.
Bhuyan, P. K., T. R. Tyagi, Lakha Singh, and Y. V. Somayajulu, Ionospheric electron content measurements at a northern low mid-latitude station through half a solar cycle, Ind. J. Radio Space Phys., 12, 84±93, 1983.
Bilitza, D., International Reference Ionosphere, 1990, National Space Science/World Data Center-A for Rockets and Satellites, 90±22, 1990.
Chakraborty, S. K., A. Das Gupta, S. Ray, and S Banerjee, Long-term observations of VHF scintillation and total electron content near the crest of the equatorial anomaly in the Indian longitude zone, Radio Sci., 34, 241±255, 1999.
Chandra, H., and R. G. Rastogi, Geomagnetic storm eects on ionospheric drifts and the equatorial Es over the magnetic
equator, Ind. J. Radio Space Phys., 3, 332±336, 1974.
Chen, Pei-Ren, Two-day oscillation of the equatorial ionization anomaly, J. Geophys. Res., 97(A5), 6343±6357, 1992.
Dabas, R. S., J. B. Lal, T. R. Tyagi, and Y. V. Somayajulu, Variations of total electron content and other ionospheric parameters associ-ated with magnetic storms, Ind. J. Radio space Phys., 9, 1±6, 1980. Dabas, R. S., P. K. Bhuyan, T. R. Tyagi, R. K. Bhardwaj, and J. B. Lal, Day-to-day changes in ionospheric electron content at low latitudes, Radio Sci., 19, 749±756, 1984.
Dabas, R. S., D. R. Lakshmi, and B. M. Reddy, Solar activity dependence of ionospheric electron content and slab thickness using dierent solar indices, PAGEOPH (France), 140, 721± 728, 1993.
Davies, K., Remote sensing of the ionosphere using satellite beacons, Ind. J. Radio Space Phys., 20, 356±367, 1991. Deshpande, M. R., R. G. Rastogi, H. O. Vats, J. A. Klobuchar,
G. Sethia, A. R. Jain, B. S. Subba Rao, V. M. Patawari, A. V. Janve, R. K. Rai, Malkiat Singh, H. S. Gurm, and B. S. Murthy, Eect of electrojet on total electron content of the ionosphere over the Indian sub-continent, Nature, 267, 599±600, 1977.
Garg, S. C., P. N. Vijayakumar, L. Singh, T. R. Tyagi, and Y. V. Somayajulu, Early results of ATS-6 radio beacon experiment at New Delhi, Ind. J. Radio Space Phys., 6, 190±196, 1977. Garg, S. C., Y. V. Somayajulu, Lakha Singh, and T. R. Tyagi,
Evidence of the development and decay of a post sunset equatorial anomaly at low latitudes, Proc. International Symposium on ``Beacon Satellite studies of the earth's environment'' held at National Physical Laboratory, New Delhi, India, 359±373, 1983. Huang, Y. N., and K. Cheng, Solar cycle variation of the total electron content around equatorial anomaly crest region in east Asia, J. Atmos. Terr. Phys., 57, 1503±1511, 1995.
Jain, A. R., M. R. Deshpande, G. Sethia, R. G. Rastogi, Malkiat Singh, H. S. Gurm, A. V. Janve, and R. K. Rai, Geomagnetic storm eects on ionospheric electron content in Indian zone, Ind. J. Radio Space Phys., 7, 111±118, 1978.
Jayachandran, B., R. B. Nair, N. Balan, and P. B. Rao, Short term variabilities of ionospheric electron content (IEC) and peak electron density (NP) during solar cycles 20and 21 for a low latitude station, J. Atmos. Terr. Phys., 57, 1599±1609, 1995. Kane, R. P., Day-to-day variability of ionospheric electron content
at mid-latitudes, J. Geophys. Res., 80, 3091±3099, 1975.
Kane, R. P., Storm eects of ionospheric total electron content at low latitudes, J. Geomagn. Geoelectr., 33, 399±409, 1981. Kelley, M. C., The Earth's ionosphere, Academic Press, San Diego,
1989.
Koparkar, P., Ionospheric electron content measurements at Bombay, a station close to Appleton anomaly peak region, Ind. J. Radio Space Phys., 16, 408±410, 1987.
Lakshmi, D. R., R. S. Dabas, and B. M. Reddy, Relationship between short-term variations in electron content and foF2 over the Indian zone, Ind. J. Radio Space Phys., 14, 117±121, 1985. Malkiat Singh, H. S. Gurm, and A. R. Jain, Equatorial electrojet and total electron content anomaly, Ind. J. Radio Space Phys., 8, 44±46, 1979.
Mayr, H. G., and K. K. Mahajan, Seasonal variation in the F2 region, J. Geophys. Res., 76, 1017±1027, 1971.
Modi, R. P., and K. N. Iyer, Ionospheric electron content near the peak of the equatorial anomaly in Indian zone during solar maximum, Ind. J. Radio Space Phys., 17, 98±102, 1988. Prasad, D. S. V. V. D., and P. V. S. Rama Rao, Day-to-day
variability of ionospheric electron content over Waltair, Ind. J. Radio Space Phys., 22, 391±396, 1993.
Prasad, D. S. V. V. D., K. Niranjan, and P. V. S. Rama Rao, TEC and equivalent slab thickness at low and mid latitudes ± a comparative study, Ind. J. Radio Space Phys., 16, 295±299, 1987. Rama Rao, P. V. S., P. Sriram, and P. T. Jayachandran, Short- and long-term variations in IEC over Waltair, Ind. J. Radio Space Phys., 23, 340±346, 1994.
Rama Rao, P. V. S., D. Nru, and M. Srirama Rao, Study of some low latitude ionospheric phenomena observed in TEC mea-surements at Waltair, India, in Scienti®c and Engineering uses of Satellite Radio Beacons, Proc. COSPAR/URSI Symposium, Warszawa, Poland, May 19±23, 1980, Ed A. W. Wernik, 175± 187, Polish Scienti®c Publishers, Warsaw, 1981.
Rao, P. B., B. Jayachandran, and N. Balan, Low latitude TEC and Np variations during the solar cycles 20 and 21, Proc. URSI Intl. Beacon Satellite Symposium, Beijing, China, p. 241±249, 1988. Richards, P. G., and D. G. Torr, A factor of 2 reduction in theoretical F2 peak electron density due to enhanced vibrational excitation of N2in summer at solar maximum, J. Geophys. Res.,
91, 11331±11336, 1986.
Rishbeth, H., and C. S. G. K. Setty, The F-layer at sunrise, J. Atmos. Terr. Phys., 20, 263±276, 1961.
Sethia, G., R. G. Rastogi, M. R. Deshpande, and H. Chandra, Equatorial electrojet control of the low latitude ionosphere, J. Geomag. Geoelectr., 32, 207±216, 1980.
Singh, L., J. K. Gupta, and T. R. Tyagi, Comparison of Faraday rotation observations at Delhi with IRI model, Adv. Space Res. 18, 241±244, 1996.
Titheridge, J. E., The electron content of the southern mid-latitude ionosphere, 1965±71, J. Atmos. Terr. Phys., 35, 981±1001, 1973. Titheridge, J. E., Winds in the ionosphere: a review, J. Atmos. Terr.
Phys., 57, 1681±1714, 1995.
Titheridge, J. E., and M. J. Buonsanto, Annual variations in the electron content and height of the F layer in the northern and southern hemispheres, related to neutral composition, J. Atmos. Terr. Phys., 45, 683±696, 1983.
Torr, D. G., M. R. Torr, and P. G. Richards, Causes of the F-region winter anomaly, Geophys. Res. Lett., 7, 1980.
Tyagi, T. R, Day-to-day changes in ionospheric electron content, Proc. COSPAR Satellite Beacon Group Symposium, Florence, Italy 9±1 to 9±6, 1978.
Tyagi, T. R., and A. P. Mitra, Some geographic and geophysical aspects of total electron content of the ionosphere, J. Atmos. Terr. Phys., 32, 1807±1818, 1970.
Tyagi, T. R., and A. Das Gupta, Beacon satellite studies and modelling of total electron content of the ionosphere, Ind. J. Radio Space Phys., S K Mitra Memorial Special Issue, 424±438, Oct. 1990.
Yeh, K. C., and C. H. Liu, Motions in the ionosphere, Sci. Prog., Oxf., 63, 111±140, 1976.